Fatigue Damage Evaluation of High-strength Bolt for Tower of Wind Turbine
Shixiong Gao*, Juncheng Liu, Xing Wang, Chentan Zhao and Feijiang Wu
School of Control and Computer Engineering, North China Electric Power University, Beijing 102206, China
E-mail: gsx2007dq@163.com
*Corresponding Author
Received 11 December 2024; Accepted 10 March 2025
Abstract
Due to the particularity of wind resources and different wind conditions in different locations, wind turbines accumulate fatigue damage at different speeds, and the existing methods fail to provide accurate and personalized fatigue damage evaluation. A fatigue evaluation method based on machine learning was established based on the connection bolts of wind turbine tower flanges. GH Bladed software was used to simulate and calculate the load time data of normal power generation conditions under wind conditions with different parameter combination. Then, fatigue damage of bolts was obtained using Schmidt-Neuper algorithm, wind condition parameters-fatigue damage data set was established, and fatigue damage was converted into equivalent fatigue stress (EFS). The mapping model of wind condition parameters and EFS is established based on various machine learning algorithms, and the corresponding fatigue damage can be obtained according to any combination of wind condition parameters. The results demonstrate that XGBoost algorithm achieves the highest accuracy in fatigue damage evaluation.
Keywords: Wind turbine, tower cylinder flange, bolt, the equivalent fatigue stress, machine learning.
1 Introduction
The wind turbines (WT) tower serves as a crucial load-bearing element in wind power systems. Characterized by its uniform structure and substantial dimensions, the tower’s integrity is maintained through the use of flanges connected by high-strength bolts. Operating within a demanding environment with erratic wind conditions, these bolts are continuously exposed to alternating stresses. Such conditions can precipitate fatigue failure, potentially resulting in catastrophic collapse of tower structure. Consequently, conducting an effective evaluation of the fatigue damage to high-strength bolts at the WT tower’s flange connections is imperative for ensuring the safe operation of WT.
Fatigue damage refers to the progressive accumulation of material degradation under fluctuating cyclic loading. It is quantified as the cumulative ratio of actual cycles to allowable cycles under varying stress ranges. Existing research primarily focused on the calculation methods of fatigue damage for high-strength bolts at the joints of tower flanges. Kang et al. [1] used finite element modeling to calculate the limit and fatigue loads for high-strength bolts. Alonso-Martinez et al. [2] examined the effects of factors such as bolt preload, the number of bolts, and flange thickness on bolt fatigue damage through calculations. Yu et al. [3] verified the design fatigue life of bolts at the connection between the bottom of the WT tower and the foundation flange by converting the load at the center of the flange into a stress-time history for the bolts. In these methods, the fatigue damage of bolts were usually evaluated under the predefined wind load conditions [4]. However, given that WTs are subjected to varying wind conditions [5] during over the operational life, we also need to design personalized evaluation methods.
Considering the effects of varying wind condition parameters such as wind speed, turbulence intensity, wind shear, and inflow angle [6, 7] on the fatigue loading of WT components, Leian et al. [8] evaluated the fatigue life of in-service WT by determining the design equivalent fatigue load. Meanwhile, Mendez et al. [9] developed a fatigue load database through sensitivity analysis of turbine loads and calculated the fatigue load using an interpolation method, accounting for variations in wind conditions at different WT locations. The accuracy of this method depends on the expansion of the database, requiring fine division of wind condition parameters, which increases computational effort.
To enhance the efficiency of evaluation processes, numerous methods have been proposed. Teixeira et al. [10] utilized a Kriging surrogate model to estimate short-term fatigue damage across various environments. Murcia et al. [11] employed a response surface model, while Wilkie et al. [12] developed a wind turbine fatigue damage surrogate model using Gaussian process regression, significantly reducing computational demands and enhancing efficiency. Although traditional models can effectively model the relationship between wind conditions and fatigue damage evaluation indices, these methods still face challenges regarding fitting accuracy, operational efficiency, and generalization capability. Li and Zhang [13] explored two surrogate models—the Kriging method and an artificial neural network (ANN) model—to predict short-term fatigue damage. The ANN method demonstrated excellent prediction accuracy and performance.
Traditional methods for evaluating fatigue damage, such as finite element analysis [1] and look-up table method [9], provide accurate results but require extensive computational resources. Recent studies have explored surrogate models (e.g., Kriging model [10], response surface model [11]) to reduce computational costs, yet their accuracy and generalization remain limited. Researchers have begun to introduce machine learning algorithms such as ANN [13]; however, there remains a lack of comparative analysis among different machine learning algorithms. Notably, the significant variation in fatigue damage magnitudes under different wind conditions poses challenges for machine learning model training. While equivalent fatigue stress can normalize fatigue damage across wind conditions into a narrow range, no study has systematically compared machine learning algorithms (e.g., XGBoost, RF) for mapping wind parameters to EFS. To address these gaps, this study proposed an EFS-based framework integrated with XGBoost, enabling accurate and personalized fatigue damage evaluation under varying wind conditions.
The rest of this paper is structured as follows: Section 2 introduces the fatigue damage calculation method for tower bolts under varying wind condition parameters. Section 3 describes the process of converting fatigue damage into EFS. Section 4 outlines the modeling process for different machine learning methods and fatigue damage evaluation techniques. Section 5 presents an analysis and comparison of the predictive performance of different algorithms, followed by a verification of their effectiveness. Finally, Section 5 concludes the paper and discusses the conclusions of the study.
2 Fatigue Damage Data Set
To quickly and accurately evaluate the fatigue damage of bolts, we first calculated the fatigue damage of bolts under various wind conditions and constructed a wind parameters–fatigue damage dataset. Next, we established the relationship between wind conditions and fatigue damage using a machine learning algorithm. The establishment of the dataset encompasses three main components: simulation of wind conditions and load data, tower bolts stress calculation, and fatigue damage computation.
2.1 Simulation of Wind Conditions and Loads
Research has demonstrated that wind characteristics, such as wind speed, turbulence intensity, wind shear, and inflow angle, can significantly influence the fatigue damage sustained by high-strength bolts in wind turbine towers. To capture the full spectrum of environmental conditions that may occur in real-world wind farms, various wind characteristic parameters are discretized to form a comprehensive set of incoming wind conditions. When selecting the range of wind parameters, it is crucial to consider the physical characteristics and behavior of the wind, prioritizing parameters that have a substantial impact on the load to ensure accurate load simulation results. The load simulation software GH Bladed was employed to obtain short-term load time history data for all wind conditions, with each simulation lasting 10 minutes. To mitigate the impact of wind uncertainty on the fatigue damage calculation results, six different random number seeds were assigned to each wind speed condition [14].
2.2 Stress Calculation of Tower Bolts
To obtain the fatigue damage of bolts, it is essential to convert the load time series into stress time series. Among the commonly used fatigue analysis methods for connecting bolts in WT tower flanges, the Schmidt-Neuper algorithm provides results that are closer to actual test data compared to the Petersen and VDI 2230 algorithms. Moreover, finite element simulation, while offering high fidelity, often suffers from significant computational demands, lengthy processing times, and low evaluation efficiency. In contrast, the Schmidt-Neuper algorithm, though it sacrifices some fidelity in modeling contact nonlinearity, provides conservative predictions that align well with industrial safety margins [15]. This algorithm strikes a balance between accuracy and efficiency. As a result, it is widely recognized by wind turbine certification bodies, as well as design and manufacturing enterprises. The Schmidt-Neuper algorithm can be employed to convert the central load of the tower section into the internal stress experienced by the bolt.
According to the Schmidt-Neuper algorithm, in the calculation of bolt fatigue damage, the thin wall of the tower is primarily considered to experience normal stress due to the vertical load and the torques and , while the effect of tangential load on fatigue damage is neglected. For any given sector, the external load can be evaluated as follows:
| (1) |
where is the radius corresponding to the action position of external load ; is the number of bolts in the flange section; is the external load position, which is the positive angle between the line of a certain position of the column section and the center of the circle and the X-axis, where the X-axis direction is consistent with the main wind direction, and the Y-axis is perpendicular to the X-axis direction.
The internal stress of the bolts was calculated according to the external load and the size and material characteristics of the bolt, gasket and flange, where the stiffness of each part can be calculated as follows:
| (2) | |
| (3) | |
| (4) |
where is the bolt stiffness, is the elastic modulus of the steel, is the area corresponding to the nominal diameter of the bolt, is the bolt length; is the flange stiffness, is the thickness of the flange; and are the outer and inner diameter of the gasket; is the gasket stiffness, and is the thickness of the gasket.
Figure 1 Flange structure diagram.
The structure of bolts, gaskets and flanges is shown in Figure 1. The resultant equivalent stiffness of the flange system composed of gaskets and flanges in series was calculated as follows:
| (5) |
The synthetic stiffness of the system composed of flange system and bolt in parallel was expressed as follows:
| (6) |
The constant named level ratio was defined by following manner:
| (7) |
where and are the distance from the center of the bolt to the inner diameter and outer diameter of the flange respectively.
When the bolt preload was set as , the sectional point load was calculated according to Schmidt-Neuper algorithm as follows:
| (8) |
The nonlinear relationship between the internal stress of the bolt and the external load can be expressed by a piecewise expression as:
| (9) |
where and are the proportion of the stiffness of the subsystem respectively.
The bolt section stress was as follows:
| (10) |
where is the bolt stress area.
2.3 Fatigue Damage Data Set
Based on the stress time history data of the connecting bolts in the tower flange, obtained using the rain-flow counting method, and applying Palmgren-Miner’s linear cumulative damage theory along with S-N curve analysis, the fatigue damage under various wind conditions can be calculated as follows:
| (11) |
where is the short term fatigue damage under the -th wind condition, is the number of individual fatigue damage, is the actual cycles of the -th stress range, and is the maximum allowable cycle number corresponding to the -th stress range, which can be obtained by using the S-N curve.
The S-N curve for the tower bolts consists of two segments. According to the GL2010 specification, the exponential slopes of these segments are 3 and 5, respectively, with the maximum allowable number of cycles at the intersection point of the segments being . The stress range corresponding to the inflection point on the S-N curve can be determined by the fatigue grade :
| (12) |
where is the line segment exponential slope, where 3 is taken, is the fatigue level, and is the corresponding stress amplitude when the maximum allowable cycle number is .
The expression of the S-N curve is determined according to the stress range at the intersection of line segments and the maximum number of allowable cycles:
| (13) |
According to the GL 2010 specification, a conservative value of was taken as 36, meaning the stress level corresponding to cycles is 36 MPa. The resulting S-N curve is shown in Figure 2.
Figure 2 S-N curve of the high-strength bolts.
3 Definition and Calculation of EFS
Based on the above calculations, the fatigue damage of the high-strength bolts over the specified time period can be obtained. This index is widely used in the fields of machinery and engineering. However, the significant variation in fatigue damage values under different wind conditions leads to a substantial decrease in the accuracy of machine learning methods, particularly in low intensity fatigue damage states. To address this challenge, we converted the fatigue damage into EFS using the damage equivalence principle.
3.1 EFS Definition and Calculation
Equivalent fatigue stress (EFS) is defined as a stress signal of constant intensity and frequency, which causes the same fatigue damage as the asymmetric cyclic stress caused by wind load.
At a specific frequency , the fatigue damage caused by asymmetric cyclic stress is:
| (14) |
where is the fatigue damage caused by EFS, is the equivalent cycle number, which can be obtained by multiplying the frequency of EFS and the loading time , is the value of EFS, is the maximum allowable cycle number corresponding to the EFS , and are the stress range and allowable cycle number of a point on the S-N curve.
Assuming that the fatigue damage sustained by the high-strength bolt during the loading period is , the EFS can be written as follows:
| (15) | |
| (16) |
where is the EFS of the -th simulation, is the maximum allowable cycle number corresponding to , and is the fatigue damage caused by the -th simulation to the bolt.
This conversion strategy compressed the high magnitude of the original damage values () into a lower range stress domain (), increasing the model’s weight in the low-value region and thereby enhancing prediction accuracy. And the physical meaning is clear and comprehensible. This clarity is particularly beneficial when using the data as training input for machine learning algorithms.
3.2 Transformation of Fatigue Damage
In the second chapter, we calculated the fatigue damage experienced over a 10-minute period under various wind conditions, which is subsequently converted into EFS to facilitate further analysis. Similarly, the EFS can also be translated back into fatigue damage as follows:
| (17) |
The fatigue damage of bolts can be evaluated based on the EFS. Fatigue damage under varying wind conditions accumulated linearly over time to determine the total life-cycle fatigue damage. When the cumulative fatigue damage approached or exceeded a predetermined threshold, it indicated that the wind turbine components were at risk of fatigue failure. In such cases, bolts with higher fatigue strength should be selected to ensure that they can withstand the expected loading over the turbine’s operational lifespan without experiencing fatigue failure.
4 Fatigue Damage Evaluation Method Based on Machine Learning
4.1 Introduction to Machine Learning Algorithms
As an important branch of artificial intelligence, machine learning is an algorithm that can automatically capture the hidden relationship between data, build a learning model and apply it to unknown data. In the wind power industry, machine learning is widely used in the fields of wind power prediction, electricity price prediction and fault diagnosis. Several machine learning algorithms for evaluating fatigue damage are delineated in the subsequent sections.
4.1.1 Support vector regression (SVR)
SVR algorithm maps input features to a high-dimensional space using kernel functions and constructs a hyperplane to minimize prediction errors within a tolerance margin. The optimization problem is formulated as:
| (18) |
where is the weight vector, balances model complexity and training error, and , are the slack variables, represents the sample point. SVR excels in handling nonlinear relationships but requires careful kernel selection.
4.1.2 Backpropagation neural network (BPNN)
BPNN is a multilayer feedforward network trained via gradient descent. The weights are updated iteratively to minimize the loss function :
| (19) |
where is the adjustment coefficient and is the smoothing coefficient.
4.1.3 Extreme learning machine (ELM)
ELM employs a single-hidden-layer structure with random initialization of input weights and biases . The output is computed by:
| (20) |
where is the output weight, is the hidden layer activation function, and is the -th input sample. ELM trains rapidly but may underperform with noisy or imbalanced data.
4.1.4 Random forest (RF)
RF builds an ensemble of decision trees via bootstrap sampling and random feature selection. Final predictions are aggregated through majority voting (classification) or averaging (regression). RF enhances generalization through diversity but struggles with extrapolation beyond training ranges.
4.1.5 XGBoost
XGBoost integrates gradient-boosted trees with regularization to mitigate overfitting. The objective function includes a loss function and regularization term :
| (21) |
where is the loss function, used to measure the difference between the actual value and the predicted value , , are the hyperparameters that controls the complexity of the algorithm, and is the amount of leaf nodes in the decision tree, is the weight of the leaf node.
4.2 The Evaluation Process Based on Machine Learning Modeling
Different wind conditions generate varying loads on the tower section, resulting in different levels of fatigue damage to the connecting bolts of the tower flange. As a result, the bolts accumulate fatigue damage at different rates. To address this issue, this paper proposed a method based on Machine Learning algorithm and Equivalent Fatigue Stress (ML-EFS). Using machine learning algorithms, a nonlinear mapping is established between wind condition parameters and EFS, enabling the evaluation of fatigue damage under varying wind conditions. The evaluation procedure is described here as shown in Figure 3. The specific steps are as follows:
(1) Simulations under varying wind conditions: load time series data for all wind conditions were obtained through GH Bladed simulation to ensure that a wide range of wind conditions were covered.
Figure 3 Schematic flow diagram of the evaluation process based on machine learning modeling.
(2) Data processing: the load time series at the tower center were converted into the internal stress experienced by the bolts using the Schmidt-Neuper algorithm. Then the internal stress time series of the bolts were converted into fatigue damage following the process outlined in Section 2.3.
(3) EFS transformation: the fatigue damage was transformed into EFS. Then the data was normalized to improve the fitting efficiency of the model and ensure that the weights of each parameter are equal.
(4) Data set partitioning: the data set is divided into training set and test set. The training set is used for model training, and the test set is used for model evaluation. The ratio of training set to test set is 7:3.
(5) Model training: according to the algorithms described in Section 4.1, the model is trained using the training dataset and the predicted model parameters were determined iteratively. The model’s performance is then evaluated using the test set.
(6) Test: a separate set of wind parameters, distinct from the original parameter combinations, was constructed to simulate cumulative fatigue damage. This simulated data was then compared with the model’s output results to verify the robustness and generalization capability of the method.
5 Analysis of Evaluation and Results
5.1 Fatigue Data of WT Tower Flange Connection Bolts
5.1.1 Load simulation
This paper focuses on a 5 MW wind turbine as the research subject. The bottom of the tower was connected to the foundation via an L-shaped flange, and the load data at the bottom center of the tower under normal power generation conditions were simulated using GH Bladed software. The air density was set to 1.225 in accordance with IEC 61400-1. Table 1 presents the wind parameters and their respective parameter ranges.
Table 1 List of wind regime parameters
| Wind Parameters | Data Range | Parameter Number |
| Mean wind speed(m/s) | 4,6,8,10,12,14,16, | 11 |
| 18,20,22,24 | ||
| Reference Turbulence intensity | 0.06,0.07,…,0.17,0.18 | 13 |
| Wind shear | 0.1,0.2,0.3,0.4 | 5 |
| Inflow Angle( ) | 0,4,8,12 | 4 |
Table 1 lists 2288 wind condition combinations. To ensure the stability of the fatigue damage calculation, six different turbulent wind seeds are applied to each wind condition, in accordance with IEC standards. A total of 13,728 wind conditions, corresponding to 10-minute load data, are simulated, with a sampling frequency of 10 Hz. Figure 4 presents a typical 10-minute fatigue load time series. In this series, , , and . Due to random fluctuations in wind speed, these three loads continuously oscillate within their respective allowable ranges. All data were calculated using the commercial WT load simulation software Bladed.
Figure 4 Load sequences.
5.1.2 Calculation of bolt stress
The L-shaped flange at the tower base has inner/outer diameters of 5.5 m and 6.0 m, with the thickness of the upper and lower flanges being 100 mm. The bolts used are M52 coarse-thread bolts of grade 10.9, with a total of 88 bolts evenly distributed along the flange. The tensile strength of the bolts is 1040 MPa, and the yield strength is 930 MPa. The specific parameters of the bolts and gaskets are provided in Table 2. The bolt preload is applied at 70% of the yield strength, corresponding to 1144.5 kN.
Table 2 Parameters of bolts and gasket
| Parameter | Value |
| Middle diameter of bolt/mm | 52 |
| Stress area/mm | 1758 |
| Inside diameter of gasket/mm | 54 |
| Outside diameter of gasket /mm | 100 |
| Gasket thickness/mm | 10 |
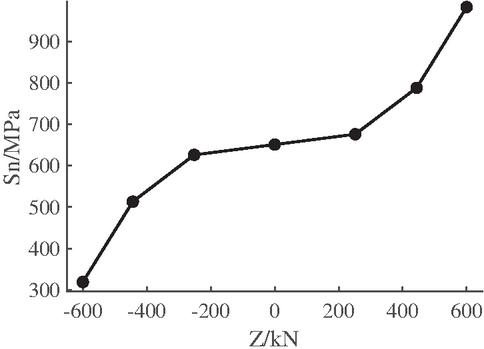
Figure 5 Relationship between external load and internal stress of bolts.
Using the stress calculation method for the tower bolts described in Section 2.2, the relationship between the external load and the internal stress of the bolts was determined, as shown in Figure 5. The time series of on the tower and on the internal stress of the bolt (with as an example) are shown in Figure 6. As illustrated in Figure 5, the two are positively correlated, meaning their time series trends follow the same pattern.
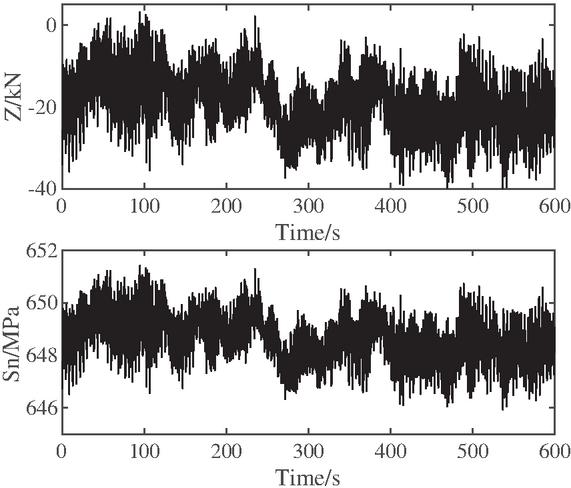
Figure 6 Sequences of external load and bolt stress.
After obtaining the internal stress time series of the bolts, the fatigue damage can be calculated following the method outlined in Section 2.3. For simulation conditions with different wind seeds, while keeping other factors constant, the average value calculated across the different wind seeds is taken as the final result. This approach ensures the stability and representativeness of the fatigue damage evaluation.
5.1.3 Fatigue damage rules of bolts at different positions
There are 88 high-strength bolts uniformly distributed around the flange connection of the wind turbine tower cylinder. To calculate the fatigue damage at different positions, the entire circumference of the flange is evaluated at intervals of . The fatigue damage across the entire ring of bolts is symmetrically distributed around 12.27 and 192.27, with the maximum damage occurring at 12.27. Figure 7 shows the corresponding 10-minute fatigue damage of the bolts at different positions under a specific working condition. For simplicity in the calculation, only the high-strength bolts located at 12.27 at the bottom of the tower barrel were analyzed.
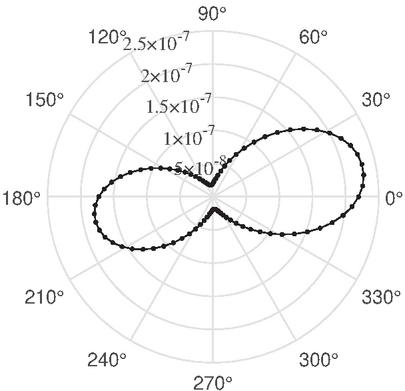
Figure 7 Distribution of fatigue damage.
5.1.4 Impact of wind conditions on fatigue damage
As shown in Figure 8, the influence of wind conditions on fatigue damage follows a distinct hierarchy. In Figure 8-a and 8-b, mean wind speed demonstrates the primary impact: increased wind speed directly elevates mechanical loads on the flange connection bolts by raising rotor rotational speed and power generation capacity. Turbulence intensity exhibites a secondary effect, as its variation intensifies stochastic vibrations and stress fluctuations in the wind turbine system, leading to a higher number of stress cycles within shorter durations and accelerating fatigue damage accumulation. For wind shear and inflow angle (Figure 8-c and 8-d), their effects are comparatively smaller. These parameters primarily influence fatigue damage indirectly by altering load distribution patterns and aerodynamic efficiency.
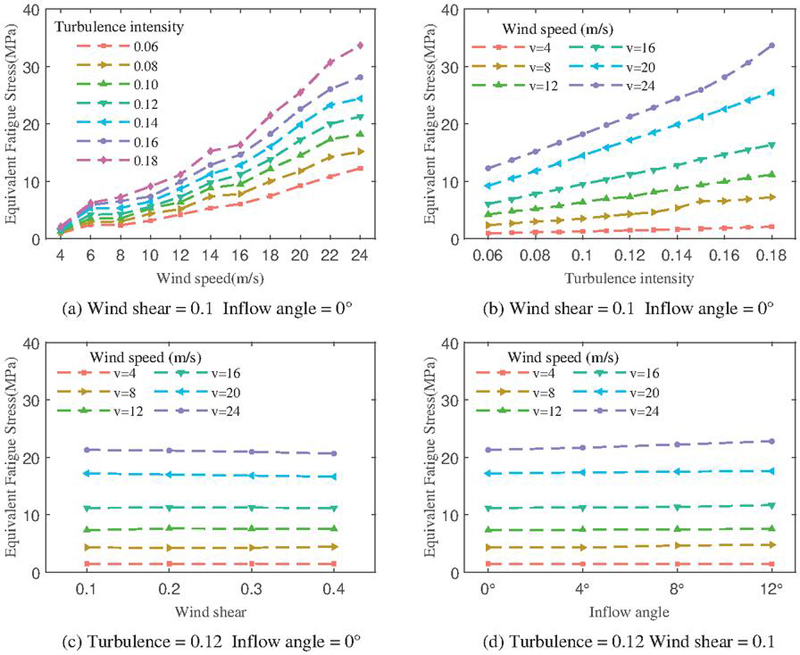
Figure 8 Influence of different wind parameters.
5.2 Model Training Results and Analysis
Following the evaluation process outlined in Chapter 4, the 2288 wind conditions obtained from the simulation in Section 5.1, along with their corresponding EFS, were divided into a training set and a test set with a 7:3 ratio. Initially, the training set was used to train the model, establishing a mapping between the wind parameters and the EFS of the connecting bolts at the flange at the base of the wind turbine tower. Subsequently, data from the test set were utilized to evaluate the performance of each algorithm. Figure 9 presents the simulation and prediction results for 50 samples randomly selected from the test set.
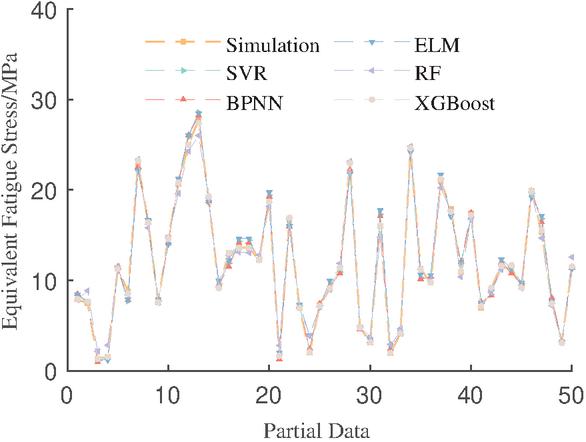
Figure 9 Predictive results of different models.
This paper compared the performance of different algorithms using several error evaluation metrics: Mean Absolute Error (MAE) and Root Mean Square Error (RMSE) to measure the difference between the predicted and actual values; Mean Absolute Percentage Error (MAPE) to assess the average magnitude of the absolute error; and the coefficient of determination (R) to evaluate the goodness of fit of the algorithm models. The smaller the values of MAE, RMSE, and MAPE, the higher the prediction accuracy of the model. The closer the R value is to 1, the better the model fit. Table 3 presents the prediction errors of different machine learning algorithms.
Table 3 Comparison of prediction effect of different models
| MAE | RMSE | MAPE | R | Training Time | |
| SVR | 0.715 | 0.994 | 10.265% | 98.504% | 0.190 |
| BPNN | 0.510 | 0.725 | 6.668% | 99.169% | 9.647 |
| ELM | 0.634 | 0.915 | 8.752% | 98.680% | 0.094 |
| RF | 0.573 | 0.796 | 10.717% | 98.999% | 1.731 |
| XGBoost | 0.102 | 0.197 | 2.100% | 99.739% | 8.069 |
As shown in Table 3 and Figure 9, the prediction errors of five algorithms are relatively small, indicating a high degree of model fitting. Specifically, the prediction performance of the BPNN and RF algorithms slightly outperforms that of the SVR and ELM algorithms, while the XGBoost algorithm significantly surpasses the others in both prediction accuracy and model fitting. In terms of training time, the SVR and ELM algorithms exhibit higher training efficiency, while the XGBoost and BPNN algorithms require longer computation times. However, the BPNN algorithm shows considerable performance fluctuations across different training sessions. When evaluating the fatigue damage of WT bolts using this method, the 10-minute fatigue damage values must be linearly accumulated. As a result, the evaluation model demands both high accuracy and stability. Overall, the training efficiency of this method has been significantly improved compared to traditional simulation calculations.
5.3 Evaluation and Analysis of Cumulative Fatigue Damage
The cumulative fatigue damage of WT components can be combined by multiple 10 min fatigue damage. Considering the establishment of multiple wind condition combinations, the cumulative fatigue damage under multiple working conditions is calculated by linear superposition, and the adaptability and robustness of the fatigue damage evaluation model of wind turbine components proposed in this study are verified.
5.3.1 Wind conditions distribution
The variation in average wind speed is random, but its distribution typically follows a Weibull distribution. The probability density function of the wind speed distribution is given as follows:
| (22) |
where is the scale coefficient, reflecting the overall level of average wind speed, and is the shape coefficient, representing the degree of concentration or dispersion in the wind speed distribution.
In the process of establishing multiple wind condition combinations, the wind speed data is designed to better align with natural law. The proportion of different wind speeds within the combinations is calculated based on the Weibull distribution, while other wind parameters are selected randomly. Three sets of 100 groups of 10-minute wind conditions were established, and their cumulative fatigue damage was calculated, as shown in Table 4.
Table 4 Different Weibull distribution parameters and cumulative fatigue damage
| Group | Scale Factor | Shape Factor | Cumulative Fatigue Damage |
| 1 | 11 | 2.5 | |
| 2 | 12 | 3 | |
| 3 | 13 | 3.5 |
5.3.2 Cumulative fatigue damage evaluation results and analysis
The evaluation model established in this paper can obtain EFS of WT bolts under normal power generation conditions for a 10-minute wind period, based on the wind condition parameters. The EFS is then used to calculate the 10-minute fatigue damage. The transformation relationships are described in Section 3.3. The wind condition parameters obtained in Section 5.3.1 were input into the evaluation model, and the corresponding EFS values were calculated and converted into 10-minute fatigue damage. The resulting fatigue damage evaluations were compared with the cumulative fatigue damage under simulated wind conditions, as shown in Figure 10.
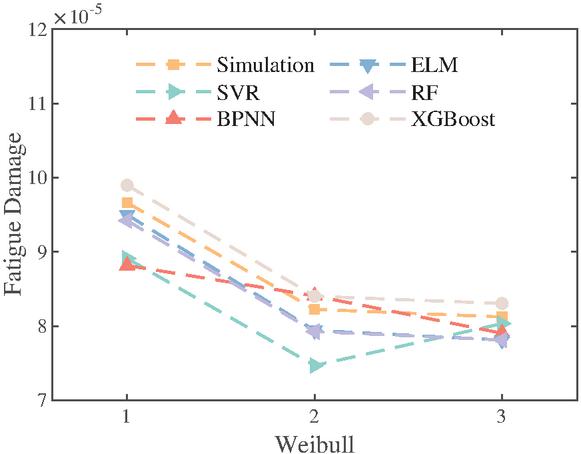
Figure 10 Predictive results of cumulative fatigue damage.
By comparing the prediction results of different models, it is evident that, compared to the prediction error of the 10-minute EFS, the MAPE for cumulative fatigue damage was smaller due to the smoothing effect. Among all models, the SVR exhibits a significant prediction error, with a consistently high MAPE value. XGBoost demonstrates the best predictive accuracy, with an average MAPE of 2.27%, outperforming other models we tested. The predicted fatigue damage is slightly higher than the simulation value, making the prediction results conservative. Other models, including RF, ELM, and BPNN, also delivered strong predictions, with an average MAPE around 3.25%. While XGBoost exhibits slightly higher computational overhead, its precision and stability justify its adoption for cumulative fatigue damage calculation. This analysis demonstrates that the XGBoost-EFS method is both effective and accurate for evaluating the fatigue damage of the connecting bolts at the WT tower flange.
5.4 Conclusion
This paper proposed an efficient and accurate method for evaluating the fatigue damage of high-strength connection bolts in the WT tower cylinder flange, specifically through an equivalent fatigue stress evaluation approach based on machine learning. To better evaluate the fatigue damage of the bolts, a wind condition parameters-fatigue damage dataset is first constructed to calculate the fatigue damage of the high-strength connection bolts under various wind conditions. Next, to enhance the accuracy of the prediction, the transformation between fatigue damage and EFS is performed based on the principle of fatigue damage equivalence. Finally, different machine learning algorithms were employed to establish the mapping relationship between wind parameters and EFS, and their prediction performance was compared and validated. Based on the above research, the following main conclusions can be drawn:
• The proposed machine learning-based EFS prediction method can accurately evaluate the fatigue damage according to the wind condition parameters
• The method significantly reduced the time required for fatigue damage assessment of high-strength bolts in the wind turbine tower flange, thereby improving evaluation efficiency.
• Compared to other models, the evaluation model constructed using the XGBoost algorithm delivered the best performance for the 10-minute EFS, excelled in evaluating cumulative fatigue damage, and yielded a little more conservative results.
References
[1] Kang J, Liu H, Fu D. Fatigue life and strength analysis of a main shaft-to-hub bolted connection in a wind turbine. Energies, 12(1): 7, 2018.
[2] Alonso-Martinez M, Adam J M, Alvarez-Rabanal F P, et al. Wind turbine tower collapse due to flange failure: FEM and DOE analyses. Engineering Failure Analysis. 104: 932–949, 2019.
[3] Yu Z, Sun P, Wang D. Fatigue life prediction for flange connecting bolts of wind turbine tower. Journal of Shanghai Jiaotong University (Science), 25: 526–530, 2020.
[4] Lochan S, Mehmanparast A, Wintle J. A review of fatigue performance of bolted connections in offshore wind turbines. Procedia Structural Integrity, 17: 276–283, 2019.
[5] Fu B, Zhao J, Li B, et al. Fatigue reliability analysis of wind turbine tower under random wind load. Structural Safety, 87: 101982, 2020.
[6] Anup K C, Whale J, Evans S P, et al. An investigation of the impact of wind speed and turbulence on small wind turbine operation and fatigue loads. Renewable Energy, 146: 87-98, 2020.
[7] Stensgaard Toft H, Svenningsen L, Moser W, et al. Wind climate parameters for wind turbine fatigue load assessment. Journal of Solar Energy Engineering, 138(3): 031010, 2016.
[8] Leian Z, Xuemei H, Guangming Y. Fatigue life evaluation for wind turbine blade based on multistage loading accumulative damage theory. The Open Mechanical Engineering Journal, 9(1), 2015.
[9] Mendez Reyes H, Kanev S, Doekemeijer B, et al. Validation of a lookup-table approach to modeling turbine fatigue loads in wind farms under active wake control. Wind Energy Science, 4(4): 549–561, 2019.
[10] Teixeira R, O’Connor A, Nogal M, et al. Analysis of the design of experiments of offshore wind turbine fatigue reliability design with Kriging surfaces. Procedia Structural Integrity, 5: 951-958, 2017.
[11] Murcia J P, Réthoré P E, Dimitrov N, et al. Uncertainty propagation through an aeroelastic wind turbine model using polynomial surrogates. Renewable Energy, 119: 910–922, 2018.
[12] Wilkie D, Galasso C. Gaussian process regression for fatigue reliability analysis of offshore wind turbines. Structural Safety, 88: 102020, 2021.
[13] Li X, Zhang W. Long-term fatigue damage assessment for a floating offshore wind turbine under realistic environmental conditions. Renewable Energy, 159: 570–584, 2020.
[14] Weijtjens W, Stang A, Devriendt C, et al. Bolted ring flanges in offshore-wind support structures-in-situ validation of load-transfer behaviour. Journal of Constructional Steel Research, 176: 106361, 2021.
[15] Liu M, Geng R, Wang J, et al. The Investigation of Various Flange Gaps on Wind Turbine Tower Bolt Fatigue Using Finite-Element Method. Applied Sciences, 14(9): 3670, 2024.
Biographies

Shixiong Gao is currently pursuing the M.Eng. degree in control science and engineering with the School of Control and Computer Engineering, North China Electric Power University. He is mainly engaged in research of wind turbine simulation and load calculation.

Juncheng Liu is a lecturer at the North China Electric Power University. He graduated from the Institute of Automation, Chinese Academy of Sciences in 2005 with a doctorate degree in engineering. In recent years, he is mainly engaged in the research of wind power control, embedded intelligent instrument, fiber optic sensor, and so on. In recent years, he has participated in more than 10 scientific research projects, such as Central University Fund, National Natural Science Foundation of China, 211 Construction Project, Key Project of Ministry of Education, and Enterprise Cooperation Project, and so on. He has authored or coauthored more than 30 technical papers and more than 10 patent applications.

Xing Wang is a postgraduate student at North China Electric Power University. He is mainly engaged in the research of power trading and price prediction.

Chentan Zhao is a postgraduate student at North China Electric Power University. He is mainly engaged in the research of power trading and price prediction.

Feijiang Wu is a postgraduate student at North China Electric Power University. He is mainly engaged in the research of load monitoring and fault diagnosis of wind turbines.
European Journal of Computational Mechanics, Vol. 33_6, 583–606.
doi: 10.13052/ejcm2642-2085.3363
© 2025 River Publishers