Numerical Simulation Optimization of Insoluble Sediment Discharge at the Bottom of Salt Cavern Gas Storage Facilities
Yueyang Guan1, Fansheng Ban1,*, Weinan Luo2 and Qi He1
1CNPC Engineering Technology R&D Company Limited, Beijing, 102206, China
2Chinese Petroleum Society, Beijing, 100724, China
E-mail: Fansheng06Ban@126.com
*Corresponding Author
Received 14 April 2025; Accepted 03 June 2025
The accumulation of insoluble sediments at the bottom of salt caverns significantly affects the effective storage capacity and long-term operational stability of salt cavern gas storage facilities. To investigate the sediment accumulation processes under varying operating conditions and their impact on cavern performance, computational fluid dynamics (CFD) methods were employed to conduct two-dimensional numerical simulations using Fluent software. The Euler–Euler multiphase model and the standard k- turbulence model were adopted to quantify how parameters, including the distance between the brine discharge outlet and the sediment surface, sediment density, sediment height, and injection pressure, influence sediment deposition behavior. Simulation results indicate that numerical modeling is an effective approach for analyzing sediment flow and deposition processes under different conditions. The distance between the brine discharge outlet and the sediment surface critically governs the potential for sediment ingestion into the tubing. A shorter distance increases the likelihood of sediment being drawn into the tubing, whereas a greater distance promotes sediment deposition at the cavern bottom and minimizes entrainment, thus achieving optimal accumulation control. By optimizing the positioning of the brine discharge outlet relative to the sediment surface, the efficiency of sediment discharge can be significantly improved, thereby ensuring the long-term operational reliability of salt cavern gas storage facilities. The implementation of optimized discharge strategies effectively reduces adverse effects of sediment accumulation, enhances gas storage capacity and operational efficiency, and ensures the long-term safety and stability of the facility. These improvements yield substantial economic and social benefits for natural gas storage and peak-shaving operations.
Keywords: Salt cavern gas storage, insoluble sediment, computational fluid dynamics (CFD), numerical simulation.
As an important form of underground natural gas storage, salt cavern gas storage offers several advantages, including large storage capacity, low operational cost, and environmental friendliness. It is widely applied in peak shaving, strategic reserves, and seasonal gas storage [11, 13, 34]. However, during long-term operation, the accumulation of insoluble sediments at the bottom of salt caverns has become an increasingly prominent issue [19, 21, 25]. Sediment buildup not only reduces the effective storage capacity but may also clog injection and withdrawal pipelines. These blockages impair normal operations and potentially introduce safety risks [20, 22, 24]. With the continuous growth in natural gas demand, the construction and operation of salt cavern gas storage facilities face increasingly stringent requirements [14, 16, 32]. Effectively managing and optimizing sediment accumulation at the bottom of salt caverns has thus become a critical problem in need of urgent resolution [12, 15, 30].
Traditional experimental methods, due to their high cost, lengthy duration, and limitations in capturing the dynamic characteristics of sediment deposition, are insufficient to meet practical engineering needs [1, 3, 28]. As a result, numerical simulation techniques based on computational fluid dynamics (CFD) have gradually emerged as an essential approach for investigating sediment deposition behavior [18, 23, 26]. In this study, the Euler–Euler multiphase model and the standard k- turbulence model [18, 23, 27] are employed to conduct two-dimensional numerical simulations using Fluent software, aiming to examine the influence of various operating conditions on sediment accumulation behavior. Through CFD-based simulations, the transport and deposition behavior of sediments under different working conditions is analyzed. This analysis identifies the dominant factors influencing sediment accumulation and reveals the underlying patterns of sediment accumulation [24, 27, 31]. Although two-dimensional simulations provide valuable insights, further exploration of three-dimensional simulations is recommended to comprehensively understand flow and deposition behaviors under complex geometries. Three-dimensional simulations can more accurately describe complex flow fields and deposition processes, especially in salt caverns with irregular shapes or complex internal structures. This will contribute to better understanding and optimization of actual engineering strategies for deposit management. By establishing accurate mathematical models, the numerical simulation method enables the modeling of sediment flow and deposition processes under various scenarios. It also facilitates the analysis of how different parameters affect sediment behavior [28, 29, 32]. Based on the simulation results, this study investigates how optimizing parameters such as the distance between the brine discharge outlet and the sediment surface [30], sediment density [21], sediment height [19], and injection pressure [26], can enhance sediment discharge efficiency and mitigate the impact of sediment buildup on the effective storage capacity. These findings have significant engineering value for improving the storage capacity and operational efficiency of salt cavern gas storage facilities [17, 33, 34].
Overall, this study utilizes CFD-based numerical simulation to conduct an in-depth analysis of the mechanisms and influencing factors of sediment accumulation. The results provide a theoretical foundation and technical support for the design, operation, and management of salt cavern gas storage facilities [4, 9, 10]. The findings have significant implications for operational optimization and technological innovation in salt cavern gas storage and offer broad prospects for application [6, 8, 16]. It is anticipated that the results of this research will lay the groundwork for future experimental studies and engineering applications [5, 7], thereby advancing the development and deployment of salt cavern gas storage technologies [25, 31, 34].
The accumulation of insoluble sediments at the bottom of salt caverns significantly affects the effective storage capacity and long-term operation of salt cavern gas storage facilities. To gain a deeper understanding of the sediment deposition process under varying operating conditions and its impact on storage performance, numerical simulations were conducted using CFD methods. Specifically, the Euler–Euler multiphase model and the standard k- turbulence model were employed. Two-dimensional simulations of sediment deposition behavior under different parameter conditions were carried out using Fluent software.
In this study, the Euler–Euler multiphase model is adopted for numerical simulation. This model treats both the continuous and dispersed phases as interpenetrating continua, making it suitable for describing the interactions and momentum exchange between multiple fluid phases. The CFD approach is employed to solve the flow field and investigate the accumulation process of insoluble sediments at the bottom of the salt cavern.
In the Euler–Euler model, the motion of both the continuous and dispersed phases is governed by their respective sets of conservation equations, including the continuity and momentum conservation equations. The continuity and momentum equations for the continuous phase are expressed as follows:
| (1) | |
| (2) |
where is the fluid density, kg/m; is the fluid velocity vector, m/s; is the fluid pressure, Pa; is the dynamic viscosity, Pa⋅s.
Equations (1) and (2) constitute the Navier–Stokes equations, which satisfy the principles of mass and momentum conservation in fluid flow.
The turbulent characteristics of the flow field are described using the standard k- turbulence model. This model consists of two transport equations: one for the turbulent kinetic energy and another for the turbulent dissipation rate.
where denotes the generation of turbulent kinetic energy due to the mean velocity gradients, represents the generation of turbulent kinetic energy induced by buoyancy, accounts for the contribution of fluctuating dilatation in compressible turbulence to the overall dissipation rate, is a source term, which can be defined by the user.
The standard k- model is one of the simplest and most complete two-equation turbulence models, offering broad applicability and reasonable accuracy across a wide range of turbulent flows. However, it also has several limitations: it assumes that Reynolds stresses are linearly proportional to the mean strain rate, which fails to capture the relaxation effects of Reynolds stresses along the flow direction. In addition, Reynolds stresses are inherently anisotropic, especially in near-wall turbulence, whereas the standard k- model is based on isotropic assumptions and thus cannot reflect such anisotropy. Furthermore, the model neglects the effects of mean swirling motion. Moreover, the standard k- turbulence model used in this study has certain limitations in handling near-wall turbulence and anisotropic problems. To further improve the prediction accuracy of particle motion behavior, advanced turbulence models such as the RNG k- or SST k- models should be considered in future research. These models can more accurately describe the flow field and particle motion trajectories under complex geometries, providing stronger support for actual engineering strategies for deposit management.
In this study, a two-dimensional numerical simulation was conducted using the Euler–Euler multiphase model and the standard k- turbulence model to investigate the accumulation process of insoluble sediments at the bottom of a salt cavern. Compared with traditional experimental approaches, this numerical simulation method not only reduces research costs and time requirements but also enables a more comprehensive and accurate representation of flow field distributions under various operating conditions. By analyzing the sediment transport and deposition patterns, it is evident that different parameters significantly influence sediment accumulation behavior. This provides theoretical support and technical guidance for the design and operation of salt cavern gas storage facilities. The method demonstrates clear advantages in optimizing discharge strategies and improving operational efficiency, highlighting the innovation and practical value of this research.
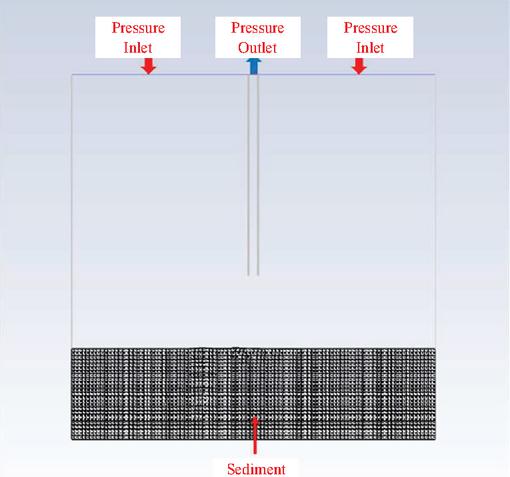
Following cavern leaching, the resulting salt cavern typically has a large diameter, often several tens of meters, while the gas injection and brine discharge tubing generally measures only several tens of centimeters in diameter. Consequently, during the injection and discharge process, the flow field is primarily affected in the vicinity of the brine outlet. To simplify the computation and improve simulation efficiency, the simulation focuses on the flow field near the brine discharge outlet by constructing a two-dimensional square planar model. The model has a length and width of 10 meters. The brine outlet has an outer diameter of 273.1 mm, a wall thickness of 12.57 mm, and an inner diameter of 247.96 mm. Using Fluent, the flow and deposition behavior of sediment during gas injection and brine discharge was simulated under various working conditions. Figure 1 shows the base case model.
Figure 1 Base case model.
Numerical simulation was used to investigate the flow and deposition behavior of insoluble sediments during gas injection and brine discharge under varying conditions, including different distances between the brine outlet and the sediment surface, sediment densities, sediment heights, and injection pressures. The simulations were also used to assess whether sediment particles would be entrained into the brine discharge tubing.
In the base case, the model domain has a height and width of 10 meters. The sediment has a density of 2650 kg/m and a viscosity of 10 kg/(m⋅s). The inlet pressure is set at 10 MPa, and the outlet pressure at 1 MPa. The sediment layer is 2 meters high, and the distance between the brine outlet and the sediment surface is 2 meters. Figure 2 illustrates the flow and deposition behavior of sediment during the gas injection and brine discharge process. As shown in Figure 2, the sediment primarily accumulates at the bottom of the cavern and is not significantly drawn into the tubing. The change in accumulation height is minimal, indicating overall stability. A distinct vortex structure forms within the internal flow field; however, due to the proximity of the outlet, the flow velocity within the sediment layer is nearly zero, and sediment particles mainly settle downward.
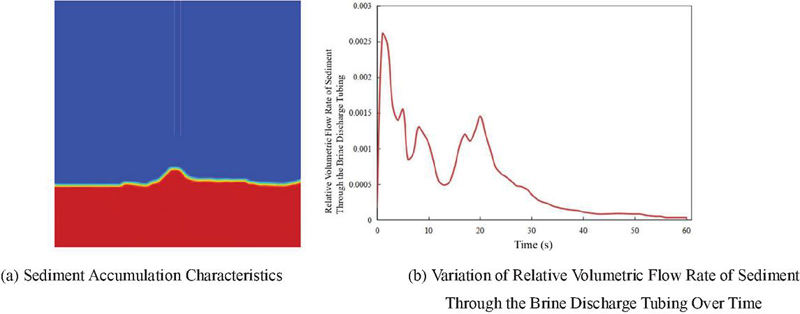
Figure 2 Flow and deposition behavior of sediment during gas injection and brine discharge.
To investigate the effect of the distance between the brine discharge outlet and the sediment surface (h), simulations were conducted under the assumption of a sediment height of 0.5 m. The parameter h was set to 0.2 m, 0.5 m, 0.8 m, 1.0 m, and 1.5 m. The flow field near the brine outlet, internal flow dynamics within the sediment, sediment discharge from the cavern, and overall sediment accumulation behavior were monitored.
As shown in Figure 3, two-dimensional numerical simulations show that vortex structures are consistently formed within the sediment layer under different h values. In general, the flow velocity within the sediment is nearly zero, and most sediment particles tend to settle toward the bottom of the cavern. In Figure 4, contour plots indicate that the majority of the sediment remains inside the cavern. In Figure 5, from the line charts, the area enclosed between the relative flow rate curve and the horizontal axis suggests that, when the brine outlet is closer to the sediment surface, sediment is more likely to be discharged from the cavern.
Note: Relative volumetric flow rate refers to the ratio of the sediment flow area to the cross-sectional area of the brine discharge tubing.
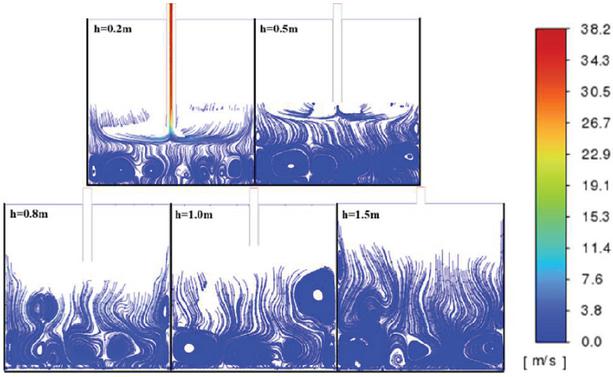
Figure 3 Variation of internal flow field within sediment under different outlet-to-sediment surface distances.
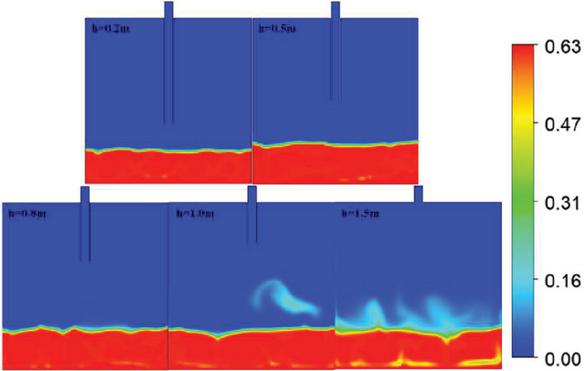
Figure 4 Sediment accumulation patterns at different outlet-to-sediment surface distances.
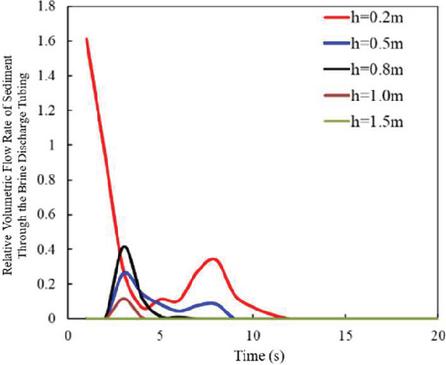
Figure 5 Variation of relative volumetric flow rate of sediment through the brine discharge tubing over time at different outlet-to-sediment surface distances.
To investigate the influence of sediment density, simulations were performed under the condition of a fixed sediment height of 0.5 m. Sediment densities were set to 2050, 2250, 2450, 2650, and 2850 kg/m. The simulations monitored the flow field distribution near the brine discharge outlet, internal fluid motion within the sediment, whether sediment was discharged from the cavern, and the overall sediment accumulation behavior.
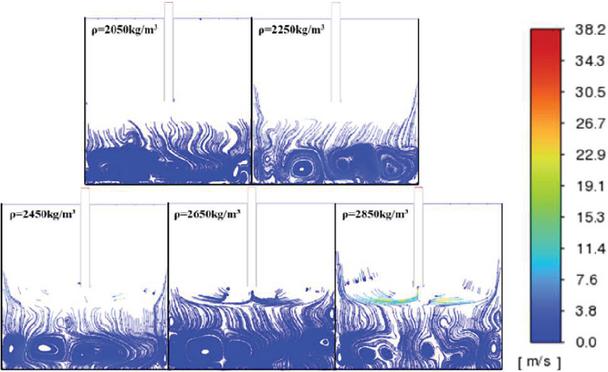
Figure 6 Variation of internal flow field within the sediment at different densities.

Figure 7 Sediment accumulation patterns at different densities.
As shown in Figure 6, the internal flow field analysis indicates that vortex structures form within the sediment layer across all tested densities. Overall, the internal flow velocity of the sediment remains nearly zero, and most sediment particles tend to move toward the bottom of the cavern. In Figure 7, contour plots further demonstrate that the majority of sediment remains within the cavern. As sediment density increases, the surface of the accumulated sediment becomes smoother, and sediment becomes less likely to be entrained and removed by the brine flow. In Figure 8, from the line charts, the area under the curve representing the relative volumetric flow rate of sediment over time shows that higher sediment densities result in a lower likelihood of sediment being discharged from the cavern.
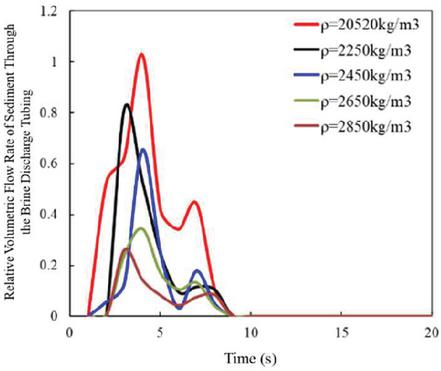
Figure 8 Variation of relative volumetric flow rate of sediment through the brine discharge tubing over time at different sediment densities.
To investigate the influence of sediment height (m), simulations were conducted under the conditions of a fixed distance of 0.5 m between the brine outlet and the sediment surface, and a sediment density of 2650 kg/m. Sediment heights were set to 0.2, 0.5, 0.8, 1.0, and 1.5 m. The simulations monitored the flow field distribution near the brine outlet, internal fluid flow within the sediment layer, whether sediment was discharged from the cavern, and the resulting sediment accumulation patterns.
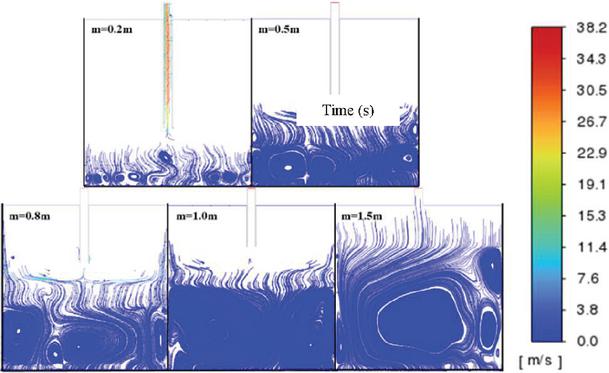
Figure 9 Variation of internal flow field within sediment at different sediment heights.
As shown in Figure 9, the simulation results show that vortex structures form within the sediment layer across all sediment heights. Although the size and number of vortices vary, they collectively hinder the upward movement of sediment particles. Overall, the internal flow velocity of the sediment remains nearly zero, with most sediment particles moving toward the cavern bottom. In Figure 10, from the contour plots, the majority of the sediment remains within the cavern. As sediment height increases, the surface of the accumulated sediment becomes smoother. In Figure 11, as illustrated in the line charts, based on the area under the relative volumetric flow rate curves, lower sediment heights correspond to higher likelihoods of sediment discharge from the cavern.
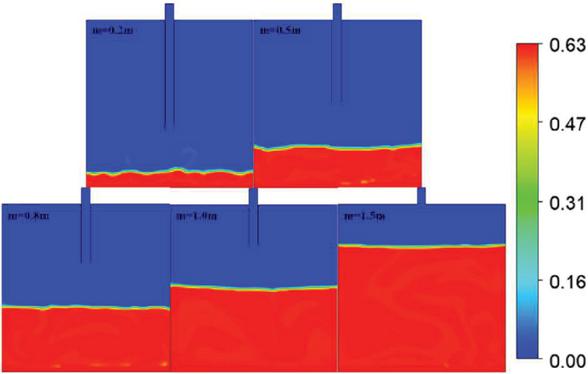
Figure 10 Sediment accumulation patterns at different sediment heights.
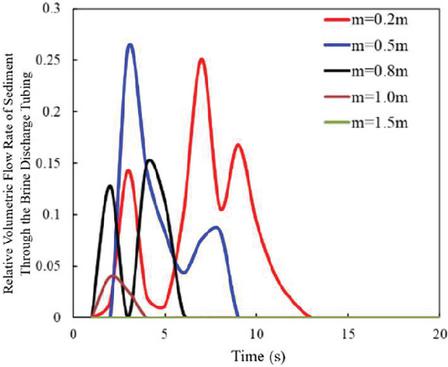
Figure 11 Variation of relative volumetric flow rate of sediment through the brine discharge tubing over time at different sediment heights.
To assess the impact of injection pressure, simulations were performed under the following conditions: 0.5 m distance between the brine outlet and the sediment surface, sediment density of 2650 kg/m, and sediment height of 0.5 m. Injection pressures were set to 0.01, 0.015, 0.02, 0.025, and 0.03 MPa. The flow field near the brine outlet, internal flow within the sediment, sediment discharge behavior, and accumulation patterns were monitored.
As shown in Figure 12, The internal flow field visualizations show that vortex structures are present across all injection pressures. Most sediment particles exhibit very low velocities and move predominantly toward the bottom of the cavern. In Figure 13, contour plots similarly reveal that most sediment remains within the cavern. In Figure 14, from the line charts, it is evident that as the injection pressure increases, the area under the relative flow rate curves decreases, indicating that higher injection pressures make it more difficult for sediment particles to be carried out of the cavern by the brine flow.
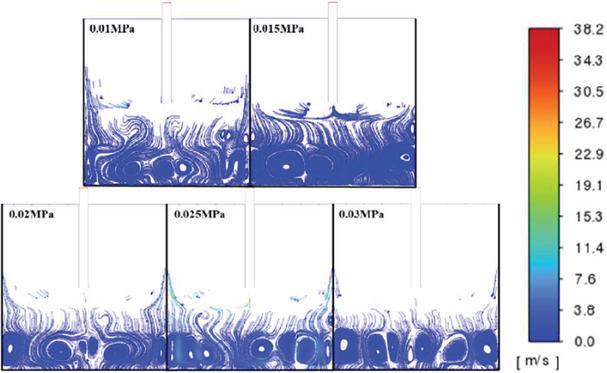
Figure 12 Variation of internal flow field within sediment under different injection pressures.
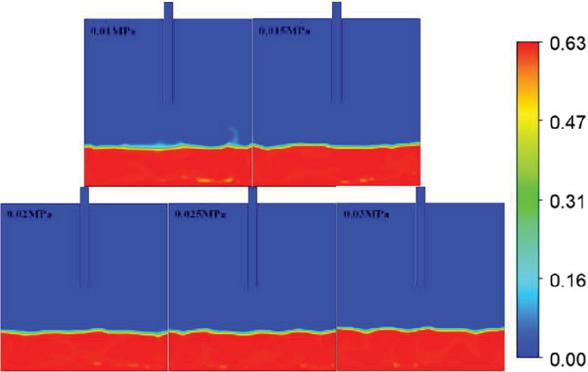
Figure 13 Sediment accumulation patterns under different injection pressures.
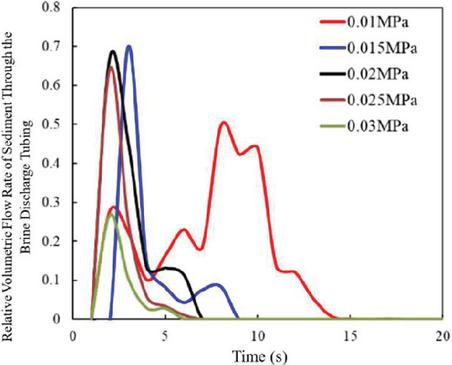
Figure 14 Variation of relative volumetric flow rate of sediment through the brine discharge tubing over time at different injection pressures.
As shown in Figure 15 and 16, In the simulation study, the sediment height was assumed to be 2.5 m, and the distance between the brine discharge outlet and the sediment surface (h) was set to 2 m, 4 m, 6 m, and 8 m. At each distance, pressure, flow rate, and sediment behavior were monitored to determine whether sediment would be entrained into the 273 mm brine discharge tubing. The following presents a detailed analysis of the numerical simulation results:
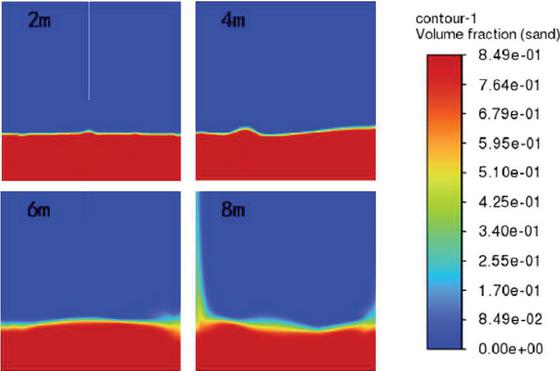
Figure 15 Sediment accumulation patterns at different outlet-to-sediment surface distances.
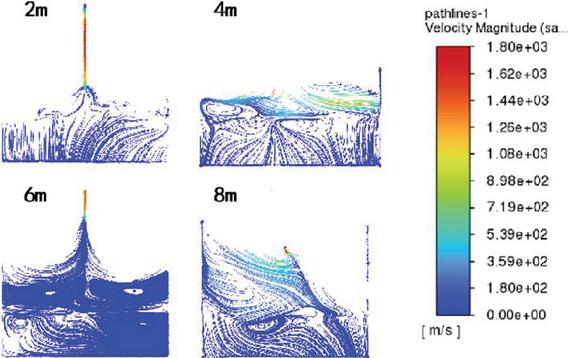
Figure 16 Variation of internal flow field within sediment at different outlet-to-sediment surface distances.
(1) At a distance of 2 meters ( m)
When the distance between the brine discharge outlet and the sediment surface is 2 meters, at an injection pressure of 10 MPa, the relative volumetric flow rate of sediment through the brine discharge tubing exhibits slight fluctuations during the initial stage but gradually stabilizes over time. As shown in the rate curve, the flow rate decreases progressively, indicating that most of the sediment settles at the bottom of the cavern, with only a small portion being entrained into the tubing. The flow field diagram reveals the formation of noticeable vortices near the wellhead, yet the majority of sediment particles remain concentrated at the bottom.
(2) At a distance of 4 meters ( m)
When the distance is increased to 4 meters and the injection pressure is reduced to 9 MPa, the sediment accumulation height increases slightly, but most sediment still remains within the cavern. Compared to the 2-meter case, the lower pressure further reduces the likelihood of sediment entrainment into the tubing. Vortices are smaller, and flow velocity is nearly zero, with vortex activity concentrated around the wellhead. The motion of sediment particles is predominantly downward, and sediment primarily accumulates at the bottom.
(3) At a distance of 6 meters ( m)
At a distance of 6 meters and an injection pressure of 6 MPa, the sediment accumulation height remains essentially unchanged, and the accumulation remains stable. With a greater outlet-to-sediment distance and moderate pressure, sediment is not significantly entrained into the tubing. The flow field diagram shows minimal vortex activity and near-zero flow velocity, with the influence of the flow field limited in scope. Sediment particles mainly settle downward. The relative volumetric flow rate of sediment through the tubing changes gently, showing minor initial fluctuations that quickly stabilize. The rate curve indicates that the relative flow rate remains low and steady, suggesting that most sediment settles at the bottom, with minimal sediment entering the tubing.
(4) At a distance of 8 meters ( m)
When the distance reaches 8 meters and the injection pressure remains at 6 MPa, the sediment accumulation height shows negligible variation, with good accumulation stability. The greater distance and moderate pressure result in optimal sediment accumulation, and sediment is not significantly entrained into the tubing. Vortex activity is minimal, and flow velocity is nearly zero. Due to the maximum outlet-to-sediment distance, the influence of the flow field on the sediment is minimal, and sediment particles predominantly settle downward. At 6 MPa, the relative volumetric flow rate of sediment exhibits the smoothest variation, with almost no fluctuation in the initial stage and rapid stabilization. The rate curve shows the lowest relative volumetric flow rate, indicating that sediment primarily settles at the bottom, with the least amount entering the tubing.
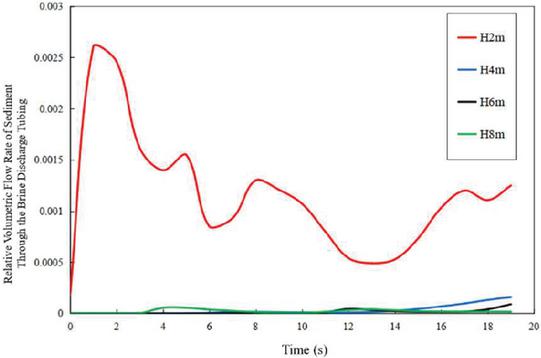
Figure 17 Variation of relative volumetric flow rate of sediment through the brine discharge tubing over time at different outlet-to-sediment surface distances.
As shown in Figure 17, the simulation results indicate that the distance between the brine discharge outlet and the sediment surface has a significant impact on sediment accumulation and discharge behavior. When the distance is shorter (e.g., 2 meters), the likelihood of sediment being entrained into the tubing increases. In contrast, when the distance is greater (e.g., 8 meters), sediment primarily accumulates at the bottom of the cavern, with minimal sediment entering the tubing, resulting in the most effective accumulation pattern. By appropriately setting the distance between the brine discharge outlet and the sediment surface, sediment discharge efficiency can be optimized, thereby ensuring the long-term operational stability of salt cavern gas storage facilities.
This study employed CFD methods to systematically simulate the accumulation behavior of insoluble sediments at the bottom of salt cavern gas storage facilities. The following major conclusions were drawn:
(1) The distance between the brine discharge outlet and the sediment surface has a significant influence on sediment accumulation and discharge. A shorter distance increases the likelihood of sediment being entrained into the tubing, whereas a greater distance leads to sediment predominantly depositing at the cavern bottom, minimizing sediment entry into the tubing and yielding optimal accumulation performance.
(2) The effect of sediment density on accumulation behavior indicates that higher-density sediments are less likely to be carried out of the cavern by the brine flow and tend to settle at the bottom.
(3) The analysis of different sediment heights shows that, as the sediment height increases, the surface of the sediment layer becomes smoother, vortex effects become more pronounced, and the motion of sediment particles is predominantly directed toward the cavern bottom.
(4) The influence of injection pressure on sediment accumulation demonstrates that, while higher injection pressures enhance sediment mobility, most sediment still remains within the cavern and is not significantly entrained into the brine discharge tubing.
Through the simulation of sediment flow and accumulation under various operating conditions, it was found that sediment behavior is significantly affected by the outlet-to-sediment surface distance, sediment density, sediment height, and injection pressure. These findings provide theoretical support for a deeper understanding of the sediment accumulation mechanism. By applying optimized discharge strategies, the negative impact of sediment accumulation on gas storage operations can be effectively reduced, thereby improving storage capacity and operational efficiency and ensuring the long-term safety and stability of the facility. This has considerable economic and social benefits for natural gas storage and peak-shaving applications.
Future research should focus on refining the parameter ranges for key variables such as deposit density and height. By narrowing the intervals and conducting sensitivity analyses, the specific influence of these parameters on deposit removal efficiency can be quantified. This approach will not only enhance the accuracy of predictions but also provide practical guidance for optimizing operational strategies in actual engineering applications. For example, identifying the threshold values of deposit density and height beyond which removal efficiency drops significantly can inform decisions regarding cleaning schedules and operational adjustments.
The findings of this study have broader implications beyond salt cavern gas reservoirs, demonstrating the versatility and adaptability of the developed methodologies. For instance, in underground oil reservoirs, the accumulation of solid particles or debris within storage cavities can hinder efficient extraction operations. The principles established in this study regarding particle transport and deposition under varying flow conditions can be directly applied to optimize cleaning and maintenance procedures in such environments. By tailoring the simulation parameters to match the specific characteristics of oil reservoirs (e.g., fluid viscosity, particle size distribution), engineers can design more effective strategies for minimizing sedimentation and maintaining operational efficiency.
In summary, this study not only offers effective technical solutions for practical engineering applications but also lays a foundation for future experimental research and implementation. The findings have significant engineering value and contribute to improving the economic and social performance of salt cavern storage systems. Moreover, the methods and conclusions presented in this study are also applicable to the design and optimization of other similar storage systems, thereby advancing development and technological progress in related fields.
Wellbore Management and Rapid Construction Method for Oil and Gas Reservoirs and Thin Salt Reservoirs (2023DJ8308); Research on Key Technologies of Energy Storage Reservoir and Hydrate Drilling Fluid (CPET202317); Research on the Complex Geological Multi-Wellbore Injection and Production Mode of Underground Salt Cavern Compressed Air Energy Storage(2024DQ03181).
[1] Gong D, Li J, Wan J, et al. Numerical simulation study on cavity stability of salt cavern gas storage under multi-field coupling. Petroleum Science Bulletin, 2023, 8(6): 787–796.
[2] Pan Y, Li E, You Y, et al. Numerical simulation study on blasting effect of insoluble interlayers in bedded salt caverns. Journal of Vibration and Shock, 2019, 38(14): 55–62+104. https://doi.org/10.13465/j.cnki.jvs.2019.14.008
[3] Gao M, Jia S, Gong J, et al. Numerical simulation of the ultimate operating pressure of underground gas storage in salt rock with interlayers. China Sciencepaper, 2016, 11(1): 29–34.
[4] Ren S, Jiang D, Yang C. Numerical simulation study on surface subsidence after failure of salt cavern gas storage. Rock and Soil Mechanics, 2009, 30(12): 3595–3601+3606. https://doi.org/10.16285/j.rsm.2009.12.004
[5] Fu Y, Guo X, Du Z, et al. Numerical simulation of underground gas storage considering fracture deformation. Journal of Southwest Petroleum University, 2007, (4): 92–94+194–195.
[6] Liang G, Wang M, Peng X, et al. Numerical simulation of morphological changes in salt caverns for underground gas storage. Natural Gas Industry, 2014, 34(7): 88–92.
[7] Gao M, Jia S, Gong J, et al. Numerical simulation of the ultimate operating pressure of underground gas storage in salt rock with interlayers. China Sciencepaper, 2016, 11(1): 29–34.
[8] Meng T, Liang W, Dai J. Numerical simulation study on the usability of horizontal salt caverns. Mining Research and Development, 2013, 33(4): 10–15. https://doi.org/10.13827/j.cnki.kyyk.2013.04.016
[9] Ren S, Jiang D, Yang C. Numerical simulation study on surface subsidence after failure of salt cavern gas storage. Rock and Soil Mechanics, 2009, 30(12): 3595–3601+3606. https://doi.org/10.16285/j.rsm.2009.12.004
[10] Li J, Wang S, Zhang Y, et al. Design method for improving stability of salt cavern gas storage caverns. Oil and Gas Storage and Transportation, 2017, 36(8): 964–968.
[11] Ding G, Li C, Wang J, et al. Current status and technical development direction of underground gas storage in China. Natural Gas Industry, 2015, 35(11): 107–112.
[12] He Q, Feng Y, Deng J, et al. Technology and prospects for space utilization in domestic salt cavern gas storage. Petroleum Drilling and Production Technology, 2022, 44(6): 711–718. https://doi.org/10.13639/j.odpt.2022.06.008
[13] Zeng D, Zhang G, Zhang J, et al. Achievements and development prospects of Sinopec’s underground gas storage. Natural Gas Industry, 2021, 41(9): 125–134.
[14] Ran L, Zheng D, Luo T, et al. Construction and operational characteristics of salt cavern underground gas storage. Oil and Gas Storage and Transportation, 2019, 38(7): 778–781+787.
[15] Zhang X, Chang X, Jiang L, et al. Stability evaluation system for salt cavern underground gas storage and its application. Natural Gas Industry, 2015, 35(11): 83–90.
[16] Yang H. Key technologies and challenges in the construction of salt cavern gas storage in China. Oil and Gas Storage and Transportation, 2017, 36(7): 747–753.
[17] Liu J, Jiang D, Chen J, et al. Similar simulation of cavity construction and long-term stability analysis of horizontal salt cavern gas storage. Journal of Chongqing University, 2017, 40(2): 45–51.
[18] Lu D, Qian R. Overview of the standard k– turbulence model: In celebration of Professor Liu Xiliang’s 80th birthday. In: Proceedings of the 8th National Conference on Modern Structural Engineering. Tongji University, 2008.
[19] Li M, Wang H, Liu P, et al. Numerical simulation study on sediment accumulation characteristics in salt cavern gas storage. Journal of China University of Mining and Technology, 2016, 45(3): 89–96.
[20] Wang L, Chen G, Li F, et al. Numerical simulation analysis of insoluble accumulation in salt cavern gas storage. Journal of Natural Resources, 2021, 36(4): 652–659.
[21] Zeng Q, Wei W, Zhang X. Numerical simulation of gas storage in salt caverns with consideration of insoluble impurities deposition. Journal of Natural Gas Science and Engineering, 2015, 23: 330–338.
[22] Pan J, Su Y, Li X. Investigation on gas flow behavior and insoluble residue accumulation in salt cavern gas storage. Journal of Petroleum Science and Engineering, 2018, 163: 655–664.
[23] Liu H, Zhu J, Zhang W. Numerical investigation of turbulence models for gas flow in salt caverns. Journal of Natural Gas Science and Engineering, 2014, 18: 217–228.
[24] Wang J, Yang Y, Wang S. Numerical simulation of impurity deposition and flow characteristics in underground salt caverns. Energy, 2019, 188: 116004.
[25] Song R, Song Y, Liu J, et al. Multiscale experimental and numerical study on hydrogen diffusivity in salt rocks and interlayers of salt cavern hydrogen storage. International Journal of Hydrogen Energy, 2024, 79: 319–334.
[26] Chen L, Wang X, Ma X. CFD simulation of insoluble particle deposition in gas storage salt caverns. Fuel, 2017, 197: 90–97.
[27] Tang L, Li Y, Wang J. CFD modeling of insoluble particle sedimentation in underground salt caverns during natural gas storage. Journal of Natural Gas Science and Engineering, 2018, 50: 106–115.
[28] Xu H, Zhang H, Zhou Y. Computational fluid dynamics analysis of particle-laden flow in salt caverns used for gas storage. Journal of Petroleum Science and Engineering, 2016, 139: 125–134.
[29] Chang OCY. Integrated 3-dimensional modeling of proppant transport through hydraulic fracture network in shale gas reservoir [MSc thesis]. The Pennsylvania State University, 2016.
[30] Chen X, Li Y, Ge X, et al. Simulating the transport of brine in the strata of bedded salt cavern storage with a fluid–solid coupling model. Engineering Geology, 2020, 271: 105595.
[31] Li H, Ma H, Zhao K, et al. Parameter design of the compressed air energy storage salt cavern in highly impure rock salt formations. Energy, 2024, 286: 129520.
[32] Liang X, Ma H, Cai R, et al. Feasibility analysis of natural gas storage in the voids of sediment within salt cavern: A case study in China. Energy, 2023, 285: 129340.
[33] Li P, Li Y, Shi X, et al. Stability analysis of U-shaped horizontal salt cavern for underground natural gas storage. Journal of Energy Storage, 2021, 38: 102541.
[34] Yang G, Shen R, Tian Z, et al. Review of underground gas storage in the bedded salt deposit in China. In: SPE Unconventional Resources Conference/Gas Technology Symposium. Society of Petroleum Engineers, 2006. https://doi.org/10.2118/100385-MS

Yueyang Guan received the master’s degree in Engineering from China University of Petroleum (Beijing) in 2021. He is currently working as a project manager in CNPC Engineering Technology R&D Company Limited. His research areas and directions include drilling & completion, underground gas storage, and new energy.

Fansheng Ban received the bachelor’s degree in Theoretical and Applied Mechanics from Liaoning Technical University in 2000, the doctor’s degree in Fluid Mechanics from University of Chinese Academy of Sciences in 2008. He is currently working as a Senior Engineer in Petroleum Engineering Technology Research Institute Co. Ltd. of China National Petroleum Corporation. His research areas and directions include natural gas underground storage, compressed air energy storage, and hydrogen storage engineering technologies.

Weinan Luo received the bachelor’s degree in Engineering from Taiyuan University of Technology in 2007. He is currently working as a Senior Engineer at the Chinese Petroleum Society. His research focuses on Energy Strategies Research.

Qi He obtained the doctoral degree from China University of Petroleum (Beijing) in 2024. He is currently an engineer at China Petroleum Engineering Technology Research Institute Co. Ltd. His main research directions are the evaluation and construction of gas storage well engineering, and the study of underground energy storage space utilization technology.
European Journal of Computational Mechanics, Vol. 34_1, 55–78.
doi: 10.13052/ejcm2642-2085.3413
© 2025 River Publishers