A CFD-DEM Coupled Simulation Study on Mechanical Properties and Seepage Mechanisms of Prefabricated Fractured Coal Under Triaxial Compression
Yuguang Li* and Guangming Zhao
School of Mining and Safety, Anhui University of Science and Technology, Huainan, Anhui 232001, China
E-mail: aust_yuguang1li@163.com; guangmingzhao@163.com
*Corresponding Author
Received 10 December 2025; Accepted 23 March 2026
Abstract
In response to the increasing severity of gas-related issues associated with the transition from shallow to deep coal mining, this study systematically investigates the fracture evolution and seepage behavior of artificially fractured coal specimens under triaxial stress conditions through experimental tests. On the other hand, two-dimensional (2D) numerical modeling and multi-physics field coupling simulations of gas flow in coal seams with distinct fracture morphologies were implemented via COMSOL Multiphysics, involving mesh generation with adaptive refinement for 2D fracture networks and parameterized analysis of seepage-mechanics coupling effects, aiming to quantitatively clarify the regulatory mechanisms of mechanical parameters of prefabricated fractured coal on gas seepage characteristics. The results indicate that a significant surge in acoustic emission (AE) activity is observed during the stress-strengthening stage, which manifests the accumulation of internal damage within the coal matrix. At the peak strength, AE characteristic parameters exhibit an abrupt mutation, consistent with the numerical simulation results of 2D crack propagation paths. The Forchheimer equation effectively characterizes the quantitative correlation between pressure gradient and seepage velocity, and the deviation from linear growth behavior confirms that the seepage process conforms to non-Darcy flow mechanisms, as verified by the numerical fitting of 2D seepage curves and sensitivity analysis of flow parameters. Furthermore, it is worth noting that as effective confining pressure increases, the permeability (K) of the internal fracture network shows a monotonic decreasing trend, while the non-Darcy flow coefficient keeps rising steadily. This trend is well captured by the 2D coupled numerical model considering the nonlinear deformation of fractures. As the crack propagation zone expands, both permeability (K) and related seepage parameters exhibit a synchronous decreasing trend, which is quantitatively described by the damage variable derived from 2D numerical simulation. Numerical simulation results further reveal that the anisotropy index of outlet flow velocity corresponding to 15∘ inclined fractures is conspicuous, and the degree of dominant channel aggregation in multi-fracture systems is notably greater than that in single-fracture systems, as visualized by the 2D flow field cloud maps generated from simulations. Once the fracture length surpasses 25 mm, the pressure gradient field presents evident anisotropic properties, which is consistent with the experimental observations and numerical prediction results of the 2D stress-seepage coupling model.
Keywords: Fractured coal body, numerical simulation, nonlinear seepage, Forchheimer equation, acoustic emission characteristics.
1 Introduction
The mitigation and regulation of combustible gas hazards remain central areas of sustained focus and in-depth research in the coal industry [1]. Understanding the gas seepage behavior in coal bodies with pre-existing fractures is critical for the effective control of gas dynamics [2]. Studies of coal and rock seepage characteristics reveal dynamic evolution mechanisms under multi-field coupling conditions [3]. The permeability of coal reservoirs demonstrates a strong positive correlation with gas extraction efficiency [4]. Enhancing permeability significantly improves gas desorption and migration efficiency [5].
When deviations from Darcy’s law occur, the Forchheimer equation should be employed to describe the pressure gradient–velocity relationship [6]. A validated, generalized Forchheimer model is essential for characterizing non-Darcy flow behavior, with particular attention to defining the critical thresholds and parameters marking the transition between linear and nonlinear flow regimes [7, 8]. The relevant results support coal seam drilling optimization and gas utilization [9], clarifying the regulating effect of injection and confining pressure on permeability in CO2-ECBM [10]. The lattice Boltzmann method ( LBM )which is a numerical simulation method based on microscopic particle dynamics further reveals the high-pressure seepage mechanism and the V-shaped distribution characteristics of x-axis average flow rate [11].
Coal seam permeability (K) and the non-Darcy coefficient () are influenced by multiple factors [12], including intrinsic structural characteristics such as porosity [13, 14], pore morphology [15], and coal quality composition [16], external environmental conditions [17], such as stress situation [18], different temperature ranges [19], initial bearing pressure [20], and fluid properties of coal reservoir [21]. Among these, stress variation plays a decisive role in modulating permeability [22]. Coal deformation and prefabricated defects are the core factors affecting coal seam gas leakage [23]. The coupling methods of Finite Element Method (FEM), Discrete Element Method (DEM), and Computational Fluid Dynamics-Discrete Element Method (CFD-DEM) are classic and mainstream methods in the field of coal rock multi-field coupling simulation. Among them, the CFD-DEM [24] coupling method can simultaneously characterize the solid deformation of coal and rock and the fluid flow in pores/cracks. The evolution of the coal seam fracture seepage field is closely related to gas migration and storage, and its temporal evolution can be quantified by the “fracture gradient dimension” [25], revealing the asymmetric evolution mechanism of high leakage areas [26]. The pore structure of coal is quantitatively characterized through the mercury injection method, N2 and CO2 adsorption experiments [27], clarifying that the fracture network dominates the overall permeability [28], and cavity pores can enhance the complexity of hydraulic fractures [29]. The friction coefficient can be derived by analyzing the seepage behavior of coal and rock samples with different fracture roughness levels [30]. Additionally, the coupling effects of coal’s internal structural features on permeability have been investigated [31]. The dynamic evolution of non-Darcy permeability and the inertial resistance coefficient across different strain stages [32] confirms that flow resistance governed by non-Darcy effects follows an exponential growth trend [33].
Overall, these findings establish a robust theoretical and practical framework for predicting coalbed methane permeability and assessing fracturing productivity, with numerical models calibrated against Reynolds number-based criteria further mitigating prediction discrepancies. Despite extensive theoretical and experimental explorations into the pressure gradient, strain responses, and gas seepage behaviors of fractured coal, considerable variability persists within underground fracture zones. Notably, existing studies predominantly focus on the analysis of individual fracture parameters, lacking systematic quantification of multi-parameter coupling effects-particularly across distinct fracture scales, where the corresponding strain and seepage mechanisms have not been explicitly elucidated via high-fidelity numerical modeling. This knowledge gap has emerged as a critical technical bottleneck constraining the safe exploitation of deep coal resources.
To address the aforementioned research gap, this study adopts a technical roadmap of “experimental testing and numerical simulation with bidirectional validation”. On the one hand, triaxial seepage loading tests are performed, leveraging acoustic emission (AE) technology to characterize the damage evolution mechanisms of coal samples with varying fracture zones. Stress-strain curves and elastic modulus parameters of specimens with distinct fracture areas are acquired and subjected to a comprehensive systematic analysis. On the other hand, a two-dimensional (2D) refined numerical model for gas seepage considering multi-fracture parameters is developed via COMSOL Multiphysics, incorporating adaptive mesh refinement techniques to optimize grid quality within fracture regions and enable high-precision computation of seepage fields. In this model, gas transport within the porous matrix adheres to Darcy’s law, while seepage through fracture regions is governed by the Forchheimer nonlinear equation. The influence mechanisms of fracture geometric parameters on seepage behaviors are quantified through computational mechanics analytical approaches, such as seepage field cloud map visualization and numerical fitting of seepage curves. Building on this foundation, in-depth investigations are conducted into the coupling effects of key fracture geometric parameters, including dip angle, length, quantity, and width, on gas seepage behaviors, with the explicit regulatory impacts of these parameters on the linear and nonlinear seepage characteristics of fractured coal clarified. Furthermore, we have elaborated on the applicable scope of the 2D model and uncovered the underlying mechanism governing the multi-field coupling evolution of stress, fracture and seepage from the perspective of fracture deformation and the dynamic variation of seepage channels. Overall, through the deep integration of experimental data and numerical simulations, this study establishes a robust reference framework for evaluating the factors governing nonlinear natural gas migration across different fracture scales, thereby contributing to enhanced safety and efficiency in natural gas extraction from fractured formations.
2 Materials and Methods
2.1 Instruments
The experiment was conducted using the ZST-1500 dynamic-static coupling test platform for coal and rock (Figure 1) [34]. which incorporates an EDC-series fully digital servo control system. This platform enables independent closed-loop regulation of axial load and confining pressure via a multi-channel measurement system. The triaxial self-balancing pressure chamber features an innovative design that eliminates additional confining pressure.
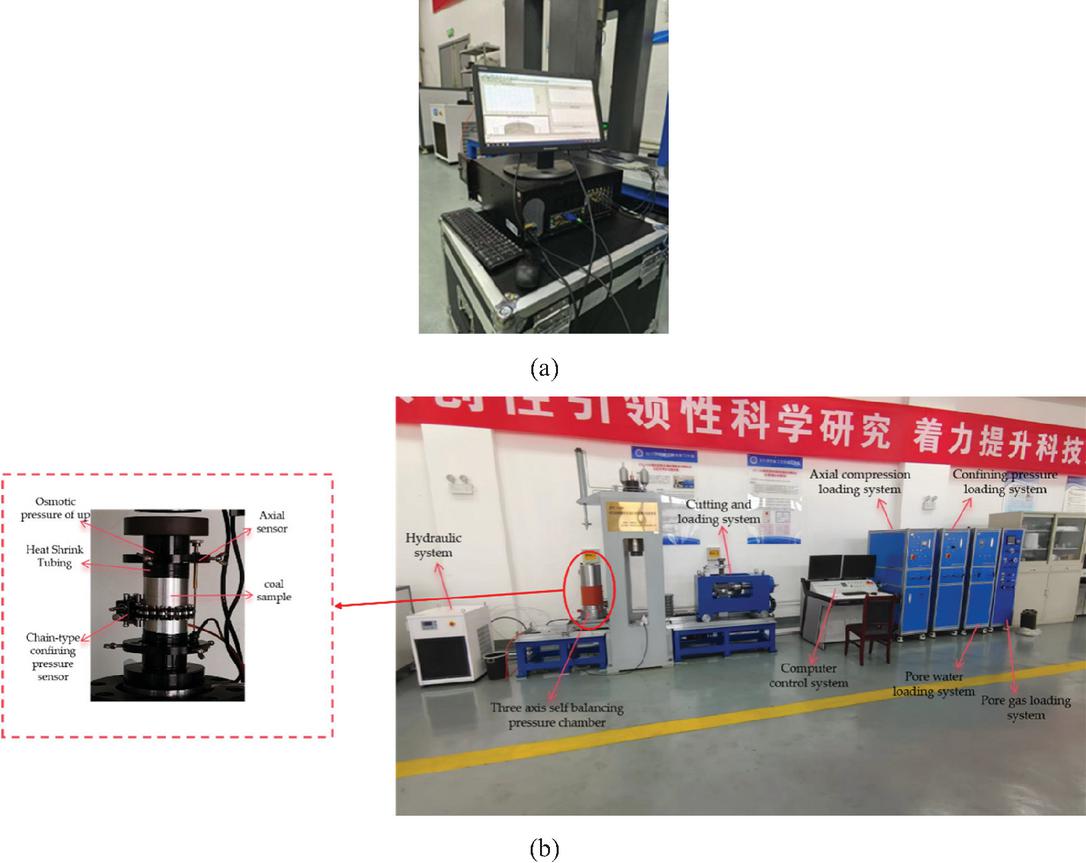
Figure 1 Composition diagram of three-axis test system: (a) DS5-8A acoustic emission monitoring instrument and (b) structural schematic of the triaxial seepage test system.
Quasi-static axial loading is applied to the specimen through a rigid compression rod, while a hydraulic servo system synchronously imposes isotropic confining pressure, generating a composite stress environment. The system integrates a pore gas testing module and a hydraulic power unit. Electrohydraulic servo valve and cylinder coordination enables multi-field coupling. To isolate the sample from oil and gas, heat-shrink tubing is applied. The gas flows from the top inlet to the bottom outlet, and flow is measured during the permeability test. A computer-controlled system executes preprogrammed loading strategies and records data such as axial stress, confining pressure, and permeability parameters in real time.
AE signals during the triaxial compression test were collected using the DS5-8A AE monitoring system. A six-channel AE sensor array was configured for full-process signal acquisition. The key operating parameters of the system were set strictly according to the test requirements. The preamplifier gain was set to 40 dB. The noise suppression threshold (NST) was fixed at 50 dB. The signal acquisition bandwidth (SAB) was set to cover the frequency range of 1 kHz–1 MHz. The supporting analysis software can real-time monitor AE event numbers, energy values, and amplitude distributions, and combine multi-parameter features to achieve three-dimensional spatial positioning analysis.
2.2 Sample Preparation and Model Construction
2.2.1 Sample preparation
Standard cylindrical coal specimens (diameter: 50 mm, height: 100 mm) were obtained from the No. 5-2 coal seam of the Hepan coal mine [35]. The coal quality was evaluated based on sulfur, ash, and phosphorus contents, and calorific values ranged from low to ultra-high. The specimens primarily consisted of anthracite, with a minor presence of lean coal. The results of the proximate analysis (PA) for the tested coal samples are summarized in Table 1 [36].
Table 1 Industrial analysis of coal seam properties
| True Density | Apparent Density | ||||
| Mad (%) | Ad (%) | Vdaf (%) | (tm-3) | (tm-3) | Porosity (%) |
| 2.42 | 18.8 | 12.15 | 1.49 | 1.47 | 4.52 |
Secondary precision cutting was performed using a SH260 diamond sand wire cutting machine [37], which operates at a rated voltage of 220 V and provides three-axis travel capabilities (10 200 200 mm). The preparation protocol involved processing five groups of specimens with different pre-defined fracture characteristics. These configurations, based on preset sectioning parameters, are summarized in Table 2.
Table 2 Basic parameters of pre-fractured coal samples
| Fissure Area | |||||
| (cm2) | 0 | 12.5 | 25 | 37.5 | 50 |
| Top view of the specimen |  |
||||
2.2.2 Mathematical model analysis
The fundamental tenet underlying the fluid continuity equation relies on the law of conservation of mass, a principle specifying that the mass corresponding to any continuous medium element in a closed system maintains a constant value during the course of motion. The differential form of this equation accurately depicts the dynamic equilibrium relationship pertaining to mass flux in the spatial domain. Its mathematical expression is:
| (1) |
When the pressure gradient loss dominated by inertial force becomes the key control factor, the Forchheimer equation needs to be used to characterize its nonlinear flow characteristics. This model modifies Darcy’s law through a quadratic term:
| (2) |
By introducing a nonlinear seepage correction term, the non-Darcy effect under high-speed flow conditions is effectively characterized. All numerical simulations in this study are implemented based on the COMSOL Multiphysics platform. A 2D geometric model is first constructed via the finite element method. Corresponding boundary conditions are then set for the established model. Finally, the control equations of the stress-seepage coupling system are solved using the Newton-Raphson iterative algorithm. This yields the distribution characteristics of the seepage velocity field and pressure field, providing a numerical basis for constructing an optimized gas extraction plan. The control equations follow.
Equation of mass conservation:
| (3) |
Stress field control equation:
| (4) | |
| (5) |
where represents the effective stress tensor, is the Biot coefficient, C is the elastic tenso , is the strain tensor, is recognized as displacement field.
Dynamic permeability model:
| (6) |
where is the stress sensitivity coefficient, represents the change in effective stress.
Nonlinear seepage flow equation system for fully fractured coal mass (modified Forchheimer equation):
| (7) |
Considering the influence of crack surface roughness on permeability resistance, the crack-roughness correction coefficient [20] is incorporated into the classical Forchheimer equation. The modified equation is:
| (8) |
where JRC is the joint roughness coefficient of the fracture surface, taken as 5–15 according to the actual fracture characteristics of coal samples.
2.3 Test Procedure
2.3.1 Triaxial compression seepage experiment
Triaxial mechanical testing was conducted on prefabricated jointed coal specimens to investigate the coupled behavior of seepage and stress, with particular emphasis on the dynamic response of the seepage pressure gradient and fluid transport rate under the influence of multifield coupling. A hydraulic servo control system was employed to precisely regulate the pressure gradient. Four experimental groups were established, each subjected to a distinct level of confining pressure while maintaining a constant axial load of 14 kN. For each confining pressure condition, five incremental inflation pressure levels were applied in sequence. A coupling agent is used to fix the AE probe on the surface of the sample for signal collection. After sealing the parameter chamber, start the test once the system stabilizes. Record the axial stress-strain curve and AE signals synchronously during sample damage.
Upon completion of all parameter measurements under full working conditions, the specimens were subjected to failure testing. Loading was applied at a constant rate of 0.02 kN/s until the specimens reached macro-fracture instability. The specific test conditions and parameter design are summarized in Table 3.
Table 3 Experimental design parameters
| Sample | Fissure Area | Effective Confining | Axial Pressure | Import Pressure |
| Number | (cm2) | Pressure (MPa) | (KN) | (MPa) |
| D1 | 0 | 5,6,7,8 | 1.0,1.5,2.0,2.5,3.0,3.5 | |
| D2 | 12.5 | 8,9,10,11 | 0.3,0.4,0.5,0.6,0.7 | |
| D3 | 25 | 14 | ||
| D4 | 37.5 | |||
| D5 | 50 |
All seepage tests in this work were performed under well-regulated standard laboratory conditions. The ambient pressure was held constant at 0.1013 MPa. The ambient temperature was precisely controlled at 201∘C. The relative humidity was kept stable within the range of 40–60%. This environmental control strategy was adopted to rule out disturbances from environmental factors on the physical properties of CO2 and the mechanical characteristics of coal specimens. For boundary pressure regulation during the test, the inlet pressure was adjusted stepwise in line with the preset scheme detailed in Table 3. The outlet pressure was consistently fixed at standard atmospheric pressure throughout the test. This pressure configuration was designed to create a steady pressure gradient between the inlet and outlet. CO2 was used as the permeant medium. Its density under standard conditions was 1.562 g/L, and its dynamic viscosity was 5 Pas at 20∘C [38]. The transport parameters of CO2, including density and viscosity, exhibit significant non-linear dependence on temperature and pressure fields during gas-driven permeation processes.
To enable quantitative control of the pressure gradient within the seepage system, dynamic regulation of the injection pressure was implemented. A spatially graded pressure field was constructed by accurately tuning the gas source parameters. The effective stress applied to the specimens was calculated using the following formula [39, 40]:
| (9) |
where is the effective stress, is the axial pressure, is the hoop pressure, is the inlet pressure, is the outlet pressure.
During the permeability regulation process, the dynamic evolution of the effective stress field induces marked alterations in the geometric characteristics of fractures. This shift in fracture geometry directly drives the nonlinear evolution of the test specimen’s permeability properties. To overcome the core challenge of achieving independent control over fracture area, we proposed a dynamic confining pressure compensation technique. This technique realizes independent regulation of fracture area by maintaining a stable, constant effective stress field throughout the test. It effectively eliminates the interference of multi-field coupling effects on indoor permeability tests and further establishes a univariate correlation mechanism between fracture geometric parameters and permeability properties.
The surrounding pressure tracking mode dynamically adjusts the surrounding pressure parameters to maintain a constant effective confining pressure, with its value derived from the functional relationship between pore pressure and total stress based on effective stress theory [41]:
| (10) | |
| (11) |
where is the effective peripheral pressure (MPa), is the peripheral pressure (MPa), is the Aubert coefficient, taken as 1, P the average pressure, is the inlet pressure, is the outlet pressure (MPa).
During the preparatory stage of the test, 704 organic silicone sealant was applied to the specimen’s sidewall, and the system was sealed using heat-shrink tubing and stainless-steel clamping components [23]. A chain-type sensor was placed at the upper and middle positions of the specimen, and an extensometer system with a bidirectional range of 0.01 mm was calibrated using a precision adjusting device. After vacuum treatment to eliminate residual gas, the confining pressure was incrementally increased within the triaxial chamber to the target value (initial confining pressure: 1 MPa). The transient pressure method was employed to determine permeability parameters under adsorption equilibrium. Permeation pressure was regulated with a precision pressure relief valve, and permeability values under various stress conditions were recorded. The axial load was applied at a constant rate of 0.02 kN/s until structural failure of the specimen occurred. Following test completion, pressure was released synchronously, and the equipment was reset to ensure data integrity and experimental reproducibility.
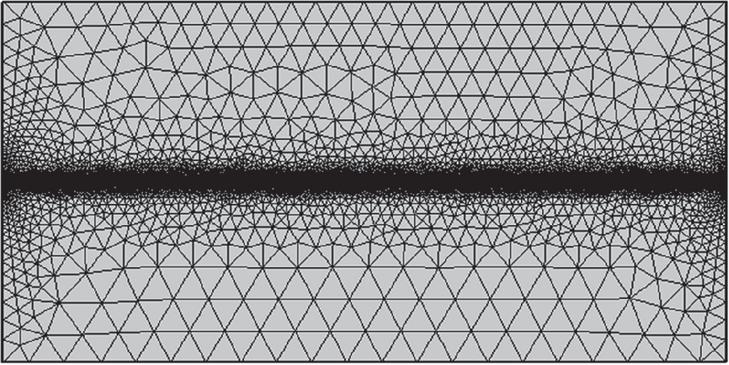
Figure 2 Fractal coal seam geometry grid diagram.
2.3.2 Geometric model establishment and simulation scheme
A 2D geometric model (100 mm 50 mm) is shown in Figure 2. Gas migration in the porous medium adheres to Darcy’s law, whereas the Forchheimer nonlinear equation describes seepage within the fracture zone. Through the partition control method, this model realizes the coupled characterization of linear and nonlinear seepage mechanisms.
The 2D model developed in this study can serve as a theoretical foundation for borehole layout and parameter optimization in cracked coal seams. It applies to the engineering scenarios of deep coal seams with burial depths 1200 m, effective confining pressures ranging from 5 to 11 MPa, and single/multi-plane fracture development. In fractured coal seams, it can offer a theoretical foundation for the design of boreholes and the optimization of gas extraction parameters.
Table 4 2D fracture flow simulation schemes
| Crack | Crack | Number | Crack | |
| Group | Width (mm) | Length (mm) | of Cracks | Inclination Angle |
| Group 1 | 0.08, 0.09, 0.010, 0.11, 0.12 | 100 | 1 | 0∘ |
| Group 2 | 0.12 | 25, 50, 75, 100 | 1 | 0∘ |
| Group 3 | 0.12 | 100 | 1, 2, 3 | 0∘ |
| Group 4 | 0.12 | \ | 1 | 5∘, 10∘, 15∘, 20∘ |
This study methodically examines the influence mechanism of fracture geometric parameters on Forchheimer seepage using the numerical simulation approach shown in Table 4. Specifically, Group 1 analyzes the regulatory effect of fracture width variation on the seepage field; Group 2 reveals the correlation between fracture extension length and seepage resistance; Group 3 quantifies the cumulative effect of fracture number on nonlinear seepage; Group 4 characterizes the anisotropic seepage law induced by changes in fracture inclination angle.
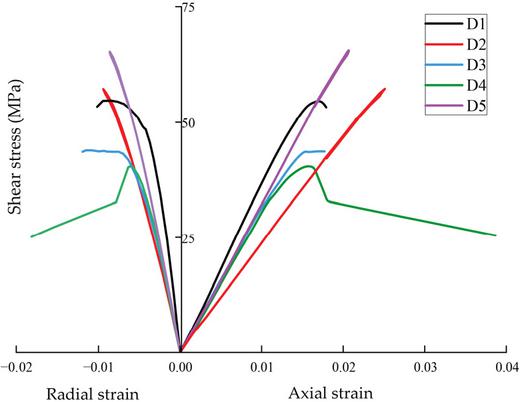
Figure 3 D1-D5 biaxial stress-axial strain-radial strain variation diagram.
3 Experimental Results and Pattern Analysis
3.1 Analysis of Mechanical Parameters Under Triaxial Loading
Figure 3 presents the curves of deviatoric stress versus axial and radial strain for specimens with different fracture regions. All specimens are tested under triaxial loading conditions. The curves clearly reflect that all specimens exhibit consistent deformation behavior throughout the loading process. All specimens underwent four sequential phases [42]: (1) compaction and densification during the application of confining pressure; (2) elastic deformation characterized by linear stress-strain relationships with slope-dependent elastic moduli; (3) yielding behavior characterized by progressive stiffness reduction due to plastic deformation; (4) post-peak failure, reflected by a sudden drop in stress and the onset of strain softening.
Under constant confining pressure, the stress-strain curves and particle displacement data reveal a progressive pore compression response during axial loading. The initial linear increase stage reflects elastic deformation characteristics. As the axial load increased, the slope of the curve decreased, indicating softening behavior, eventually leading to specimen failure due to structural instability. When subjected to triaxial loading, the deviatoric stress exhibited significant nonlinearity with increasing crack area. There was little difference between the intact specimen (0 cm2) and the specimen with a 12.5 cm2 fracture area, while the 25 cm2 specimen showed a 23% decrease. A minimum value of 40.10 MPa was observed at 37.5 cm2, followed by a sudden increase to 65.91 MPa for the 50 cm2 specimen, 20.47 MPa higher than the intact specimen and 62% higher than the minimum value. The peak deviatoric stress reached 1.63 times the minimum value.
The experimental results regarding Young’s modulus (E) and Poisson’s ratio () demonstrate that the mechanical properties of the tested specimens are significantly affected by the degree of crack propagation [43]. Table 5 summarizes the mechanical parameters derived from the conducted triaxial compression tests (TCTs).
Table 5 Mechanical parameters of triaxial compression specimens
| Fissure Area (cm2) | Peak Shear Stress (MPa) | Elastic Modulus (MPa) | Poisson’s Ratio |
| 0 | 55.20 | 3708.48 | 0.34 |
| 12.5 | 55.09 | 2378.15 | 0.37 |
| 25 | 43.12 | 3025.36 | 0.44 |
| 37.5 | 40.10 | 3187.52 | 0.38 |
| 50 | 65.91 | 3235.71 | 0.41 |
Experimental data shows that the complete specimen exhibited a peak elastic modulus of 3708.48 MPa, demonstrating the strongest resistance to elastic deformation and a positive correlation with induced stress. When the fracture area increased to 50 cm2, the elastic modulus decreased by 12.74%, although the specimen achieved the highest triaxial compressive strength. Notably, the specimen with a 12.5 cm2 crack area exhibited an abnormal 35.7% decrease in elastic modulus, whereas the 25 cm2 specimen displayed a 26.87% increase, indicating a stiffness recovery phenomenon during the later stages of fracture development.
Poisson’s ratio further illustrates these effects. The specimen with a 25 cm2 fracture area reached a maximum Poisson’s ratio of 0.44, which is 43.7% higher than that of the intact specimen. This pronounced transverse strain response and constrained axial deformation resulted in strain anisotropy, exacerbating the volume shrinkage. In contrast, the lowest Poisson’s ratio of 0.34 observed in the intact specimen reflects a deformation mechanism dominated by axial strain. Combined with high stiffness, this enables superior compressive load-bearing capacity and volume stability. The development of fractures significantly influences the macroscopic mechanical response by altering strain distribution characteristics.
3.2 Evolution Law of Precast Fractured Coal Body Failure
3.2.1 Characteristics of three-axis acoustic emission signals
During the triaxial compression process, the AE response is significantly correlated with the stress-strain curve. The ringing count rate is low and stable during the compaction stage. The cumulative count growth rate in the elastic stage is slowing down. The initiation of cracks during the yielding stage leads to a sudden increase in the count. The AE during the damage expansion period exhibits nonlinear acceleration characteristics. As the peak intensity approaches, the sample enters a critical state of instability, and the AE signal significantly increases. Now, of macroscopic rupture, the ringing count shows a step increase, and the slope of the cumulative curve suddenly changes, indicating that the energy release rate has reached an extreme value. The results of the experiment demonstrated a synergistic evolution mechanism and a significant synchronous association between the AE ringing count and its cumulative value with the axial stress evolution and the shape of the deviatoric stress-strain curve. Figure 4 presents the characteristics of AE ringing counts.
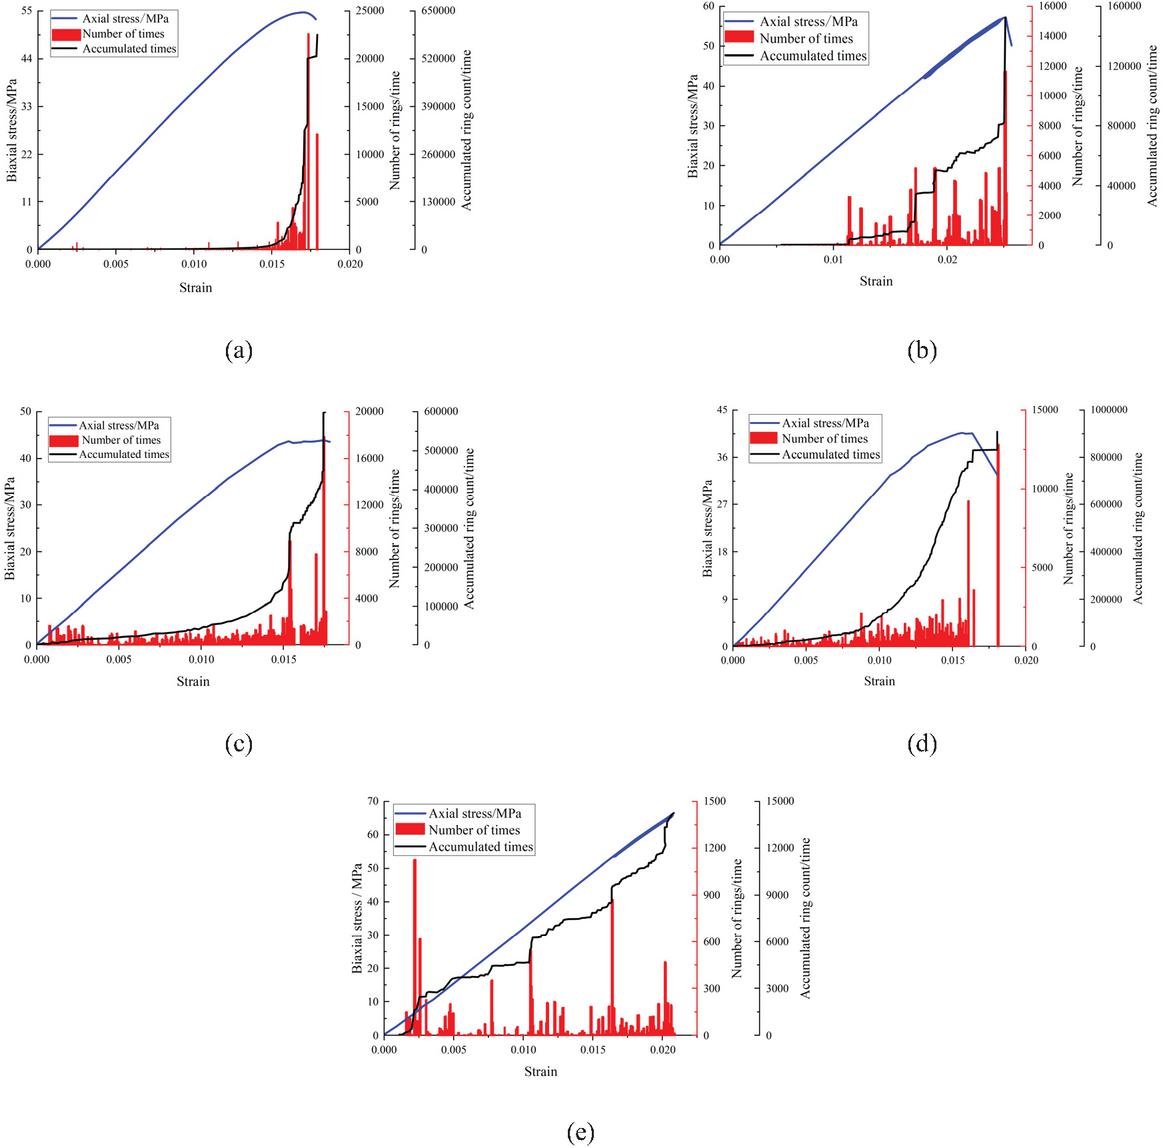
Figure 4 Three-axis compression-coal sample acoustic emission ringing count chart: (a) D1, (b) D2, (c) D3, (d) D4, (e) D5.
Coal samples with varying fracture areas demonstrate distinct evolution patterns of AE ringing counts during triaxial compression. The complete sample (0 cm2) exhibits a three-stage characteristic of “stable state, active state, sudden transformation” with a ringing count rate of 23829/s during the failure stage and a cumulative total of 588058 counts. The 12.5 cm2 specimen displays a “low stability pulse, sudden increase” mode, featuring eight pulse peaks during the yield stage (reaching up to 2788/s) and a cumulative total of 154253 counts during the failure stage. The 25 cm2 sample exhibits a response mechanism characterized by “steady-state oscillation, energy level transition, critical instability” with a peak value of 19541/s at the moment of failure. The ringing count of the 37.5 cm2 sample surges to 12756/s at the critical moment of failure, and the cumulative total increases exponentially. The initial ringing count rate of the 50 cm2 sample sharply rises to 1210/s before decaying to 208/s, with a cumulative total of only 14224 counts. Its non-stationary fluctuation characteristics are significantly different from those of other samples. Research indicates that as the crack area increases, AE activity shows an evolutionary trend of decreasing response intensity and weakening stage characteristics, with cumulative ringing parameters significantly positively correlated with the degree of material damage.
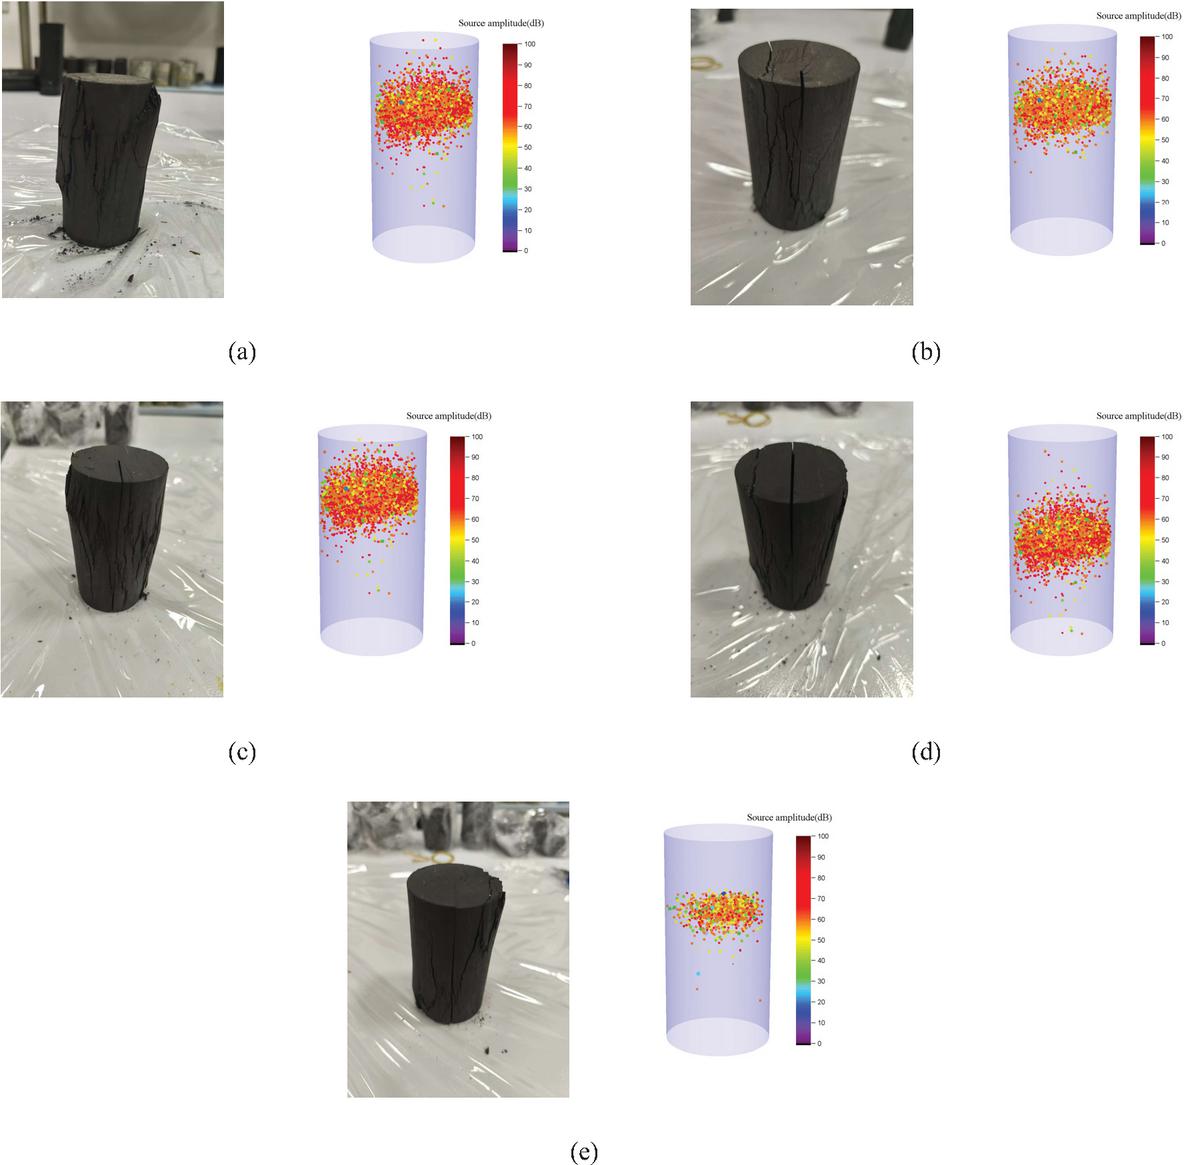
Figure 5 Space location of D1-D5 and specimen failure comparison chart: (a) D1, (b) D2, (c) D3, (d) D4, (e) D5.
3.2.2 Evolution of fracture space in prefabricated fractured coal samples
AE three-dimensional positioning technology is employed in this study. This technology can efficiently track the development and propagation of internal cracks within the test specimens. Meanwhile, the correlation between specimen deformation and AE monitoring data is clarified. A distinct positive correlation is confirmed between the magnitude of specimen deformation and the number of AE location sites. During the compaction stage, the positioning points are sparse and exhibit low amplitudes, indicating the absence of structural damage due to pore compaction. The increase in positioning points during the elastic stage reflects not entirely reversible elastic deformation, local friction, particle breakage, and crack propagation. A sharp increase in the number of positioning points during the yielding stage, along with the predominance of medium to high amplitudes, signifies extensive crack development accompanied by fragmentation and sliding, resulting in a sudden increase in AE intensity. The spatial fragmentation evolution law of prefabricated fractured coal samples can be summarized in Figure 5.
For the D1 sample, AE localization points are predominantly concentrated in the severely damaged area and near the fracture surface, with their spatial distribution highly consistent with the actual damage morphology. These points are mainly enriched in the upper part of the specimen, and the central point corresponds precisely to the shear plane, validating the accuracy of AE technology. In contrast, D2 shows a significant reduction in the number of localization points and cumulative ringing counts, indicating less crack development. D3 has more localization points than D2, concentrated mainly in the middle of the specimen with sparse distributions in the upper and lower parts, while D4 has a similar number of points concentrated in the central region. For D5, penetrating cracks cause sound wave energy attenuation, resulting in the lowest number of localization points and peak ringing counts, with effective signal capture below the monitoring system threshold.
3.3 Analyze the Results of the Triaxial Seepage Test
3.3.1 Nonlinear gas flow theory of fissured coal bodies
Based on the intrinsic correlation between pressure gradient and seepage velocity, the seepage behavior in fractured coal reservoirs can be classified into two distinct categories: linear seepage and nonlinear seepage. Specifically, when the pressure gradient exhibits a direct proportionality to the seepage velocity, the flow regime adheres to the Darcy’s law of seepage [44]. In such cases, classical Darcy’s law can be applied to describe the fluid flow. Under nonlinear flow conditions, however, the fluid dynamics must be characterized using the Forchheimer equation. Seepage constitutive models for porous media have clear and distinct applicable boundaries. Darcy’s law holds reliably for fluid flow through porous media under low Reynolds number regimes, whereas the Forchheimer model can accurately characterize the nonlinear seepage behavior observed under high-velocity seepage conditions or within complex pore-fracture geometries.
In accordance with the fundamental theory of linear seepage (LS), gas migration behavior within coal seams strictly adheres to Darcy’s law (DL), which inherently defines a linear quantitative relationship regarding the permeability of the seepage medium [45]:
| (12) |
where is the flow velocity (m/s), is the gas dynamic viscosity coefficient (Pas), is the permeability of coal seam (m2), dL is the minimum length in the direction of fluid flow (m), is the pressure difference in the length of dL (Pa), dL is the minimum length in the direction of fluid flow (m).
Under high-velocity flow conditions, Darcy’s law becomes inadequate for characterizing gas migration in fractures due to the significant influence of inertial forces. The Forchheimer equation-intrinsically integrating the intrinsic characteristics of nonlinear seepage-offers a more precise characterization of the nonlinear correlation between pressure gradient and seepage velocity:
| (13) |
where represents the pressure gradient (MPa/m), is the fluid density (kg/m3), is for non-Darcy permeability factor (m-1).
Equation (13) indicates that when the gas flow velocity in the fracture is extremely low, the linear term dominates, while the nonlinear term is negligible. In this case, the equation simplifies to , and the fluid flow adheres to Darcy’s law. However, at sufficiently high flow velocities, the nonlinear term can no longer be ignored, necessitating the use of the Forchheimer equation to accurately describe the fluid behavior.
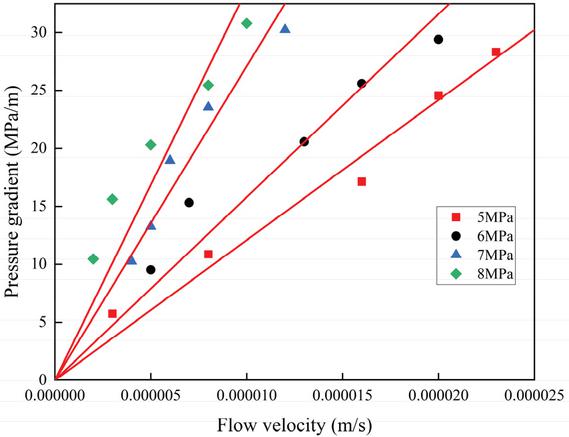
Figure 6 D1 pressure gradient-flow velocity fitting curves at different effective confining pressures.
3.3.2 Analysis of pressure gradient–flow velocity relationship
Figure 6 illustrates the pressure gradient–flow velocity response of complete coal samples during loading as effective confining pressure changes. Regression analysis was performed on the experimental dataset using Darcy’s basic theory of linear permeability, confirming the presence of a clear linear positive connection between the pressure gradient and seepage velocity within the research area. With a decrease of 42.7% between the highest (5 MPa) and lowest (8 MPa) values, permeability clearly shows a nonlinear fall as the confining pressure rises from 5 MPa to 8 MPa. Under increased triaxial compression, the pore-fracture network in the coal matrix gradually collapses, with fissure closure reaching 23.6% of its starting aperture, according to microscopic examination. This structural densification raises the tortuosity of seepage channels and reduces the effective seepage cross-section. The synergistic effect of these two changes forms the core mechanism leading to permeability decay.
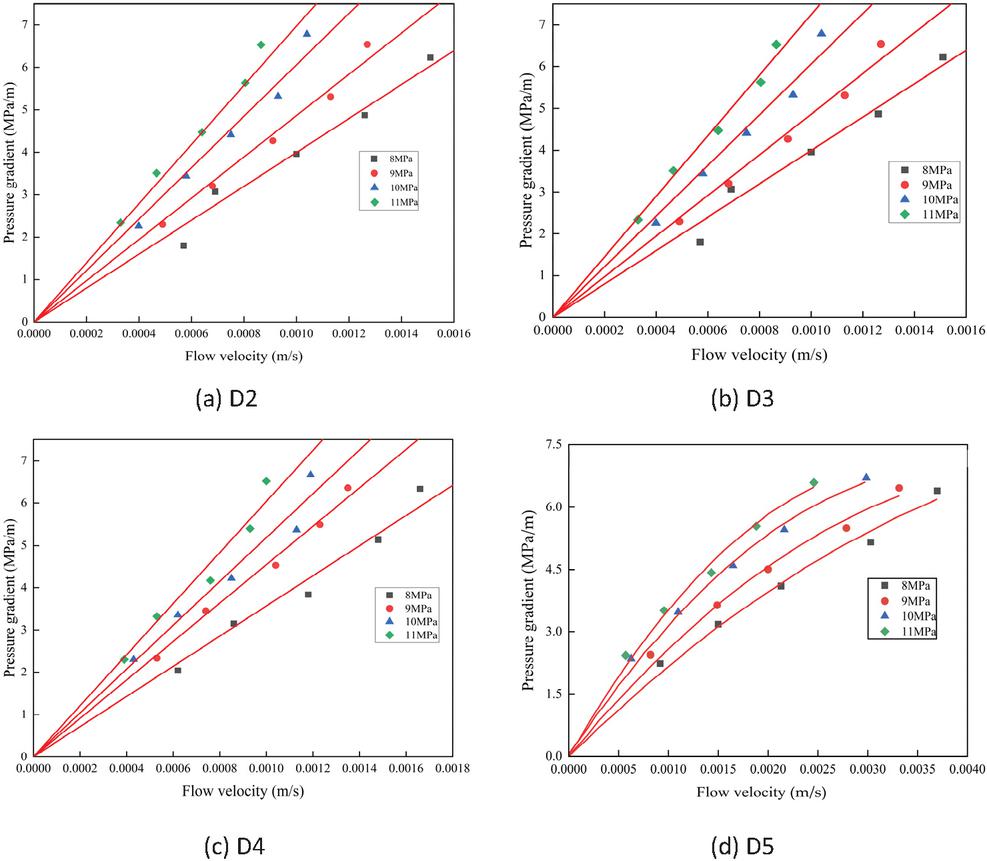
Figure 7 Distribution map of pressure gradient-flow velocity under different confining pressures D2-D5.
As illustrated in Figure 7, the pressure gradient-seepage velocity curves of D2–D5 fractured coal specimens display distinct nonlinear behaviors under different effective confining pressure conditions-reflecting intrinsic permeability instability within the fracture networks and a clear deviation from Darcy’s linear seepage law. As the confining pressure increases, fracture closure intensifies, leading to higher flow resistance and continuous decreases in permeability K, rather than significant increases in the non-Darcy flow factor . This coupling effect enhances the influence of the nonlinear term relative to the pressure gradient at the same flow velocity, thereby amplifying non-Darcy flow behavior.
The nonlinear characteristics across specimens reveal differentiated evolution patterns. The seepage curves of D2, D3, and D4 display a convex shape transitioning from the concave side to the pressure gradient axis, while the D5 curve exhibits a transition toward the velocity axis, indicating secondary flow characteristics. These morphological variations illustrate the dynamic transformation in dominant flow mechanisms-from viscous dissipation to inertial pressure loss associated with fracture network complexity. The relative influence of these mechanisms in each sample can be quantitatively described using the weight coefficients of the nonlinear term, i.e., the Forchheimer number [46].
In the Forchheimer equation, the linear term represents viscous pressure losses in porous media, whereas the nonlinear term accounts for inertial effects. In this experiment, the Forchheimer equation parameters and were determined through nonlinear regression and least squares fitting of the pressure gradient–velocity data. The reciprocal of corresponds to the material permeability K, while serves as the correction factor for non-Darcy flow behavior [47]. The parameter matrix in Table 6 provides the quantitative basis for the subsequent analysis of seepage characteristics.
Table 6 K and fitting parameters
| Effective | ||||||
| Fissure | Confining | |||||
| Sample | Area | Pressure | ||||
| Number | (cm2) | (MPa) | K (m2) | (m-1) | Fitted Equation | R2 |
| D1 | 0 | 5 | 2.21 1017 | 0 | y 813107x | 0.9718 |
| 6 | 1.72 10-17 | 0 | y 1056450x | 0.9821 | ||
| 7 | 8.9 10-18 | 0 | y 1592134x | 0.9850 | ||
| 8 | 5.94 10-18 | 0 | y 3245213x | 0.9891 | ||
| D2 | 12.5 | 8 | 4.71 10-15 | 240329 | y 300643x2 3781.3x | 0.996 |
| 9 | 3.83 10-15 | 295821 | y 370079x2 4637.6x | 0.9521 | ||
| 10 | 3.08 10-15 | 361299 | y 451965x2 5270.3x | 0.9789 | ||
| 11 | 2.57 10-15 | 403171 | y 502080x2 6910.7x | 0.9960 | ||
| D3 | 25 | 8 | 5.31 10-15 | 221800 | y 277421x2 3342x | 0.9818 |
| 9 | 4.21 10-15 | 272184 | y 341396x2 4329.2x | 0.9892 | ||
| 10 | 3.72 10-15 | 301235 | y 378976x2 4910.9x | 0.9748 | ||
| 11 | 3.21 10-15 | 345930 | y 427620x2 5758.7x | 0.9809 | ||
| D4 | 37.5 | 8 | 6.42 10-15 | 49814.5 | y 62348x2 2617.5x | 0.9854 |
| 9 | 6.22 10-15 | 71443.3 | y 97726x2 2894.5x | 0.9963 | ||
| 10 | 4.75 10-15 | 105151 | y 131864x2 3830x | 0.993 | ||
| 11 | 3.71 10-15 | 138577 | y 173017x2 4719.05x | 0.995 | ||
| D5 | 50 | 8 | 7.59 10-15 | 142010 | y 181250x2 2260.6x | 0.9805 |
| 9 | 6.16 10-15 | 235622 | y 296532x2 2792x | 0.9891 | ||
| 10 | 4.91 10-15 | 373024 | y 469892x2 3592.3x | 0.9905 | ||
| 11 | 4.35 10-15 | 587652 | y 595761x2 4123.1x | 0.9790 |
The negative non-Darcy coefficient of the specimen with a 50 cm2 fracture area is caused by the formation of dominant seepage channels in the coal mass with large-area prefabricated fractures. When gas flows in the fracture, the boundary layer separation effect occurs, and the secondary flow and eddy current are formed in the fracture. At this time, the inertial force shows a “drag reduction effect” on the seepage, resulting in a negative quadratic term coefficient in the Forchheimer equation fitting.
Under fixed confining pressure conditions, the enlargement of fracture area markedly boosts the conducting capacity of seepage channels, which in turn drives a distinct increase in seepage velocity. In contrast, specimens with smaller fracture areas show pronounced inertial pressure losses under equivalent flow conditions, due to elevated values. This is evidenced by the vertical-axis depression observed in the pressure gradient–velocity curves. For instance, the specimen with a 12.5 cm2 fracture area exhibits substantial inertial pressure loss due to a high , necessitating greater pressure gradients to sustain the same velocity. At 25 cm2, flow characteristics remain similar; however, distinct deviations appear at 37.5 cm2. A notable morphological transition is observed at 50 cm2, where the curve shifts toward a concave shape along the velocity axis. All specimens display consistent flow behavior across the confining pressure range of 8–11 MPa (Figure 8).
According to the error transfer theory, the uncertainty of permeability K and non-Darcy coefficient in this study mainly comes from three aspects: (1) Measurement error of test instruments: the measurement error of axial pressure and confining pressure sensor is 0.1 MPa, the measurement error of the gas flow meter is 2%, and the total relative uncertainty caused by instrument error is 4.2%; (2) Geometric parameter error of prefabricated fractures: the measurement error of fracture length and width is 0.02 mm, the dip angle error is 1∘, and the relative uncertainty caused by fracture parameter error is 5.7%; (3) Fitting error of the Forchheimer equation: the fitting determination coefficient R2 of all test data is above 0.95, and the relative uncertainty caused by fitting error is 3.1%.
Through the synthesis of each error source, the total relative uncertainty of permeability K in this study is 7.8%, and the total relative uncertainty of non-Darcy coefficient is 10.2%, both of which are within the allowable range of geotechnical test accuracy, indicating that the test data have high reliability.
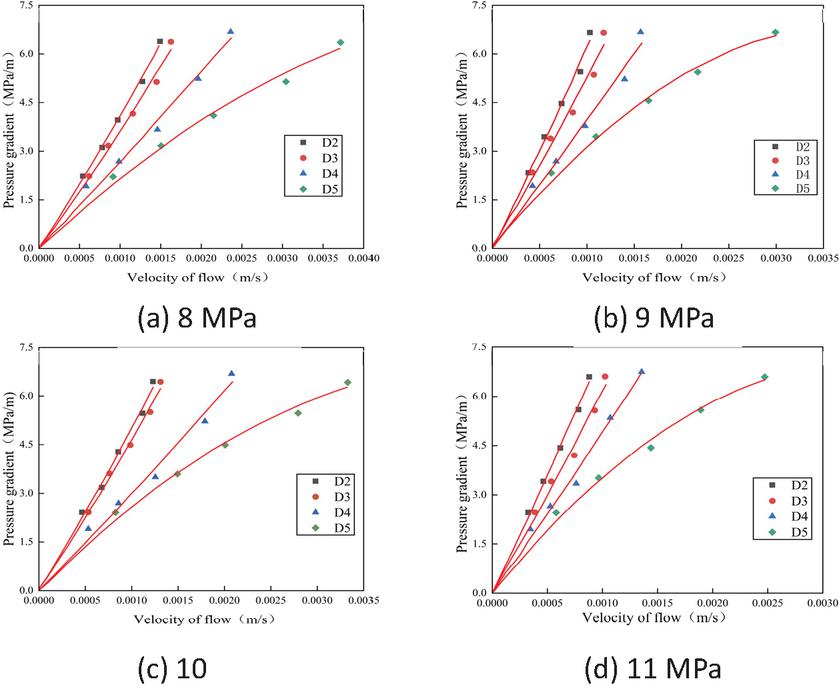
Figure 8 D2-D5 pressure gradient-velocity curves at the same effective wall pressure.
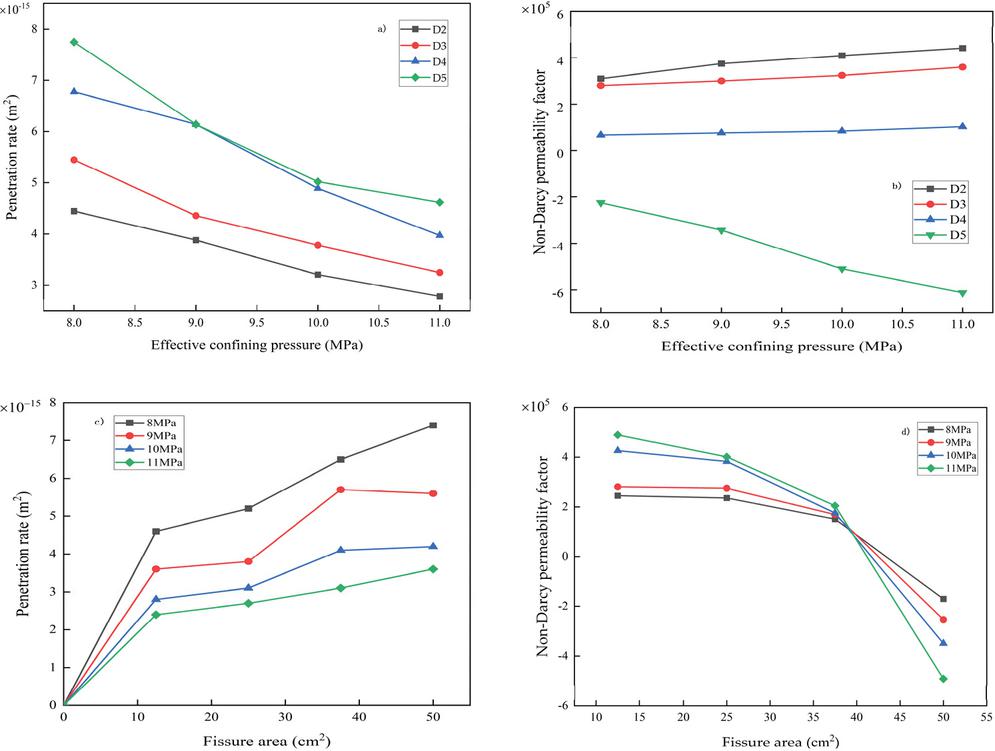
Figure 9 Analysis diagram of coefficients for linear and nonlinear terms in Forchheimer equation.
3.4 Analysis of Linear and Nonlinear Coefficients of the Forchheimer Equation
The evolution of permeability with effective confining pressure is shown in Figure 9(a). The permeability of coal specimens with different crack area configurations shows a gradual declining tendency as the effective confining pressure increases incrementally, with all tested samples reaching their minimum permeability values at an effective confining pressure of 11 MPa. Interestingly, there is a positive link between crack area and permeability; samples with bigger crack regions had higher permeability under the same confining pressure settings. Figure 9(b) reveals that the non-Darcy coefficient is closely associated with effective confining pressure: as confining pressure increases [48], the values of samples with crack areas of 12.5, 25, and 37.5 cm2 incrementally rise, while the value of the 50 cm2 crack area sample displays a monotonic increasing trend. A significant positive correlation exists between the two, verifying the regulatory role of confining pressure in nonlinear seepage behavior, where the quantitative relationship between seepage parameters and confining pressure is dependent on crack scale.
Figure 9(c) demonstrates that under constant effective confining pressure, permeability increases with the expansion of crack area; however, this enhancement effect is notably attenuated at 9 MPa. When the crack area increases from 12.5 cm2 to 25 cm2, permeability only rises by 7.3%, indicating a convergent trend in the growth rate. This trend is consistently observed across all tested pressure levels. Specifically, under identical confining pressure conditions, permeability shows a distinct positive correlation with the degree of fracture development. As illustrated in Figure 9(d), the value decreases progressively as fracture area increases, and ultimately transitions to a negative value at a fracture area of 50 cm2. Under 8 MPa confining pressure, the absolute value of the 50 cm2 sample is markedly greater than that of the 12.5 cm2 sample. Further increases in confining pressure will amplify the absolute value of , which directly confirms that confining pressure exerts a pronounced regulatory effect on nonlinear seepage behavior.
The ratio of the Forchheimer equation’s linear viscous term to its nonlinear inertial term is defined as the Forchheimer number () [49], which quantifies the relative contribution of inertial versus viscous pressure losses. This dimensionless parameter is used as a criterion to determine whether Darcy flow conditions are dominant over non-Darcy regimes [50].
| (14) |
where is the Forchheimer number.
By substituting Equation (6) into the expression used to calculate the nonlinearity coefficient [51], the following relationship can be derived:
| (15) |
When the nonlinearity parameter exceeds 0.1, the corresponding Forchheimer number surpasses 0.11, indicating that inertial force-induced pressure gradient losses become significant. Theoretical derivation identifies as the critical threshold distinguishing linear from nonlinear seepage mechanisms. Beyond this value, the inertial term must be incorporated into the analysis of seepage flow behavior.
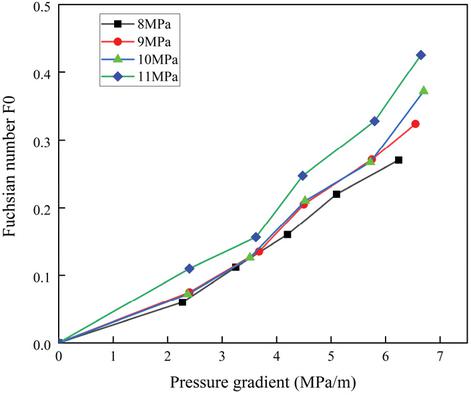
Figure 10 Relationship curve between the Forchheimer number and the pressure gradient.
Experimental results presented in Figure 10 demonstrate a significant correlation between the Forchheimer number and variations in pressure gradient, with this relationship showing systematic behavior across different confining pressures. Within the tested confining pressure range, the response function of to changes in pressure gradient remained stable. The value of progressively increased with rising pressure gradient. When exceeded 0.11 [52], the flow regime in fractured specimens transitioned from Darcy-type linear flow to a nonlinear flow regime governed by the Forchheimer equation, indicating an essential alteration in fluid transport mechanisms under critical pressure gradient conditions.
3.5 Numerical Simulation of Gas Seepage in Prefabricated Fractured Coal Seams under Different Working Conditions
3.5.1 Investigating the impact of fracture aperture on gas seepage characteristics
Figure 11 displays the outcomes of the numerical simulation, which reveal that a high-pressure zone with a peak value of 0.65 MPa forms around the gas injection hole. The gas pressure presents a characteristic of gradient attenuation along the fluid seepage path. It is worth noting that the geometric parameters of the fracture structure have a pronounced positive correlation with the spatial distribution characteristics of the gas pressure field. As the fracture width increases from 0.08 mm to 0.12 mm, the growth rate of the outlet flow velocity exhibits a progressive decreasing trend. This phenomenon indicates a negative correlation between the increment of flow velocity and fracture width. Analysis of the intrinsic mechanism shows that the improvement of permeability leads to a reduction in the gradient of flow driving force. This effect constitutes the essential feature of nonlinear flow growth in fracture systems under the condition of constant inlet pressure.
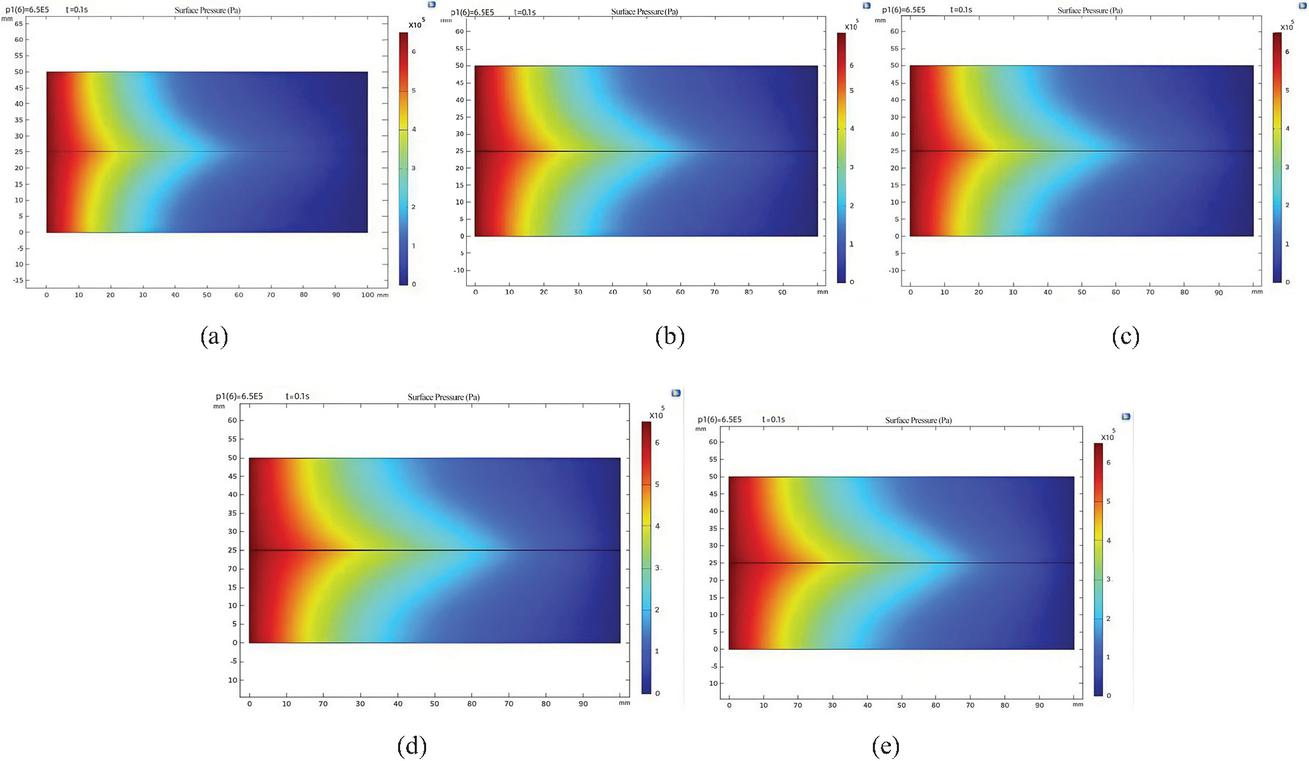
Figure 11 Different fissure width-gas pressure change contour map: (a) 0.08 mm, (b) 0.09 mm, (c) 0.10 mm, (d) 0.11 mm, (e) 0.12 mm.
Figure 12 presents the temporal dynamic evolution characteristics of gas pressure when the crack opening is 0.08 mm. The high pressure in the inlet area is significant, and the pressure decreases with increasing migration distance. At the initial stage of 0.02 s, the high-pressure zone exhibits a confined coverage range, which gradually expands as the seepage process proceeds. At this point, the pressure at the center section of the crack is the lowest and continues to rise over time, reaching its peak at 0.1 seconds. This observation demonstrates that fractured media exhibit a prominent unsteady-state mass transfer behavior, with the redistribution of the pressure field displaying distinct time-dependent characteristics.
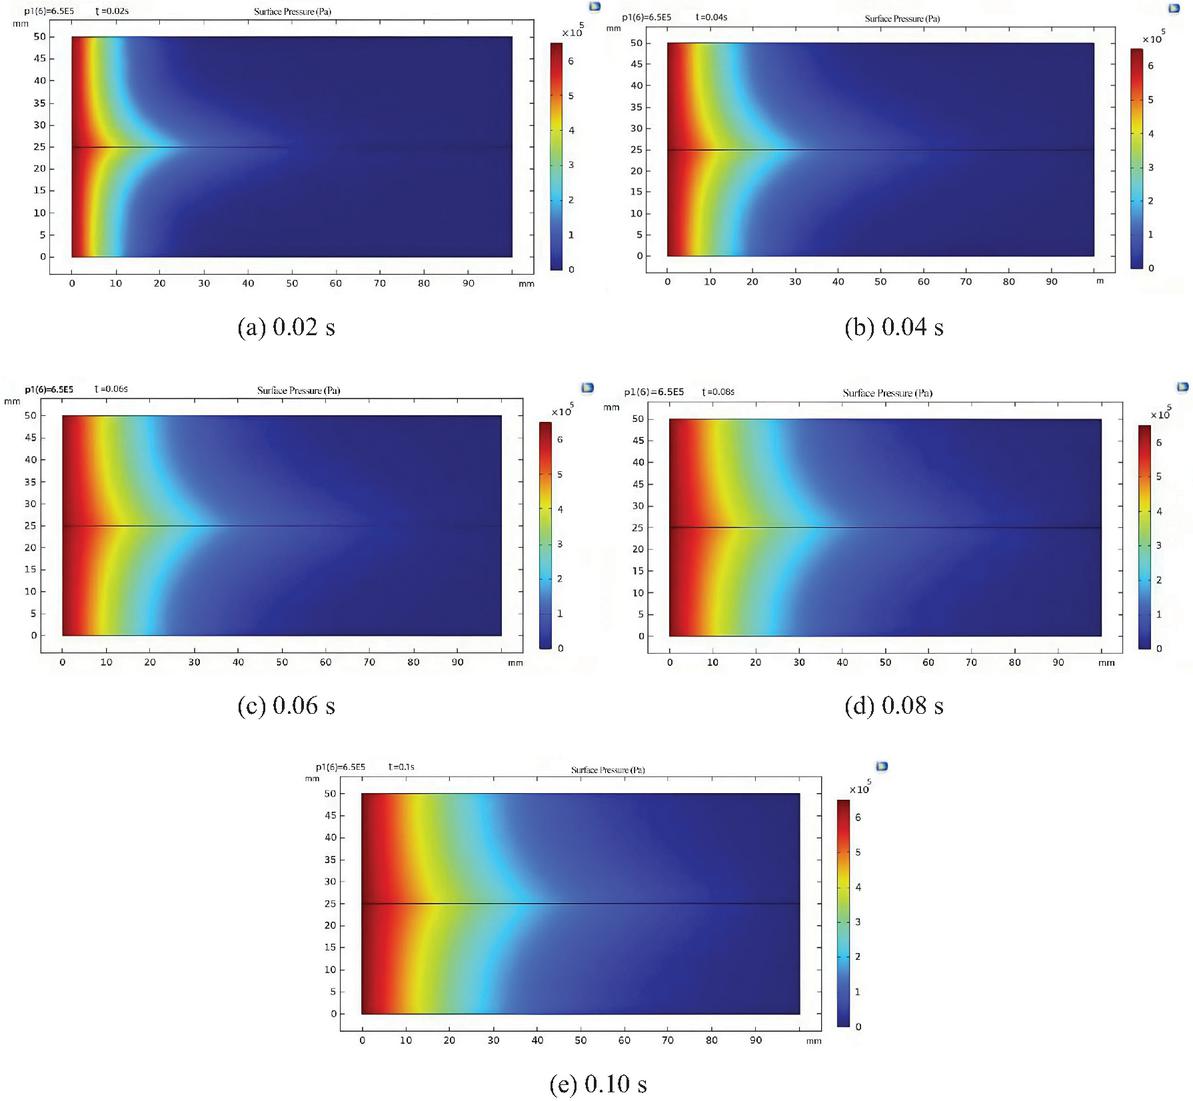
Figure 12 Cloud map of gas pressure change in coal seam: (a) 0.02 s, (b) 0.04 s, (c) 0.06 s, (d) 0.08 s, (e) 0.10 s.
3.5.2 Analysis of the influence of fracture inclination angle on gas seepage
Figure 13 maps out the spatial distribution features of the gas pressure field within coal seams with varying dip angles. For this group of tests, we fixed the fracture aperture at 0.1 mm and the injection inlet pressure at 0.65 MPa. Under this unified test condition, coal seams with different inclination angles present highly comparable gas pressure distribution patterns. What stands out is that the fracture dip angle plays a distinct role in regulating the distribution characteristics of high-pressure zones near the fractures. Meanwhile, when the fracture inclination angle is 5∘, the lower high-pressure zone exhibits a notably dominant distribution pattern. As the inclination angle increases to 10∘ and 15∘, the coverage range of the high-pressure zone decreases in a stepped fashion. When the inclination angle reaches 20∘, the high-pressure zone area attains its minimum value and transforms into a banded distribution aligned with the fracture orientation.
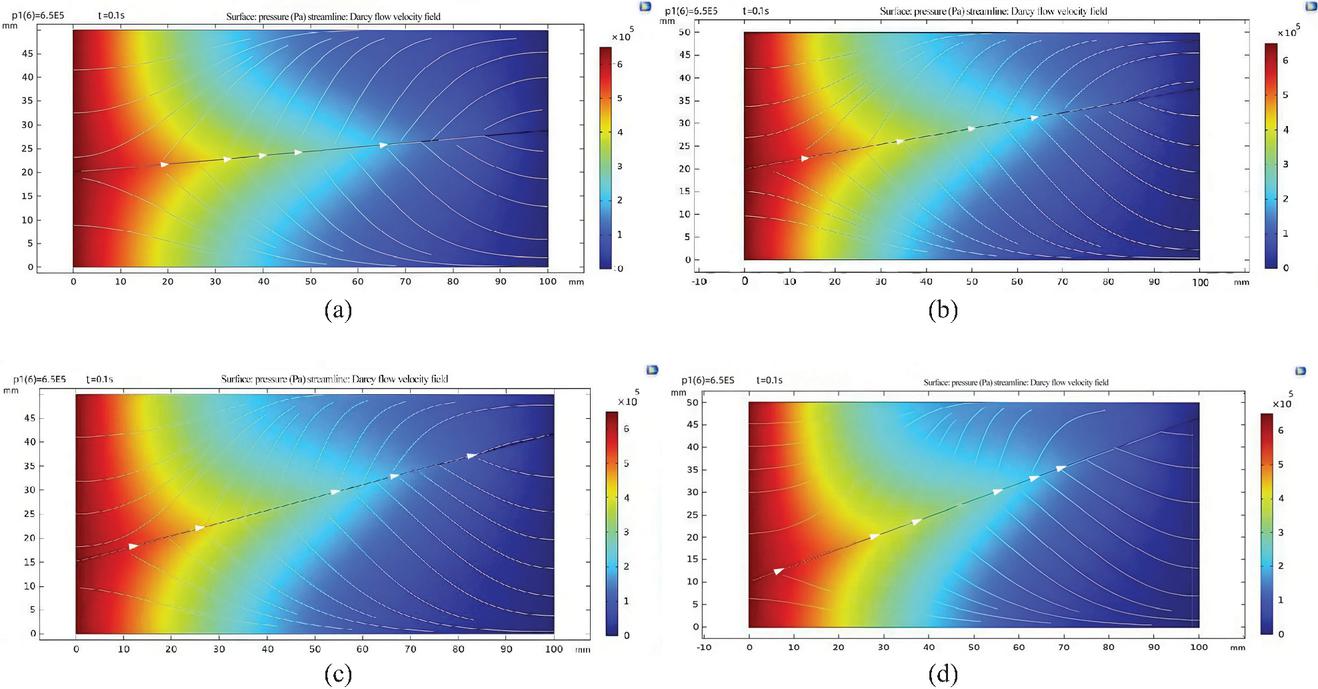
Figure 13 Fissure inclination angle-gas pressure change contour map: (a) 5∘, (b) 10∘, (c) 15∘, (d) 20∘.
The analysis of the evolution characteristics of coal seam seepage field with a 5∘ fracture inclination angle shows that at t 0.02 s, the gas flow velocity at the fracture outlet reaches 1.810-3 m/s; At t 0.04 s, the parameter increased to 2.3 10-3 m/s, with a 27.7% increase in seepage velocity compared to the previous observation point. When t 0.06 s, the recorded velocity at the crack outlet is 2.62 10-3 m/s. Compared with the previous time node, its growth rate has decreased to 13.9%, indicating a decreasing trend in growth rate. Continue to observe until t 0.08 s, and the outlet velocity slightly increases to 2.75 m/s, at which point the velocity increment significantly narrows. At t 0.1 s, the outlet flow velocity stabilizes at 2.78 m/s, and the increase in flow velocity further decreases. Experimental data show that over time, the gas flow velocity at the crack outlet exhibits a gradual increase, but the growth rate shows a decreasing trend step by step. The results highlight a consistent trend across all working conditions with varying fracture dip angles. As the coal seam fracture dip angle increases sequentially to 10∘, 15∘, and 20∘, the evolution law of the outlet gas flow velocity shares highly similar features with that observed under the 5∘ dip angle working condition.
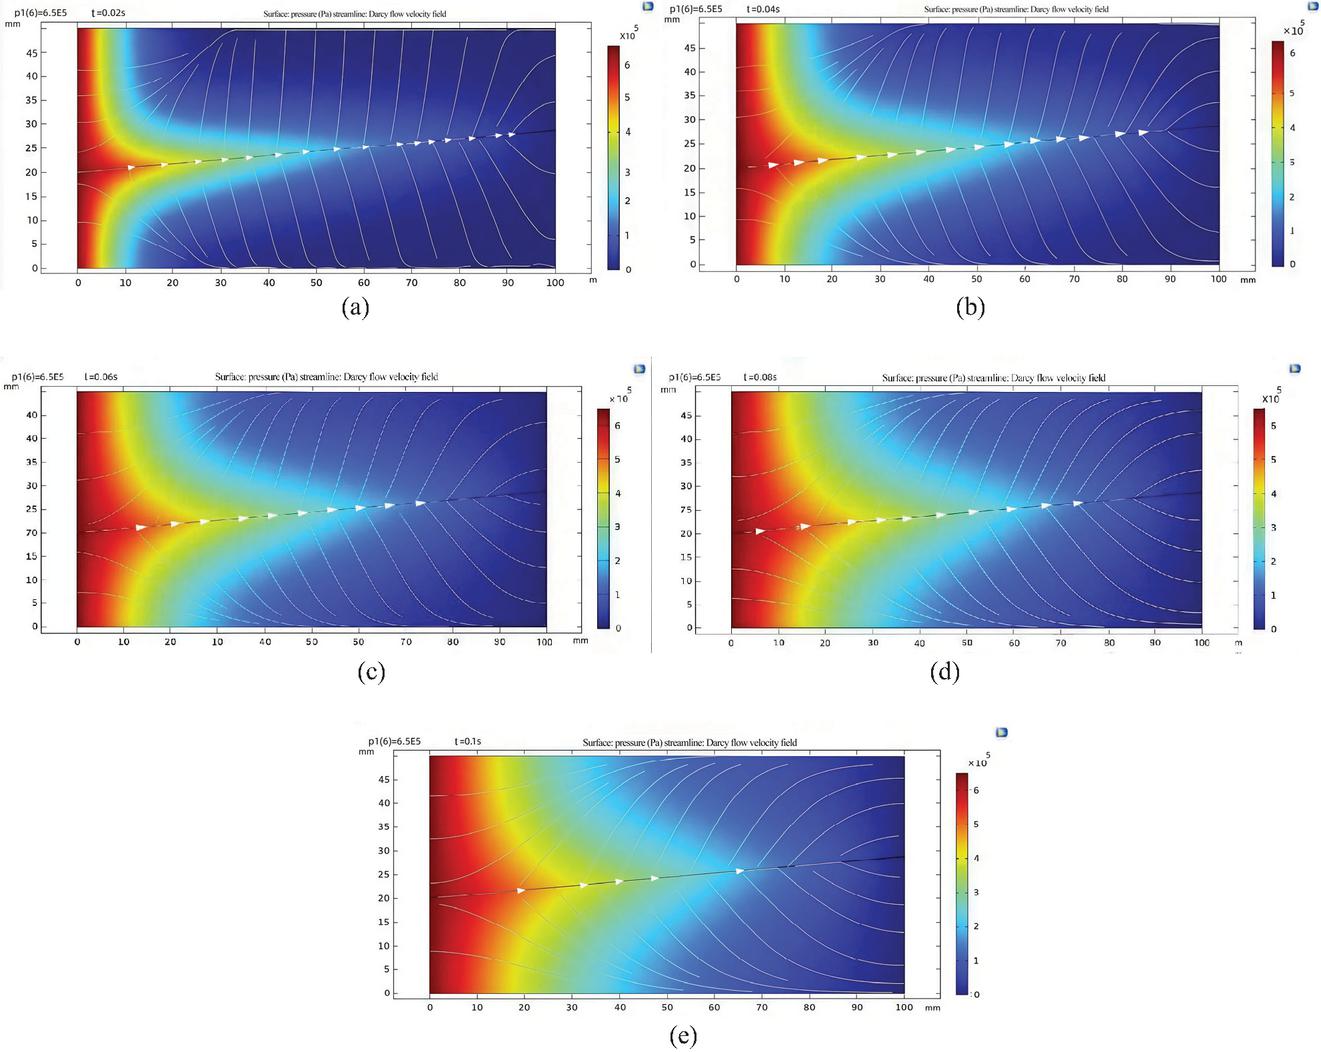
Figure 14 Time change 5∘ fissure dip angle gas pressure contour map: (a) 0.02 s, (b) 0.04 s, (c) 0.06 s, (d) 0.08 s, (e) 0.10 s.
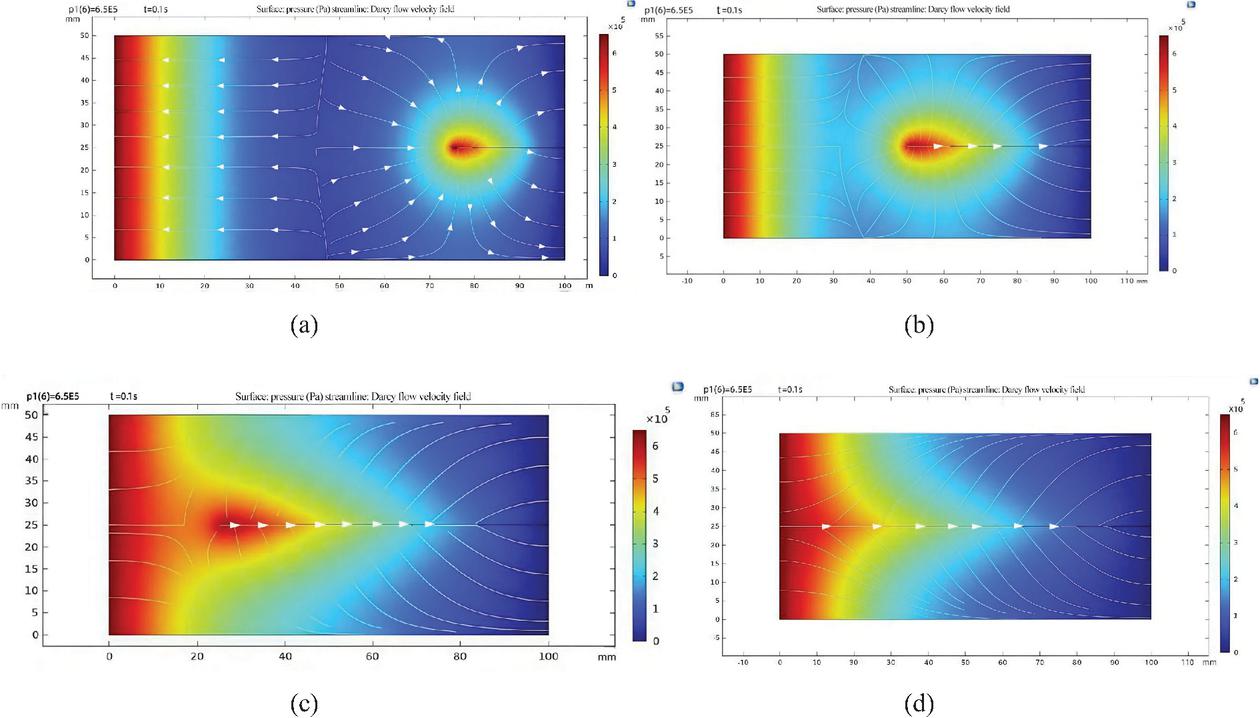
Figure 15 Gas pressure in coal seams with different fracture lengths: (a) 25 mm, (b) 50 mm, (c) 75 mm, (d) 100 mm.
3.5.3 Analysis of the influence of fracture length on gas seepage
The findings presented in Figure 15 demonstrate that the gas migration inlet region exhibits relatively higher-pressure values, with the pressure field displaying a decreasing tendency as the migration pathway extends. When the gas flow approaches the fracture structure, the pressure field undergoes a reverse variation, characterized by a gradual rise in pressure that peaks at 0.65 MPa at the fracture terminus-consistent with the inlet pressure. This observation reflects that fracture expansion exerts a significant inhibitory effect on gas seepage, though the blocking capacity diminishes as the fracture extends. When the fracture length increases sequentially from 25 mm to 100 mm, the gas flow velocity at the outlet shows a continuous decreasing trend. Notably, the attenuation rate of the flow velocity slows down gradually as the fracture extends further. Turning to the distribution characteristics of the gas pressure field: the high-pressure region (with gas pressure no less than 0.6 MPa) covers the smallest area when the fracture length is fixed at 25 mm. As the fracture length increases, the spatial coverage of this high-pressure zone expands significantly. Once the fracture length reaches 75 mm, the gas pressure at the coal seam inlet and the fracture tip tends to converge, leaving the entire gas migration channel in a stable high-pressure state.
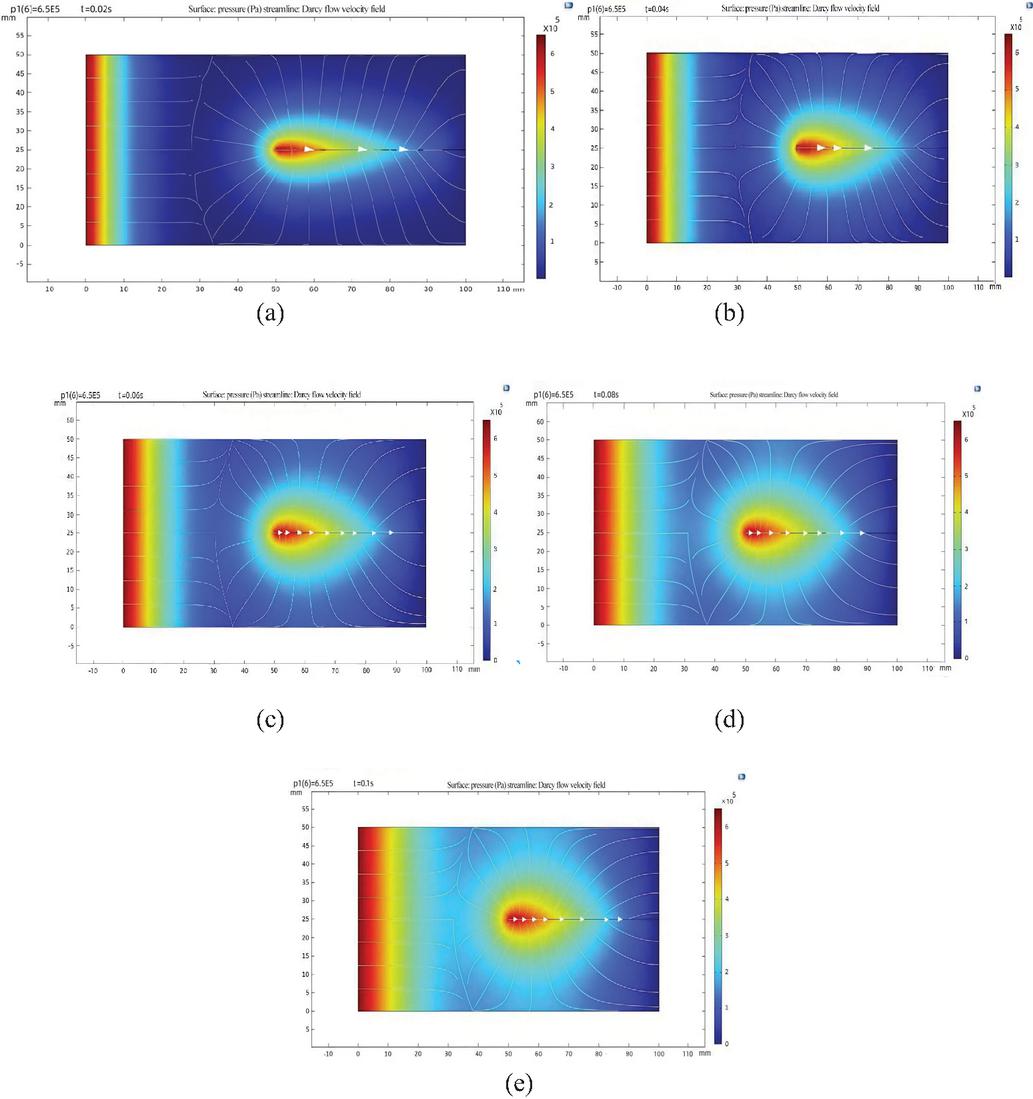
Figure 16 Time variation of the 50 mm fissure-gas pressure contour map: (a) 0.02 s, (b) 0.04 s, (c) 0.06 s, (d) 0.08 s, (e) 0.10 s.
For tests conducted under a constant fracture aperture of 50 mm, Figure 16 illustrates the dynamic spatiotemporal distribution features of coalbed methane (CBM) pressure across varying time intervals. Observations reveal a significant pressure gradient in the fracture entrance region, with pressure decreasing along the flow direction; however, a local pressure elevation emerges near the fracture tip. As fractures expand and time elapses, the high-pressure zone within the coal seam gradually expands. During the development stage of 0.02 s–0.1 s, the initial low pressure around the fractures gradually increases to a relatively higher level, yet it remains significantly lower than the pressure in the inlet and tip regions.
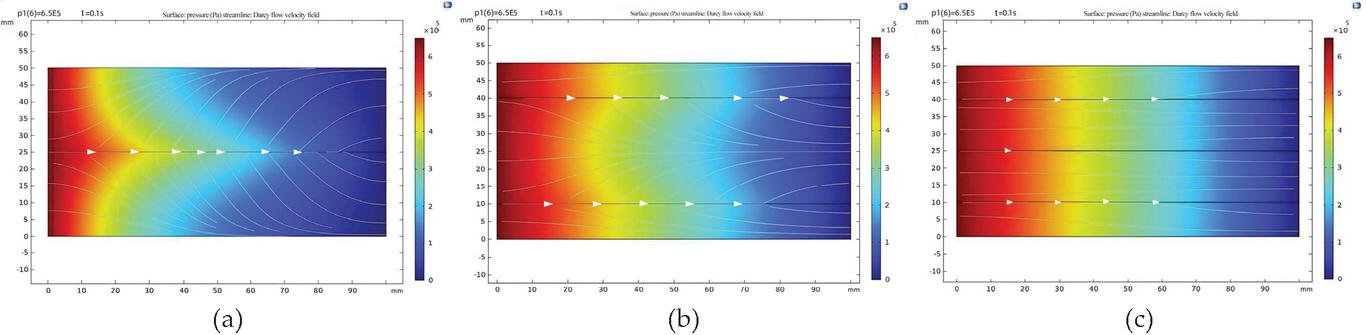
Figure 17 Fracture number coal seam gas pressure contour map: (a) one crack, (b) two cracks, (c) three cracks.
3.5.4 The impact of different numbers of fractures on gas seepage
As illustrated in Figure 17, under the condition of fixed inlet pressure, a distinct positive correlation exists between the number of coal fractures and the area of the high-pressure zone. The single-fracture sample presents the smallest high-pressure zone area. As the number of fractures increases from 1 to 3, the density of gas migration pathways in the fractured media rises correspondingly, thus promoting the gradual expansion of the high-pressure zone within the seepage domain. Meanwhile, the gas migration rate at the outlet shows an upward trend, while the growth rate of the migration rate exhibits a decreasing characteristic, which indicates a nonlinear correlation between fracture density and seepage velocity.
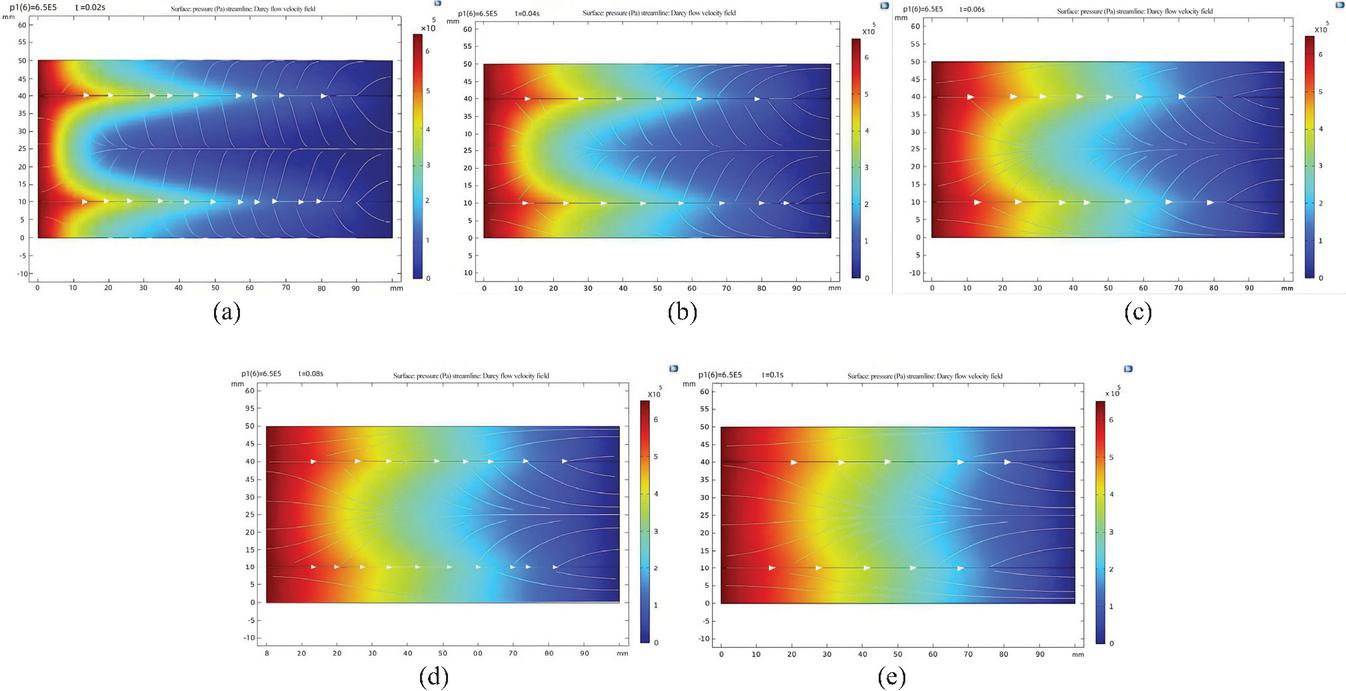
Figure 18 Coal seam time gas pressure contour map: (a) 0.02 s, (b) 0.04 s, (c) 0.06 s, (d) 0.08 s, (e) 0.10 s.
Research on the seepage field evolution characteristics of a double-fractured coal seam under an inlet pressure of 0.65 MPa indicates that the gas seepage velocity at the fracture channel’s exit section exhibits nonlinear growth within 0.02–0.1 s. Experimental data show the seepage velocity is 1.758 10-3 m/s at 0.02 s, rising to 2.461 10-3 m/s at 0.04 s, representing a 39.0% increase during this stage, which reflects significant unsteady-state seepage behavior. However, as time elapses, the seepage dynamic parameters display a notable convergence trend: the velocity reaches 2.730 10-3 m/s at 0.06 s (relative increase reduced to 11.0%), 2.960 10-3 m/s at 0.08 s (increase further narrowed to 9.0%), and 3.100 10-3 m/s at 0.1 s (only a 4.0% increase). The above analysis significantly characterizes the nonlinear correlation between the dynamic evolution of the pressure field and time during gas migration process in Figure 18.
In addition, numerical simulation under extreme working conditions was carried out: (1) Extreme stress condition: effective confining pressure of 12–15 MPa; (2) Extreme fracture condition: fracture width of 0.05–0.20 mm, fracture length of 10–120 mm. The results show that, under extremely high confining pressure, the permeability of fractured coal decreases exponentially, the non-Darcy coefficient increases significantly, and the nonlinear characteristics of seepage are more prominent. When the fracture width is less than 0.08 mm, the fracture is easy to close under stress, the seepage channel is blocked, and the seepage behavior gradually changes to linear Darcy flow. When the fracture length exceeds 100 mm, the through fracture forms a dominant seepage channel, and the inertial force effect is significantly enhanced.
4 Conclusions
This article is based on a three-axis self-balancing pore gas permeation system and conducts a three-axis mechanical permeation coupling test on prefabricated fractured coal samples. It analyzes the fragmentation evolution law of fractured coal samples under triaxial conditions and the influence of parameter changes on the non-Darcy permeation factor coefficients in the Forchheimer equation during the permeation test, revealing the nonlinear characteristics of fractured coal sample permeation. The following conclusions were obtained:
(1) In prefabricated fractured coal, the change from Darcy flow to nonlinear flow was confirmed. The applicability of the Forchheimer equation for characterizing nonlinear seepage in fissured coal was confirmed. The critical Forchheimer number for the flow regime transition is 0.11, which provides a quantitative criterion for judging the seepage type of fractured coal.
(2) For coal samples with distinct fracture areas, their stress-strain curves exhibit highly consistent variation characteristics. During the confining pressure loading stage, coal compaction is completed, leading to an indistinct boundary between the post-compaction and elastic deformation stages. AE ringing counts remain at a low level throughout the compaction and elastic stages. In contrast, a significant increase in AE activity is observed during the stress-strengthening stage, which reflects the progressive accumulation of internal damage. Notably, AE parameters exhibit a sharp response precisely at the peak intensity, indicating a critical transition in the material’s failure process.
(3) Fitting of the experimental data using the Forchheimer equation revealed significant nonlinear seepage behavior in fractured coal. Under equivalent pressure gradient increments, the observed fluid velocity increase was lower than the corresponding linear prediction. As effective confining pressure increased, fracture closure was enhanced, resulting in greater fluid flow resistance, reduced permeability K, and increased non-Darcy factor . Conversely, larger fracture areas were associated with higher permeability K and lower absolute value of , and the value became negative for the 50 cm2 through-fracture specimen due to the dominant channel effect.
(4) The geometric parameters of fractures (width, length, inclination angle, and quantity) are key factors affecting the permeability characteristics of fractured coal and gas. The width and number of cracks are positively correlated with the outlet flow velocity and are the main controlling factors for seepage efficiency; The increase in crack length leads to a decrease in pressure gradient at both ends of the crack, which has a suppressive effect on the seepage process; The exit velocity anisotropy of 15∘ inclined cracks is the most significant, and multi-crack systems have stronger dominant channel aggregation effects than single-crack systems. It is worth noting that research under extreme working conditions is worth exploring in depth. The total outlet flow velocity increases linearly with the number of cracks, and the growth rate of flow velocity decreases exponentially with time. This observed phenomenon is inherently related to the real-time dynamic adjustment of the pressure gradient in the seepage system and the inherent compressibility of the gas phase in the fracture network, providing a theoretical basis for predicting gas migration in engineering practice.
(5) This work develops two core research outcomes for fractured coal seepage characterization and engineering application. The first is a revised Forchheimer model that incorporates fracture surface roughness and damage evolution process. This model is capable of reliably capturing the non-Darcy seepage behavior of fractured coal masses under triaxial compression. The second is the “stress-fracture evolution-seepage channel variation” coupling mechanism clarified in this study. This mechanism offers a solid theoretical foundation for the layout optimization and parameter design of gas extraction boreholes in fractured coal seams.
Declarations and Statements
Author Contributions
Conceptualization, Y.L. and G.Z.; methodology, G.Z.; software, Y.L.; validation, Y.L. and G.Z.; formal analysis, Y.L. And G.Z.; investigation, Y.L.; resources, G.Z.; data curation, Y.L. and G.Z.; writing – original draft preparation, Y.L.; writing – review and editing, G.Z.; visualization, G.Z.; supervision, G.Z.; project administration, G.Z. All authors have read and agreed to the published version of the manuscript.
Funding
This research received no external funding.
Data Availability Statement
The raw data supporting the conclusions of this article will be made available by the authors on request.
Conflicts of Interest
The authors declare no conflicts of interest.
References
[1] Yin S, et al. Study on the influence of gas desorption characteristics of different coal bodies under hydraulic permeability enhancement. Appl. Sci, 2023, 13(21).
[2] Guo Y G H. Technology research of gas seepage law in coal seams, Shanxi Coal, 2023, 43(03): 45–53 [in Chinese].
[3] Feng L B L, et al. Experimental study on seepage-creep coupling of coal rock. Metal Mine, 2016, 08, 63–68.
[4] Chi Z. Study on the influence of different permeability on gas drainage effect by numerical simulation. Inner Mongolia Coal Economy, 2019(16): 62.
[5] Baoxin Z, et al. An experimental study on coal permeability enhancement by water freezing cycles without effects on produced gas compositions: Implications for enhancing coalbed methane production. Fuel, 2025, 390: 134666–134666.
[6] Wenhao S T, et al. Numerical modeling of non-Darcy flow behavior of groundwater outburst through fault using the Forchheimer equation. J. Hydrol. Eng. 2017, 23(2): 04017062–04017062.
[7] Junhui W. Mechanisms of fluid flow and heat transfer in fractured rock mass and its implications to heat control for geothermal anomaly mines. 2022 [in Chinese].
[8] Asteria L, et al. Applying the Forchheimer equation to model an artificially recharged fractured aquifer. Alex. Eng. J. 2020, 59(4): 2115–2130.
[9] Chang Z, et al. Pressure relief and zonal extraction and utilization of medium-thick coal seams with high gas content. Geomechanics Energy Environ 2025, 44: 100764.
[10] Ye L, et al. Experimental and numerical investigation of coal strain and permeability evolution during CO2-ECBM: Effects of injection pressure and confining pressure. Fuel, 2026, 412: 138068.
[11] Zhou G, et al. Effect of dual Gemini-based fracturing fluid on coal seam water injection seepage: Experiment and lattice Boltzmann method simulation. Powder Technology, 2026, 467: 121536.
[12] Mengqi S. Evolution of anisotropic coal rock permeability and its application in gas extraction simulation. 2023, Master, Henan Polytechnic University, Jiaozuo City, Henan Province [in Chinese].
[13] Yi S, et al. Research on permeability evolution law and gas outburst mechanism of coal near concealed fault. Energy, 2025, 318: 134950–134950.
[14] Jinbo Z, et al. Study on pore structure of tectonically deformed coals by carbon dioxide adsorption and nitrogen adsorption methods. Energies, 2025, 18(4): 887–887.
[15] Penghua H, et al. Response properties of geometries of coal penetrating fracture on seepage behavior. Int. J. Min. Sci. Technol, 2025, 35(2): 191–211.
[16] Dingyi H, et al. Experimental study on characteristics of gas seepage in broken coal and rock. Energy Sci. Eng. 2024, 12(10): 4737–4752.
[17] Zhang X G, et al. Gas transportation and enhanced coalbed methane recovery processes in deep coal seams: A review. Energy & Fuels, 2016, 30(11): 8832–8849.
[18] Zhang Z, et al. Influence of contact characteristics on nonlinear flow and eddy development in three-dimensional fractures under normal stress. Bull. Eng. Geol. Environ. 2024, 83(4).
[19] Wang X, Zhang L. Experimental study on permeability evolution of deep coal considering temperature. Sustainability. 2022, 14(22): 14923–14923.
[20] Weimin C, et al. Non-linear seepage characteristics and influential factors of water injection in gassy seams. Exp. Therm. Fluid Sci. 2018, 91: 41–53.
[21] Yan L. Study on gas transport laws of fractured coal sample heating injection to promote desorption. Master, Liaoning Technical University, Liaoning Province, 2023 [in Chinese].
[22] Wang J H W, et al. Effects of stress and temperature on the permeability of gas-saturated wet coal. Energy Fuels. 2020, 34(11): 14535–14547.
[23] Dianrui M, et al. A gas-mechanical-damage coupling model based on the TLF-SPH method and its application to gas seepage in fractured coal. Computers and Geotechnics, 2024, 171: 106352.
[24] Li G, Jiang M. Numerical investigation on the suffusion of the methane hydrate-bearing sediments under different methane hydrate saturations and environmental conditions using CFD-DEM. Granular Matter, 2026, 28(2).
[25] Zhuo R, et al. A COMSOL simulation of fracture-stress-seepage coupling during extremely thick coal seam mining. Eng. Fract. Mech. 2025, 326: 111407.
[26] Lu C, et al. Secondary fractal evolution mechanism of coal seam fractures and seepage under mechanical cavitation disturbance: Implications for CBM extraction. Fuel, 2026, 416: 138494.
[27] Wang Y, et al. Difference in gas migration between coal particle and coal seam: An insight into the gas diffusion models. Int. J. Heat Mass Transf. 2026, 257: 128234.
[28] Liu Z, et al. A new model for coal gas seepage based on fracture-pore fractal structure characteristics. Int. J. Rock Mech. Min. Sci. 2024, 173: 105626.
[29] Mo J, et al. Effect of cavity-shaped holes on the initiation and propagation of hydraulic fracturing cracks in coal seam: a numerical study. Comput. Part. Mech. 2025, 12(5): 2895–2914.
[30] Jia-Qing Z, et al. The friction factor in the Forchheimer equation for rock fractures. Rock Mech. Rock Eng. 2016, 49, 3055–3068.
[31] Zhenyu Z, Jan N. Fluid flow regimes and nonlinear flow characteristics in deformable rock fractures. J. Hydrol. 2013, 477, 139–151.
[32] Ordin A A, Timoshenko A M. Nonlinear relationships between coalbed methane release, natural methane content and kinematic parameters of cutting picks of shearers. J. Min. Sci. 2017, 53, 311–316.
[33] Zengguang X L, et al. Research progress on non-Darcy seepage characteristics of soil and rock masses. Chin. J. Appl. Mech. 2024, 41, 1211–1236.
[34] Guangming Z, et al. Dynamic mechanical response and failure characteristics of sandstone under dynamic load cycle. J. Min. Strata Control Eng. 2025, 7, 22–37 [in Chinese].
[35] Changlin L, et al. Comparative experimental study of ash formation behaviors during the fixed-bed gasification of coal water slurry and dry pulverized coal prepared from Shenmu coal. Fuel, 2024, 377: 132762–132762.
[36] Xiaoyang G C, et al. Experimental research on leaf vein geometric characteristics of multibranch horizontal well for coalbed methane recovery. Energy Sci. Eng. 2019, 7, 2921–2935.
[37] Dameng C, et al. Research on the reliability of wire web in diamond multi-wire saw slicing photovoltaic monocrystalline silicon wafer. Sol. Energy Mater. Sol. Cells 2025, 279, 113247–113247.
[38] Changwei X, et al. Numerical simulation of the dynamic wetting of coal dust by spray droplets. Energy, 2023, 270.
[39] Yayuan H, Chao W. Exploration of effective stress mechanics mechanism based on deformation work. J. Zhejiang Univ. Eng. Sci. 2019, 53, 925–931.
[40] Xiaowei L, et al. Heat-dependent properties of methane diffusion in coal: an experimental study and mechanistic analysis. Environ. Sci. Pollut. Res. 2024, 1–21.
[41] Zi J H, et al. Study on the strength characteristics of sandstone subjected to coupled static and dynamic loads from the perspective of microscopic crack propagation. Geomech Geophys Geo Energy Ge Resour. 2025, 11, 21–21.
[42] Zhi G. Study on mechanical properties and gas seepage law of prefabricated fractured coal. Master, Taiyuan University of Technology, Shanxi Province, 2023 [in Chinese].
[43] Jinjin G, et al. Analysis on characteristics and mechanism for rock fracture in deep rock with cracks under dynamic-static coupling effect. Sci Rep. 2024, 14, 31840–31840.
[44] Yao C, et al. Effects of non-darcy flow on heat-flow coupling process in complex fractured rock masses. J. Nat. Gas Sci. Eng. 2020, 83, 1875–5100.
[45] Xiang-Sheng C, et al. Theoretical research on gas seepage in the formations surrounding bedded gas storage salt cavern. Pet. Sci 2022, 19, 1766–1778.
[46] Meng W, et al. Pre-stack nonlinear direct exact inversion of fracture parameters in deep shale reservoirs. Processes. 2025, 13(2): 426–426.
[47] Saucao C, et al. A fully-mixed formulation for the steady double-diffusive convection system based upon Brinkman–Forchheimer equations. J. Sci. Compu. 2020, 85, 0885–7474.
[48] Shen S, et al. Experimental study on the permeability of methane hydrate-bearing sediments during triaxial loading. J. Nat. Gas Sci. Eng. 2020, 82, 1875–5100.
[49] Xueqi L. The influence of fracture geometry characteristics on non-Darcy flow and solute transport in fractures. 2023. Master, Hefei University of Technology, Anhui Province, 2023 [in Chinese].
[50] Caucao S, et al. A posteriori error analysis of a mixed finite element method for the stationary convective Brinkman–Forchheimer problem. Appl Numer Math. 2025, 211, 158–178.
[51] Upton K, et al. Modelling boreholes in complex heterogeneous aquifers. Environ Modell Softw 2019, 118, 48–60.
[52] Ali H G, et al. Darcy-Forchheimer flow with viscoelastic Cattaneo-Christov heat flux model and nonlinear thermal radiation: A numerical investigation. Case Stud Therm Eng. 2024, 53, 103908.
Biographies

Yuguang Li was born in Shandong province, China, in 1999. From 2017 to 2021, he studied in Shandong University of Science and Technology and received the bachelor’s degree of Engineering. Currently, he is pursuing research at the School of Safety Science and Engineering, Anhui University of Science and Technology. He majored in gas control theory and dynamic disaster prevention and control.

Guangming Zhao was born in Anhui province, China, in 1976. From 1994 to 1998, he studied Mining Engineering Department of Huainan Institute of Technology with a bachelor’s degree. He graduated from Southwest Jiaotong University with a Ph.D. in Solid Mechanics in 2006. Currently, he works as a professor and doctoral supervisor at Anhui University of Science and Technology and has published over 100 high-quality papers. His research interests include tunnel support technology and theory, mine pressure and control, and coal mine safety technology.
European Journal of Computational Mechanics, Vol. 34_5, 387–426
doi: 10.13052/ejcm2642-2085.3451
© 2026 River Publishers