Vibration Based Damage Detection in Plate-like Structure Using Square of Mode Shape Curvature
Lanka Ramesh1,2* and Putti Srinivasa Rao3
1 Research Scholar, Department of Mechanical Engineering, Andhra University, Visakhapatnam, Andhra Pradesh-530003, India
2 Department of Mechanical Engineering, Gudlavalleru Engineering College, Gudlavalleru, Krishna (Dt.), Andhra Pradesh-521356, India
3Department of Mechanical Engineering, Andhra University, Visakhapatnam Andhra Pradesh-530003, India
E-mail: lramesh007@yahoo.com; s-putti@rediff.com
* Corresponding Author
Received 23 August 2019; Accepted 03 September 2019;
Publication 16 September 2019
Abstract
In this current work, a new methodology based on the square of mode shape curvature (SMSC) is presented that relates the mode shapes and its curvature changes before and after the damage for localization and sizing of the surface crack in plate type structures. The significance of this method is it has the capability to portray accurate shape and exact location of the surface crack in a plate like structures which are related to low and high elastic modes on dense and coarse measurement grids. The efficiency of the proposed SMSC is examined using experimental and numerical data acquired from modal analysis on aluminium plate containing single and multi-surface cracks with a fixed- free conditions using non-contact measurement a scanning laser vibrometer and on simple finite element plate model. As an evidence of experimental and numerical study results, highly accurate crack characterization has been attained through the proposed method. In implementing this method, only a few modes of the structure are required. Further, the impact of the mode order on the effectiveness of crack detection, boundary distortion treatment, and grid density analysis was also performed by the proposed method.
Keywords: Mode shape curvature, damage identification, modal analysis, plate-like structure, polytech laser vibrometer.
1 Introduction
Structural health monitoring (SHM) and the development of vibration-based damage detection and location techniques (VBDDLT) have attracted considerable attention in civil, mechanical, and aerospace engineering applications for many years. The fundamental impression behind VBDDLT is the existence of damage that would alter the local and dynamic properties of the structure, which diminish modal frequencies and change the structure’s mode shapes. These properties are therefore intuitive to notice the existence of damage and its location as well as the quantification of structural damage. Doebling et al. (1998); Farrar et al. (1996); Fan and Qiao (2011); Yan et al. (2007) presented a comprehensive literature review on damage detection and structural health monitoring based on model parameters was summarized and published. From past literature it was clear that a lot of work has been carried out on damage identification from modal parameters. But, regrettably, most of these methods rely on modes and its curvatures. Pandey et al. (1991, 1994) suggested that the mode shape and its curvature of the deflected structure could be a better indicator of damage, when compared to change in the frequencies and elastic modes. Cawley and Adams (1979) used the same technique for detecting the damage location in two- dimensional composite structures based on frequency shifts in different modes. Shi et al. (1998, 2000) presented a modal strain energy-based method to locate and quantify the damage level in structures. The proposed method was successfully applied in a single-bay and two-storey portal steel frame structure and also presented truncation of analytical mode shapes.
Cornwell et al. (1997, 1998) derived damage identification method for beam and plate-like structure. The sub-regional strain energy of the healthy state of a plate-like structure and the unhealthy state of a plate-like structure are used in their approach to define a damage index. Kim and Ryu (2003) proposed a methodology to locate and estimate the damage size in structures using modal frequencies and mode shapes of damaged and undamaged structures. Rucevskis et al. (2009) proposed a damage detection method based on mode shape information obtained from the damaged state of the structure only. Zhong and Yang; Wu and Law (2004, 2016) suggested a gap-smoothing function to identify the location and extent of damage in the beam structure by using higher-order polynomials and mode shape curves. Barbieri et al. (2015); Xu et al. (2017) proposed a potential damage indication method to identify the accurate location of the damage in a steel beam and plate-like structures using a mean and Gaussian curvature mode shape and bispectrum theory based on the energy of operational mode shapes associated with low and high displacement modes on a dense and coarse grid.
Recently many researchers have attempted to identify the location of the surface crack in beam and aluminium alloy 6061 thin, carbon/epoxy laminated plate-like structure using the modal strain energy method with unidirectional fiber orientation and effect of resolution based damage index and density of measured grid points of mode shapes Hu et al. (2006); Hu and Wu (2008). Rao and Ratnam (2012) proposed of damage identification method in welded structures by observing residual errors obtained using the autoregressive model and Shewhart charts from acceleration time response data and exponentially weighted average control charts. Rucevskis et al. (2015, 2016) proposed damage detection method based on mode shape curvatures in plate-like structures requiring mode shape data only from damaged structures. Atef et al. (2015) proposed a node residual force the vector-based numerical technique to locate and estimate the degree of damage elements. Effectiveness of the method is investigated by the module of MatLab. He et al. (2018) proposed new damage localization method for beam-like structures by using mode shape data extracted from moving the vehicle response function. Janeliukstis et al. (2017) presented a continuous wavelet transforms technique and mode shape curvature method. Autoregressive is also used to identify damage in two carbon/epoxy composite beams with impact damage of different severities. Dahak et al. (2018) presented a new damage structural damage identification method using frequency contour lines, obtained from various damaged conditions. Yang and Oyadiji (2017) proposed potential damage indicator and estimator to detect and evaluate the internal surface cracks by designing the multiple orthogonal wavelet coefficients and treated the boundary effects by using biharmonic spline interpolation. Pedram et al. (2017) developed frequency domain-based damage detection method for the damage identification of plate and shells using power spectral density function. Jung et al. (2018) proposed the three-stage algorithm using a vector support machine based on several statistical parameters of the damaged and undamaged noise correlation function. Liu et al. (2016) presented a compact rectangular phase piezoelectric transducer array-based damage detection method for plate-like structure damage detection. Manoach (2018) developed a Poincare map damage detection method for beams and rectangular plates based on force response of the beam. The efficiency of the method is demonstrated by numerical analysis and concluded that the new method is very efficient and accurate in damage detection.
The objective of this study is to overcome the inaccuracy and high calculation efforts of previous works. In this research, a square of mode shape curvature method (SMSC) has been proposed to localizing and sizing of a single and multi-surface crack in the aluminum plate-like structure. The principle advantage of the methodology proposed is that it is designed to accurately characterize the location and size of the crack in structures. The Finite Element Analysis (FEA) was performed to simulate the first eight mode shapes. The accuracy of the proposed methodology in surface crack characterization has been validated by an experimental data acquired by a noncontact measurement (scanning laser vibrometer with impact hammer). One of the main advantages of the Laser vibrometer is that it prevents mass loading of the test object, resulting in more accurate results than using traditional contact vibration sensors such as accelerometers, which can change resonance frequencies and damping values. The second advantage is the possibility to record the response of individual locations or at many locations in rather simple since it is not necessary to install a transducer on every measured point and structures of nearly any size can be studied. The applicability of the proposed method also studied on mode shapes of a low and high elastic mode on different density measurement grids by both numerical and experimental techniques. Further, boundary distortion treatment and multi-damage analysis are demonstrated.
2 Damage Index Based on Mode Shape and its Curvatures
With the fact of reference, the presence of damage in structure often causes a reduction of stiffness in one or more elements of a structure and with changes system modal parameters (natural frequencies, mode shapes, damping, etc.), but not a loss in the mass. Hence, any significant change of modal parameters is regarded as a significant damage indicator. Therefore, in recent years, various techniques on modal parameters were effectively used to identify the existence and area of the damage location in structures. In most cases, the existence of the damage in structural can be identified through the modal frequency change itself, while ascertaining the area of the damage location of structural requires information regarding the vibrational modes, which are more sensitive compared to frequency change. Hence, in this research, the square of mode shape curvature is treated as a damage indicator to identify the location and size of single and multi-cracks in the plate structure.
2.1 Damage Estimation Based on Modal-parameter
2.1.1 Damage index of mode shape (MS)
The one, which is sensitive to damage is the displacement mode shape; it is defined as the transverse displacement of a vibrational structure for particular resonant frequency. This ensures that any local damage can change mode shapes. Ho and Ewins (2000) reported that the absolute difference between mode shapes of both healthy and damaged structures could be used as a significant indicator for damage identification. The simplest damage index is the mode shape-based damage index.
| (1) |
Where and are transverse displacements of jth measured grid or node in ith slice of kth mode shape of the damaged and intact structure.
2.1.2 Damage index of mode shape slope (MSS)
Slope of mode shape represents the first derivative of displacement mode. The damage index based on change in the mode shape slope can be represented as
| (2) |
Here
| (3) |
| (4) |
Equations (3) and (4) represent the slope of a measured grid or node in healthy and damaged structures, which can be formulated using the central difference approximation along x and y directions. Where, l is the distance between two successive measured grid points or nodes (length of the element).
2.1.3 Damage index of derivatives of mode shape (DMS)
According to Maia et al. (2003) when only mode shapes are being used for identification of defects in the structure, it may happen that some of them may not show any significant change when damage is near the node. An alternative to overcome this problem is second derivative of mode shapes such as curvature are extensively used for damage detection in structures, which are more sensitive to damage compared to mode shapes. Pandey et al. (1991) suggested that the absolute difference between intact and damaged structure mode derivatives can be treated as a significant damage indicator for the identification of structural defects. Derivatives of mode shapes can be obtained from the displacement mode shape of the structure through the central finite difference method. Then, Derivative of mode shape-based Damage Index (DBDI) can be defined as.
| (5) |
Here
| (6) |
| (7) |
Equations (6) and (7) represent the second derivative of a measured grid or node of kth mode of healthy and damaged structures, which can be calculated along x and y directions. Where, l is the distance between two successive measured grid points or nodes (length of the element).
3 The Proposed Damage Indicator for Plate Structures
Different authors have used the aforementioned methods to predict the presence of damage and its location in the structure. Generally, all above mode shape and derivatives of mode shape such as curvature-based method are originally formulated to identify the damage in a structure that is characterized by one-dimensional beam-like structures. Apropos of the points discussed earlier, the proposed structural damage detection technique based SMSC formulated to accurately predict the location and size of the crack in the twodimensional plate-like structure. In this method, normalization of mode shapes is not necessary as it requires only a few structural mode shapes before and after damage.
Step 1: Calculating mode shapes of plate structure
First, the finite element analysis is considered to extract structural response data i.e. modal frequencies and corresponding mode shapes of intact and damaged actual 16 × 16 grid plate structure. Resulting this, a two-dimensional transverse displacement matrices are obtained for corresponding to kth mode shape of damaged and intact plate structure as shown in Equations (8) and (9).
| (8) |
| (9) |
Where, and are transverse displacements of jth (j = 1,2,n) measured grid or node in ith (i = 1,2,...,N) slice of kth mode shape of the plate as shown in Figure 1, whereas, “h” and “d” denote for intact and damaged structures, respectively.
Step 2: Generating mode shape curvatures
Then, with two-dimensional transverse displacement matrices, mode shape curvature at (i,j’)th measured grid or node corresponding to kth mode of healthy and damage can be calculated using the central finite difference approximation. The resulting equations for mode shape curvature are presented in Equations (10) and (11).
| (10) |
| (11) |
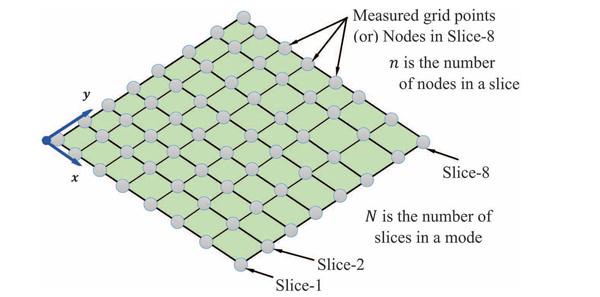
Figure 1 Basic square plate with nodal displacement for kth mode.
Where, l is distance between two adjacent grid points or nodes (length of the element) along x and y directions, respectively.
Step 3: SMSC based damage index
Then, Square of Mode Shape Curvature (SMSC) based damage indices are computed along x and y directions with the help of Equations (10) and (11). Damage index can be defined as the absolute difference between the square of mode shape curvature damaged and undamaged plate structure either x or y directions.
| (12) |
4 Mode Shapes by Numerical Analysis
A Finite Element Analysis is accomplished to simulate the square aluminium plate structure, by using a commercially available ANSYS15.0 software. Linear eight-node structural solid element is adopted for the modeling of a thin square plate under the consideration of dimensions 300 × 300 × 3 mm3 with fixed-free boundary conditions. Finite element study is performed to obtain mesh modal by plate divided equally into 15 × 15 elements so that the meshed plate model has 225 elements. In the present study, the damage is simulated as surface crack with 60 mm length, 0.5 mm width and 0.33 mm depth by separating nodes along the length of the crack as shown in Figure 2. Material properties of aluminium alloy 6061 plates as follows: Young’s Modulus E = 69 GPa, Density = 2735 kg/m3 and Poisson’s ratio = 0.33 are used in numerical analysis.
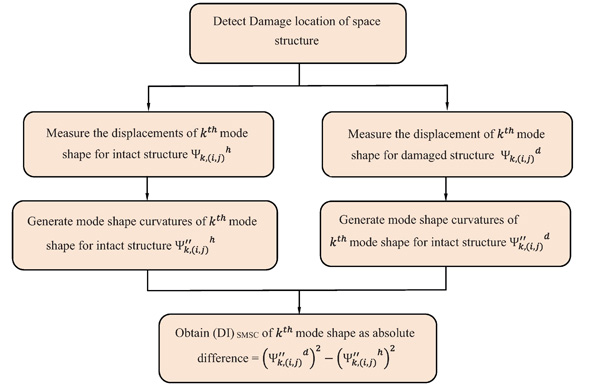
Figure 2 Flowchart of the proposed SMSC algorithm.
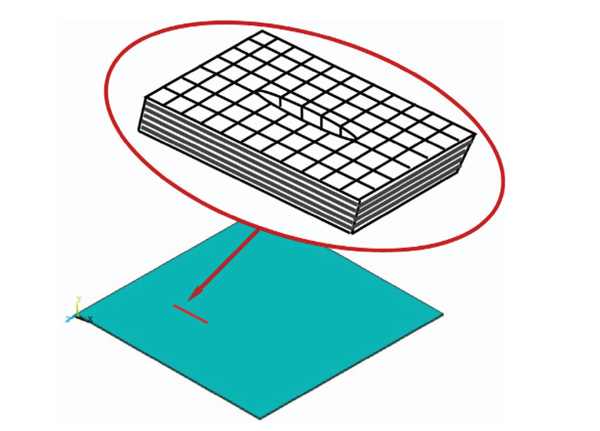
Figure 3 Simulated surface crack in mesh.
Numerical the model analysis is carried out to generate different sets of simulated data for first eight measured natural frequencies and corresponding displacement mode shapes of the plate with grid size 16x16 to indicate damage location, quantification to compare with experiment results. Also, 30 × 30 and 60 × 60 grids are simulated to investigate the effect the grid density towards the damage.
5 Experimental Investigation
The experimental analysis on the aluminium plate was carried out using the Laser Doppler Vibrometer to measure modal frequencies and mode shapes of the plate and to evaluate the effectiveness of the proposed damage identification method in plate-like structures and to validate the numerical model analysis. The general experimental set-up consists of 3-D Polytec PDV-100 optical scanning head with a wide frequency range 0 to 22 kHz, highly sensitive vibrometer sensor (OFV-550), VIB-E-220 junction box, OFV-5000 Modular Vibrometer controller, and a computer system with VibSoft-20 data acquisition and analysis software. Here, cantilever plate 300 × 300 × 3 mm3 cross-section was clamped at a vibrating table. The surface of the plate has been cleaned and prepared for consistency before the experimental study. The plate-structure is uniformly divided into slices along x and y directions with each slice 15 divisions as shown in Figure 4(a). Then the plate is excited by a dynamic pulse, which is load applied at each grid point on plate structure with a modally tuned hammer (PCB 652B10) of frequency 2 kHz and 3-D Polytec PDV-100 scanning system was used to scan the entire structure. The response measurements are made using a pulse generated data acquisition system to extract the frequency-response functions (FRF). Once frequency response and modal frequencies are achieved, then the plate is continuously excited and the laser head measures its response at a fixed point. When the measurement is completed at one point, the exciter moves to another point of the scan grid unit all grid points are covered. The first eight mode shapes are measured by taking the Fast Fourier Transform of the response signal. Subsequently, single open surface cracks are deemed on the plate at 80 mm from the left end of the plate by Electro Discharge Machine.

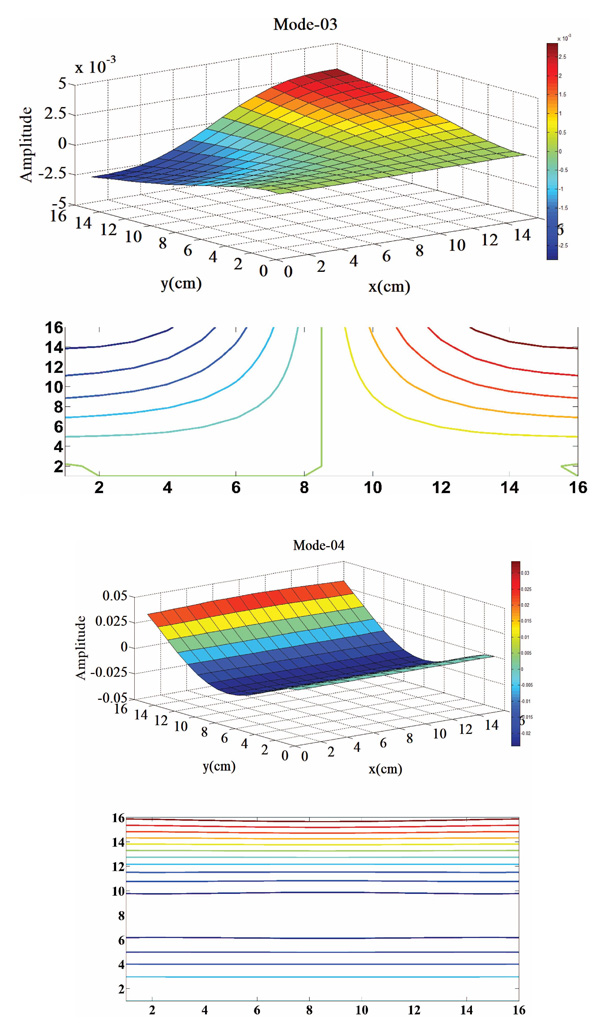
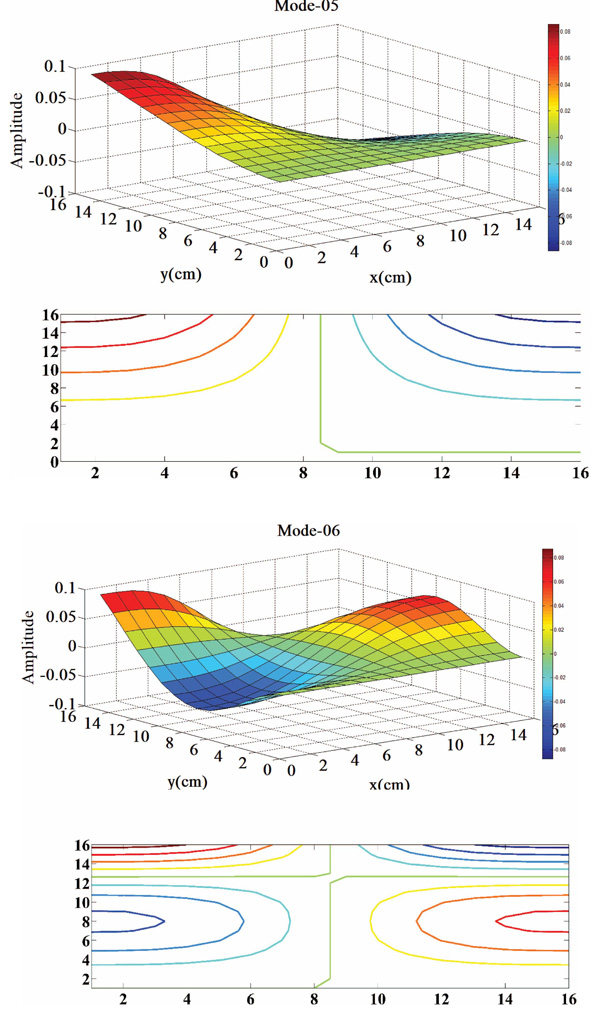
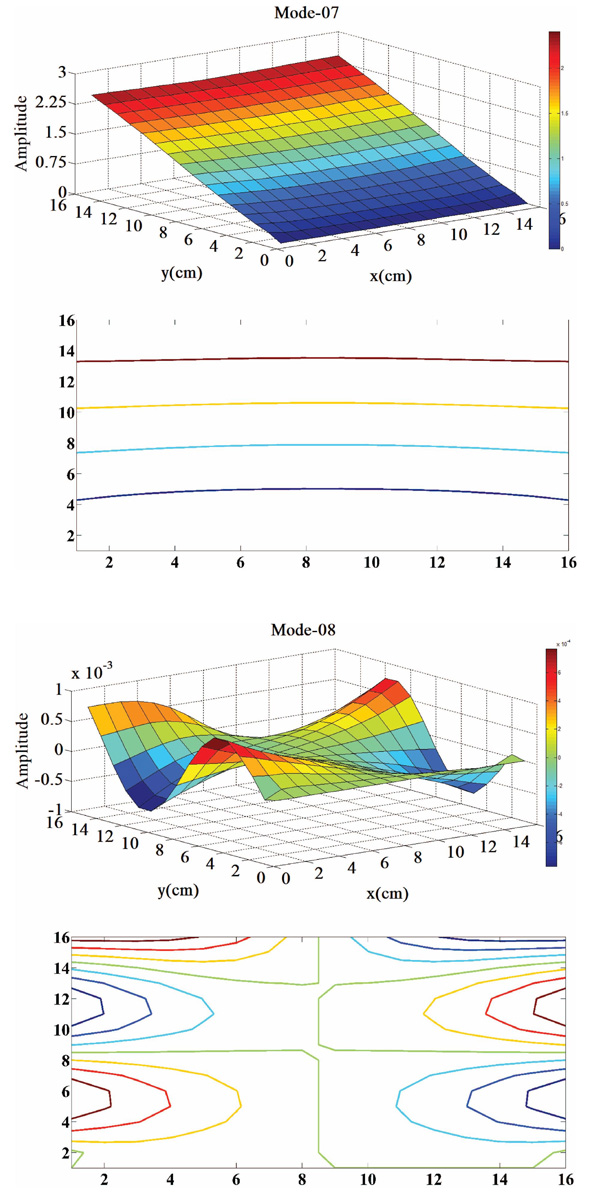
Figure 4 Modal frequencies and operational modes of plate structure.
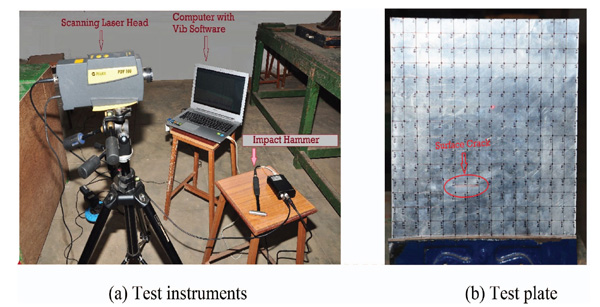
Figure 5 Experiment set-up (a) Test plate (b) Test instruments.
Table 1 Natural frequencies and residuals for test plate
| Before Damage | After Damage | |||||
| Mode Shape | UiFEA | UiEMA | Ai (%) | UiFEA | UiEMA | Ai (%) |
| 1 | 111.94 | 112.50 | 0.53 | 112.00 | 114.63 | 2.33 |
| 2 | 121.23 | 123.00 | 1.46 | 121.38 | 123.11 | 1.41 |
| 3 | 705.02 | 706.52 | 0.21 | 706.08 | 707.24 | 0.15 |
| 4 | 715.76 | 717.28 | 0.21 | 716.92 | 718.61 | 0.22 |
| 5 | 730.21 | 735.93 | 0.77 | 731.41 | 737.02 | 0.77 |
| 6 | 1036.21 | 1041.57 | 0.51 | 1038.31 | 1046.20 | 0.76 |
| 7 | 1755.00 | 1762.98 | 0.44 | 1755.00 | 1768.83 | 0.78 |
| 8 | 1997.10 | 2023.39 | 1.31 | 1997.96 | 2026.47 | 1.43 |
6 Results and Discussion
6.1 FE Model Validation with Modal Assurance Criterion
To validate the numerical model analysis, mode shapes are extracted from finite element analysis (FEA) and compared with experimental modes by using Modal Assurance Criterion (MAC), which is one of the most effective tools to determine the similarity of two displacement mode shapes in terms of vector form. The modal assurance criterion is defined as a scalar constant relating to the degree of consistency (linearity) between a modal and a modal vector of reference. The MAC values are determined as normalized scalar products of two sets of vectors and . The MAC matrix is formulated here with following definition Randall (2003), as:
| (13) |
Where and represents the mode shape matrices of given mode obtained from the numerical and experimental modal analysis respectively. In general, the modal assurance criterion take values zero to one, if MAC takes near-zero representing no consistent correspondence between two mode shapes and if the values of MAC are less than 0.5, it represents poor correlation and values larger than 0.9 indicates good consistent correspondence. The MAC values of the first eight measured modes of the plate before and after damage are given in the Tables 2 and 3. Conrrently, one of the best understandable ways to present MAC data in the least space is, using a 2D or 3D plot as shown in Figure 6. The values at the diagonal indicating that similarity between FEA and EMA mode shapes. It is observed that values at the diagonal are greater than 0.9 indicates that good correlation between FEA and EMA mode shapes. Based on MAC validated approach it can be concluded that numerical analysis could be used to simulate the aluminium plate before and after damage and evaluate the effectiveness of the proposed damage detection approach.
Table 2 Numerical presentation of MAC values (before damage)
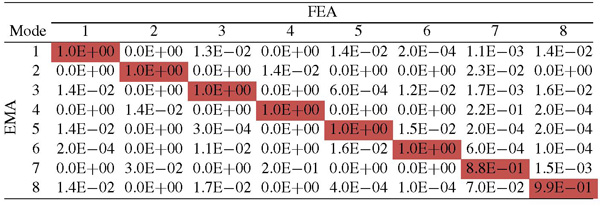
Table 3 Numerical presentation of MAC values (after damage)
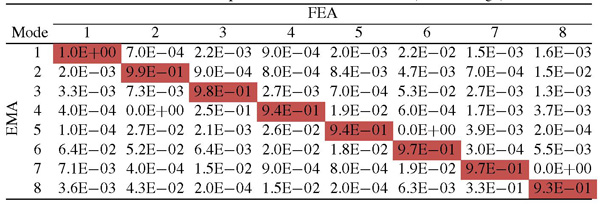
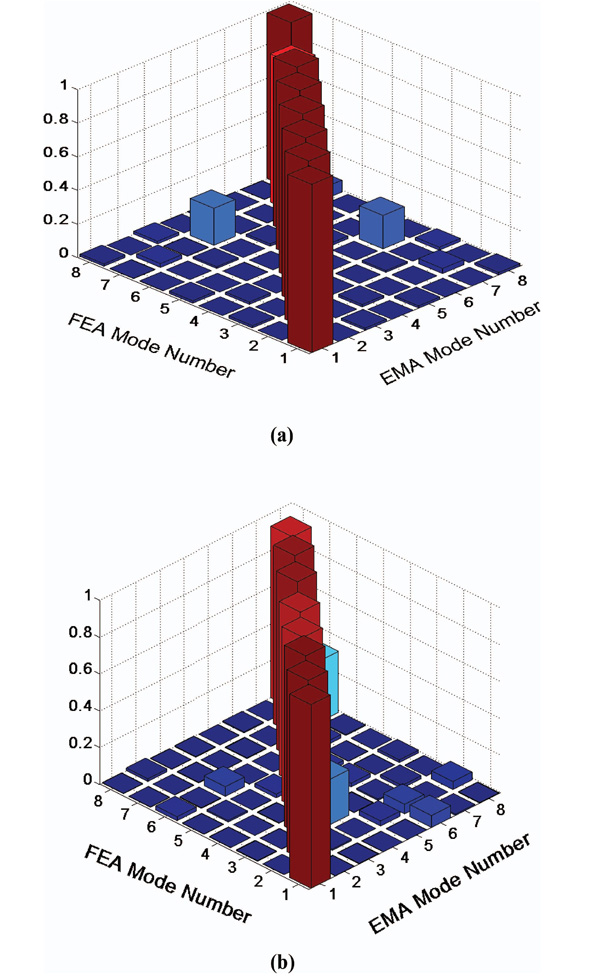
Figure 6 3-D presentation of MAC values: (a) Before the damage, (b) After the damage.
6.2 Damage Identification Procedure
6.2.1 Damage location diagnostic
A clamped-free (CF) aluminium plate is considered to demonstrate the viability of the proposed method. First, measured mode shapes of the plate before damage and after damage are adopted to compute the proposed approach; first eight mode and shapes of the intact structure are given in Figure 4. In fact, compared to change in natural frequencies and associated mode shapes their second-order differential terms of mode shapes such as curvatures are more sensitive to the damage (Salawu and Williams, 1994). Thus, the idea of the proposed method is to enhance the sensitivity of mode shape to the damage; mode shape derivatives such as curvature and its curvature square are investigated as promising damage identification features in the current work. Hu et al. (2008) observed that damage existence in the structure leads to a loss of stiffness around the local area of damage. Eventually, this leads to change in the magnitude of the mode shape curvature and its square, and change in strain energy of local area are directly associated with the stiffness of the structure. Hence, SMSC may be considered as an indicator for ascertaining the damage location and quantification. Further, sensitiveness of higher modes and the effect of grid density towards damage and identification of multi-crack locations are also investigated.
The proposed method described in Section 3 is also employed to identify the location and severity of damage for a few mode shapes obtained by numerical analysis. The results presented in Figures 7, 8 and 9 show that among the eight modes, mode one, five and seven are precisely locate the location of damage and its severity in the plate by showing the largest peak value at the location of the damage, which illustrate that the proposed damage identification method can effectively locate damage as shown in Figures 7(a), 8(a) and 9(a). Subsequently, the effectiveness of the proposed method is further evaluated using mode shape information obtained from a set of vibration experimental data; it can be seen from Figures 7(b), 8(b) and 9(b), that the presented method is able to find the exact location of the damage. However, some peaks observed beyond at other than damage area.
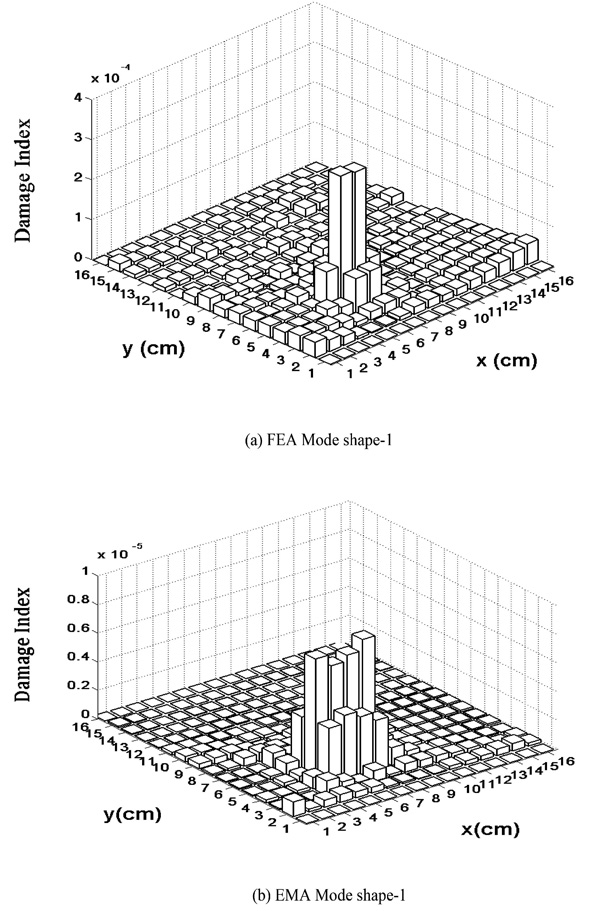
Figure 7 Damage index from 1st mode shape (16 × 16 × 3 mesh grid).
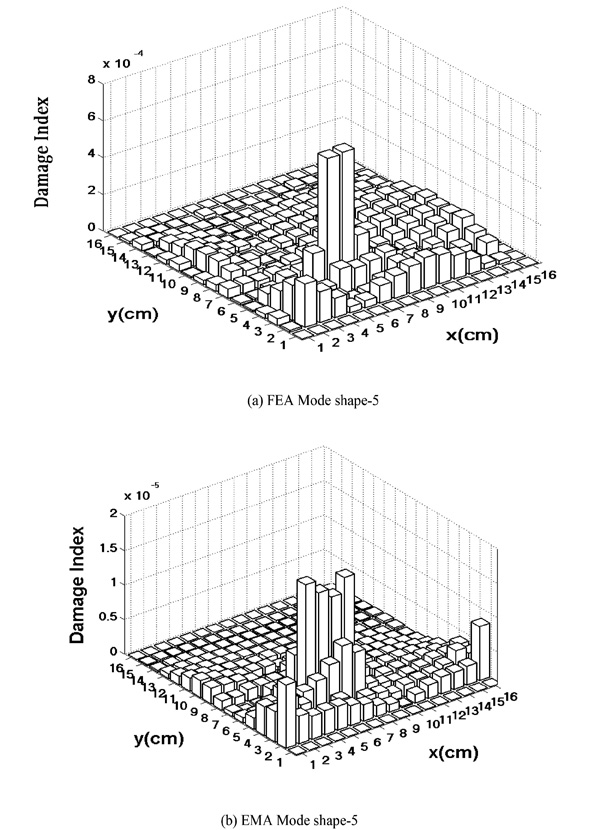
Figure 8 Damage index from 5th mode shape (16 × 16 × 3 mesh grid).
This could be explained by the fixed-free (FF) boundary conditions used in the experiment, which results in maximum deflection at the boundaries and therefore, subsequently, leads to maximum measurement noise at the boundaries.
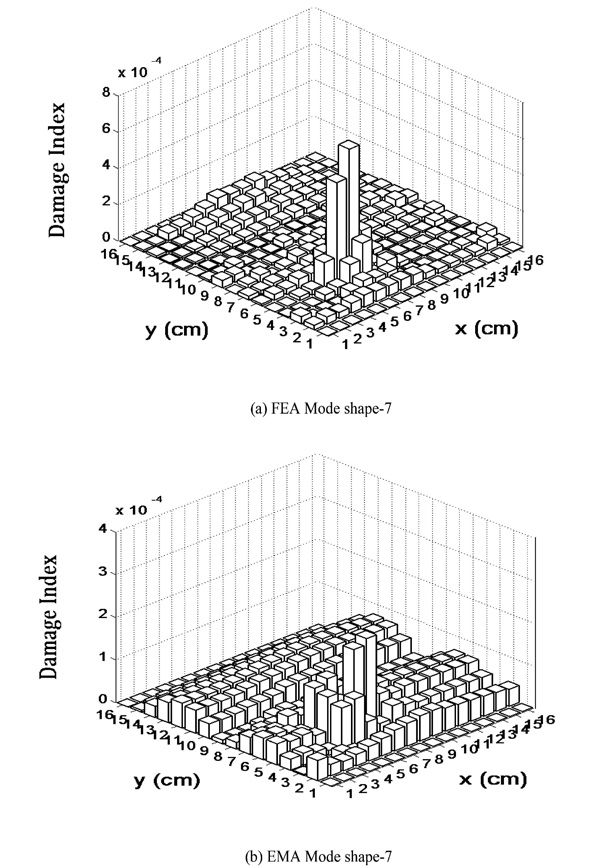
Figure 9 Damage index from 7th mode shape (16 × 16 × 3 mesh grid).
6.2.2 Higher mode analysis
At the same time, an attempt has been made to examine the effect of higher modes on the damage. For those three different modes such as one, five and seven, which damage-severity values are estimated at the peak locations i.e. Figures 7, 8 and 9 show that damage indices for FEA and EMA. These three different mode shape damage indices are listed in Table 4. It has been reported that the peak of damage index is higher with increase mode order, which represents that higher modes are much affected by the loss of stiffness at the local area of the damage.
Table 4 Damage indices of three mode shapes from FEA and EMA
| Mode No. | Damage Indices from FEA | Damage Indices from EMA |
| 1 | 4 × 10⁻⁴ | 1 × 10⁻⁵ |
| 2 | 8 × 10⁻⁴ | 2 × 10⁻⁵ |
| 3 | 1 × 10⁻³ | 4 × 10⁻⁴ |
6.2.3 Boundary Distortion Treatment and Resolution Analysis
According to the results obtained from experiment and the corresponding simulated mode shapes by the Equation (13) for an original grid size of 16 × 16, peak values at damage location are good enough to indicate the damage location as shown in Figures 8 and 9. However, in both cases, some strong non-zero values are identified even beyond the damaged area. It can be seen that there are large values that appear at the boundaries of the plate and some smaller peaks are present at other areas of the plate where no damage has been introduced. This is happening due to the boundary distortion problem, which causes discontinuity of mode shapes at their ends. In some instances, those strong non-zero values will mislead false detection of damage. To overcome the boundary distortion problem, there are few commonly used methods to alleviate the boundary effect (Fan and Qiao, 2009). One is to extend the mode shape data beyond the original boundary by the cubic spline extrapolation based on the points near the boundaries. Second, simply to ignore those values near the boundaries by cutting them off or setting them to zero (Rucevskis et al., 2016). In this proposed analysis, boundary distortion and noise effects are treated by calculating the absolute difference between damage indices derived from healthy and damaged structure.
The concept of truncation is used to deal with the problem of other small non-zero values. Cornwell et al. (1997) suggested that peak values greater than the magnitude of two are associated with exact damage locations, others could be truncated or setting them to zero. Figures 10 and 11 show that damage indices before and after truncating the peak values less than two, the detection outcome becomes more visible than that of before truncation.
Hu et al. (2008) suggested that the mesh grid of the structure would affect the visibility of the exact location of the damage. It has been observed that the resolution of damage indices at the damage location is significantly increased when finer meshes were used. Thus, 30 × 30 × 3 and 60 × 60 × 3 meshes are employed in FEA and EMA. Figures 12 and 13 showing the damage indices are obtained by the finer mesh model is good enough to give the precise location of damage and helped to portray the exact shape of damage.
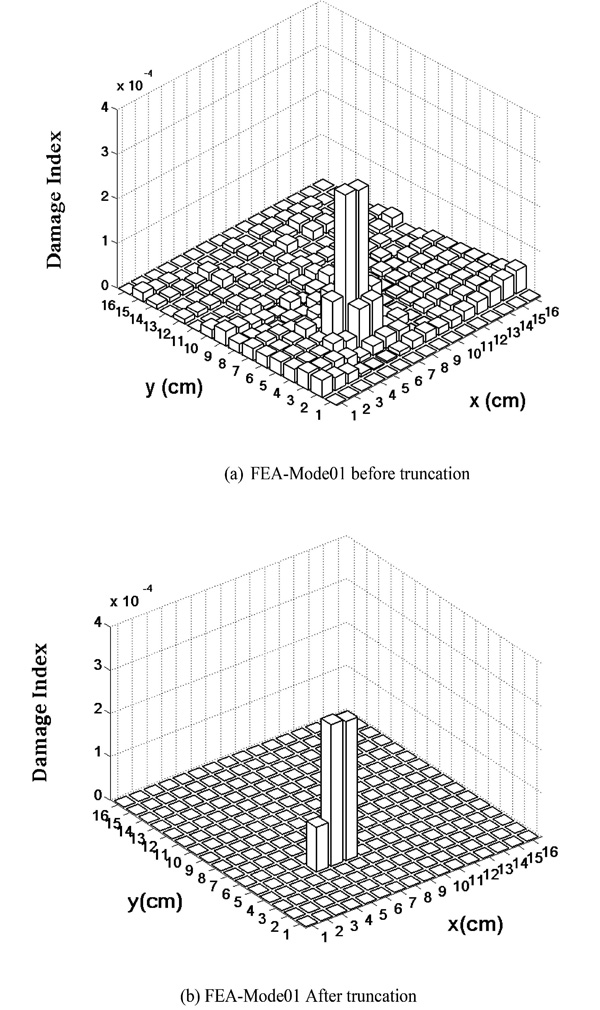
Figure 10 Damage index from 1st mode shape (16 × 16 × 3 mesh grid).
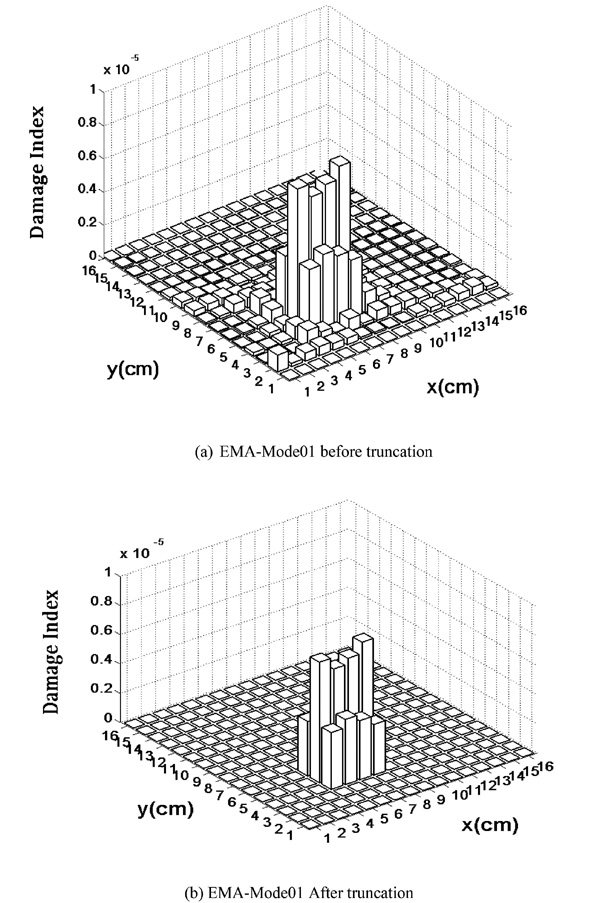
Figure 11 Damage index from 1st mode shape (16 × 16 × 3 mesh grid).
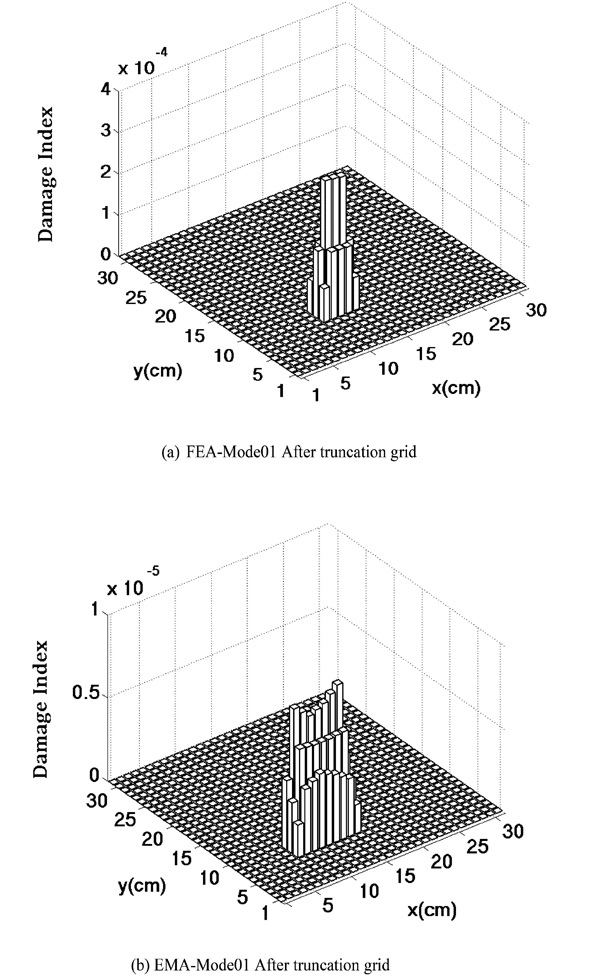
Figure 12 Damage index from 1st mode shape (30 × 30 × 3 mesh grid).
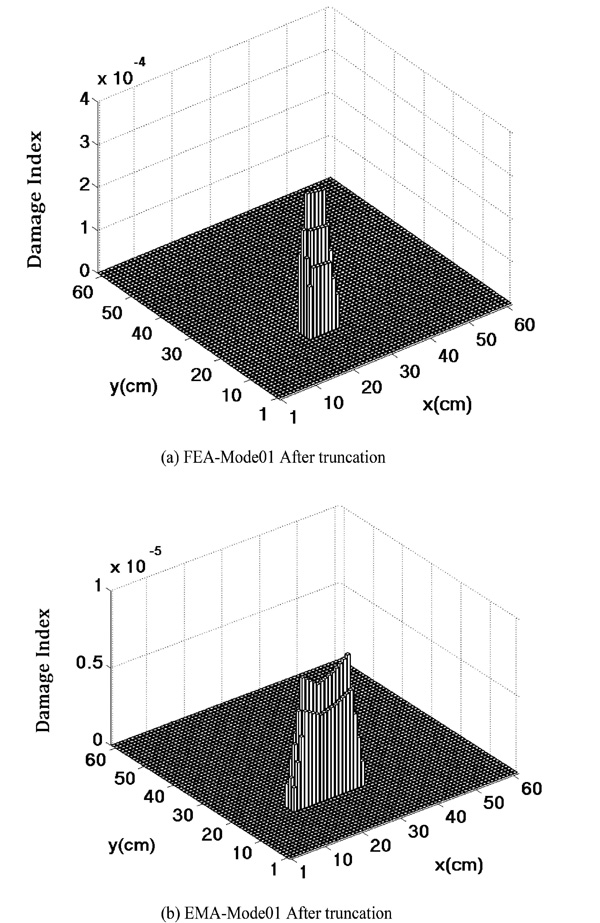
Figure 13 Damage index from 1st mode shape (60 × 60 × 3 mesh grid).
6.2.4 Identification of multiple damages
In this section, the proposed method employed to locate the multi crack locations with the damage indexes were obtained via finite element model analysis. Figures 14 and 15 indicate the location of single and multi-surface cracks is simulated by separation of nodes at the location of the damage. From Figure 16, it can be seen that the proposed method is also able to identify damage location in multi-damage locations. However, Figure 16 depicts that exact location of damage almost invisible by considering only lower modes of structure and in higher modes such as mode 5 and mode 7 location of damage becomes more visible than in mode 1 as shown in Figures 17 and 18. Hence, it is concluded that higher modes more sensitive towards the damage compared to lower modes.
It has been observed that the resolution of damage indices at the damage location is significantly increased when finer meshes were used as in case of single crack. Thus, 30 × 30 × 3 and 60 × 60 × 3 meshes are employed in FEA and EMA. Figures 19 and 20 showing the damage indices are obtained by the finer mesh model is good enough to give the precise location of damage and helped to portray the exact shape of damage.

Figure 14 Position of single surface crack.
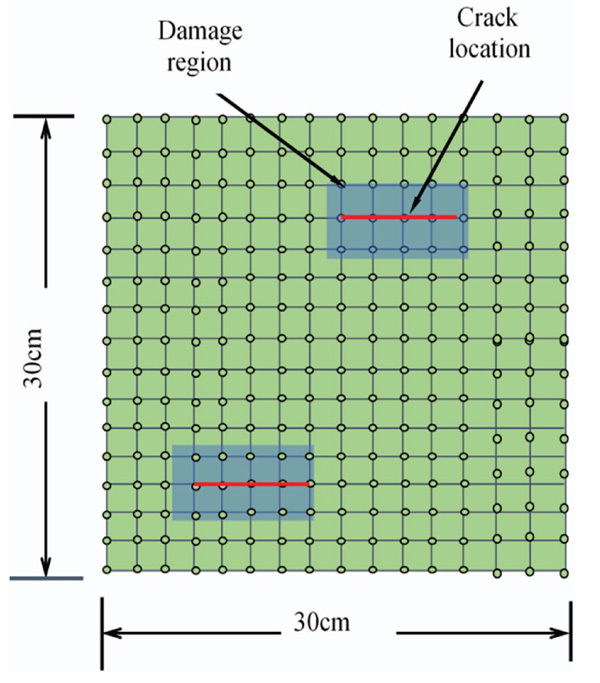
Figure 15 Position of double surface crack.
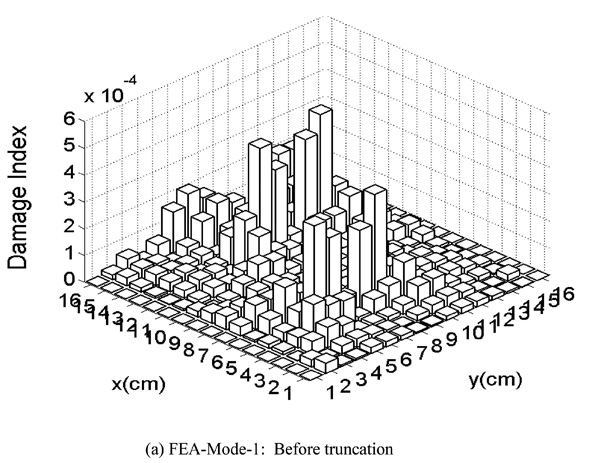
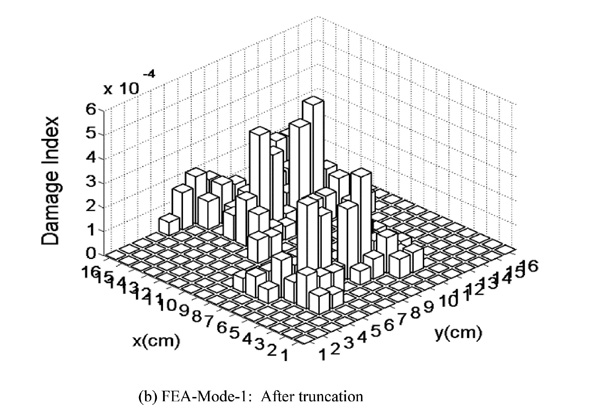
Figure 16 Multi-crack damage index from 1st mode shape (16 × 16 × 3 mesh grid).
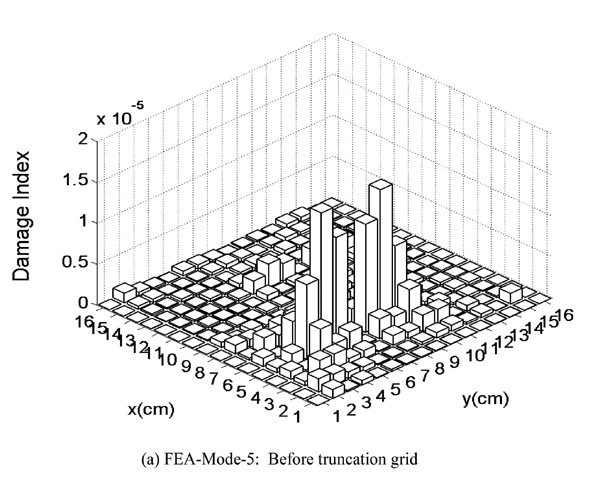
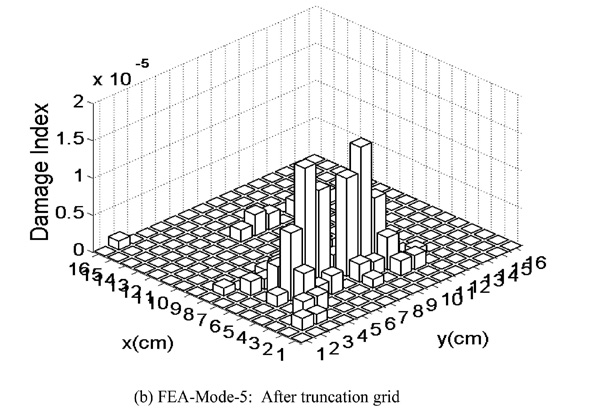
Figure 17 Multi-crack damage index from 5th mode shape (16 × 16 × 3 mesh grid).
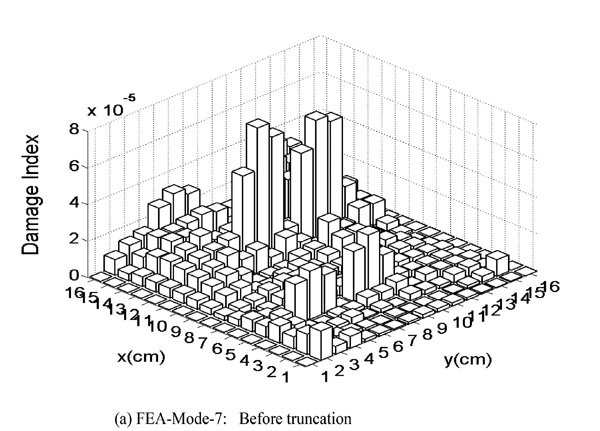
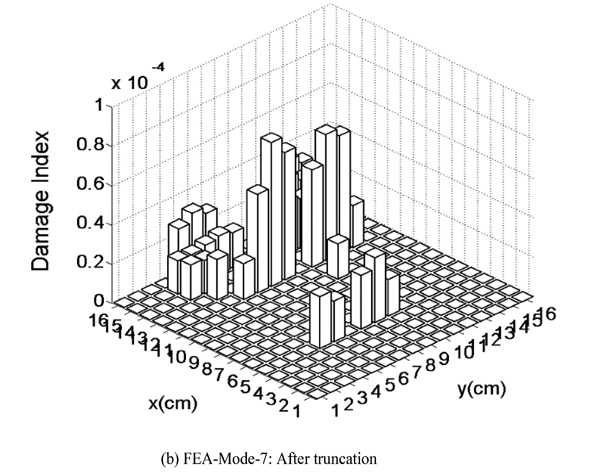
Figure 18 Multi-crack damage index from 7th mode shape (16 × 16 × 3 mesh grid).
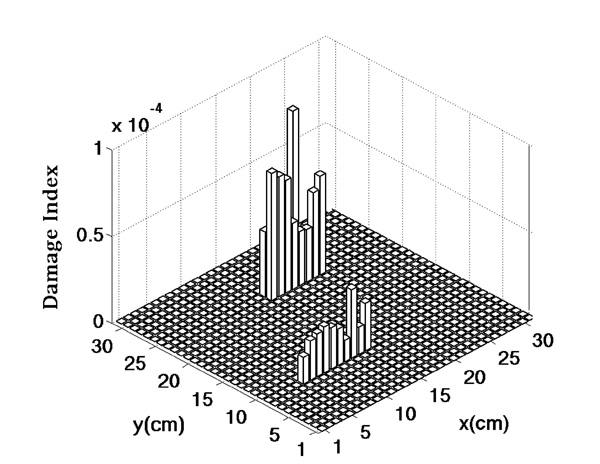
Figure 19 Multi crack Damage index from FEA-1st mode (30 × 30 × 3 mesh grid).
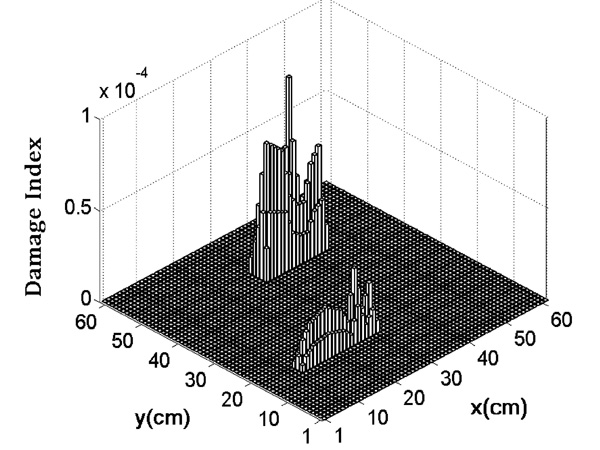
Figure 20 Multi crack Damage index from FEA -1st mode (60 × 60 × 3 mesh grid).
7 Conclusion
In this current work, an effective damage-detection method based on SMSC has been presented to depict accurate location and size of cracks in plate-like structures. The superiority of the designed algorithm is that it has the capability to identify the damages from mode shapes, which are associated with low and high density. It could depict the accurate location and size of cracks and this methodology is simple and easy to use. In order to assess efficiency and robustness of the proposed method, it was applied to an experimental model analysis data of a plate with damage in the form of single and multi-surface cracks. EMA results show that surface crack location and size in the plate like structures are successfully identified by using a proposed method such as SMSC, but some peaks are identified in the region of undamaged location because of distortion of damage indices by the boundary conditions and mode shape data obtained from experimental model analysis may be corrupted by the noise. Nevertheless, it will not diminish the effectiveness of the proposed method, if damage indices are obtained as the absolute difference between data from intact and damaged structure. Truncated or setting damage indices to zero, whose magnitude is less than two. Generally, the test equipment limits the density of measured points, this problem can be overcome by using the latest scanning laser vibrometer system that has the capability to record the response of high-density structures. A reliable numerical model was also developed and validated with experimental results for further analysis. Furthermore, grid density analysis and sensitivity of higher mode towards the damage were carried out; the investigations show that the measured points of mesh grid size, as well as the damage size significantly affects the resolution of damage location. In addition, it has been observed that higher modes are better damage indicator compared to lower modes. Based on this investigation, the proposed method is an efficient and more promising tool for damage identification of the single and multiple damages in plate-like structures.
Discloser Statement
No potential conflict of interest was reported by the authors.
References
Barbieri, N., Barbieric, R. and Silva, H. A. T. (2015). A methodology for identification of damage in beams. Inverse Problems in Science and Engineering, 124, 482-503.
Cawley, P. and Adams R. D. (1979). The location of defects in structure from measurements of natural frequencies. The Journal of Strain Analysis for Engineering Design, 14, 49-57.
Cornwell, P. J., Dobeling, S. W. and Farrar, C. R. (1997). Application of the Strain Energy Damage Detection Method to Plate-Like Structures. Proceedings of the 15th International Modal Analysis Conference, 1312-1318.
Cornwell, P. J., Dobeling, S. W. and Farrar, C. R. (1999). Application of the Strain Energy Damage Detection Method to Plate-Like Structures. Journal of Sound and Vibration, 224, 359-374.
Dahak, M., Touat, N. and Kharoubi, M. (2018). Damage detection in beam through change in measured frequency and undamaged curvature mode shape. Inverse Problems in Science and Engineering, 1-26.
Doebling, S. W., Farrar, C. R. and Prime, M. B. (1998). A Summary Review of Vibration-Based Damage Identification Methods. The Shock and Vibration Digest, 30, 91-105.
Doebling, S. W., Farrar, C. R., Prime, M. B. and Shevitz, D. W. (1996). Damage identification and health monitoring of structural and mechanical systems from changes in their vibration characteristics: A literature review. Los Alamos National Laboratory Rep.
Eraky, A., Saad, A., Anwar, A. M. and Abdo, A. (2015). Damage detection of plate-like structures based on residual force vector. HBRC Journal, 12, 255-262.
Fan, W. and Qiao, P. Z. (2011). Vibration-based damage identification methods: a review and comparative study. Structural Health Monitoring, 10, 83-111.
He, W.-Y., He, J. and Ren, W.-X. (2018). Damage localization of beam structures using mode shape extracted from moving vehicle response. Measurement, 121, 276-285.
Ho, Y. K. and Ewins, D. J. (2000). On structural damage identification with mode shapes. International conference on System Identification and Structural Health Monitoring, 677-686.
Hu, H., Wang, B. T., Lee, C. H. and Su, J. S. (2006). Damage detection of surface cracks in composite laminates using modal analysis and strain energy method. Composite Structure, 74, 399-405.
Hu, H.-W. and Wu. C. B. (2008). Non-destructive Damage Detection of Two Dimensional Plate Structures Using Modal Strain Energy Method. Journal of Mechanics, 24, 319-332.
Janeliukstis, R., Rucevskis, S., Wesolowski, M. and Chate, A. (2017). Experimental structural damage localization in beam structure using spatial continuous wavelet transform and mode shape curvature methods. Measurement, 102, 253-270.
Jung, S., Seong, W. and Lee, K. (2018). Damage detection on an aluminum plate from the cross-correlation of diffuse field using the support vector machine. Ocean Engineering, 161, 88-97.
Kim, J. and Ryu, Y. S. (2003). Damage identification in beam-type structures: frequency-based method vs mode-shape-based method. Engineering Structures, 25, 57-67.
Liu, Z., Sun, K., Song, G., He, C. and Wu, B. (2016). Damage localization in aluminum plate with compact rectangular phased piezoelectric transducer array. Mechanical Systems and Signal Processing, 70-71, 625-636.
Maia, N. M. M., Silva, J. M. M. andAlmas, E. A. M. (2003). Damage detection in structures: from mode Shape to frequency response function methods. Mechanical Systems and Signal Processing, 17, 489-498.
Manoach, E., Cao, M. and Doneva, S. (2018). Vibration based methods for damage detection of plates. AIP Conference Proceedings, 1922, 100014.
PandeyA. K., Biswas M. and Samman, M. M. (1991). Damage detection form changes in curvature mode shapes. Journal of Sound and Vibration, 145, 321-332.
Pandey, A. K. and Biswas, M. (1994). Damage detection in structure using change in flexibility. Journal of Sound and Vibration, 169, 3-17.
Pedram, M., Esfandiari, A. and Khedmati, M. R. (2017). Frequency domain damage detection of plate and shell structures by finite element model updating. Inverse Problems in Science and Engineering, 26(1), 100-132.
Randall J. A. (2003). The Modal Assurance Criterion-Twenty Years of Use and Abuse. Journal of Sound and Vibration.
Rao, P. S. and Ratnam, Ch. (2012). Health monitoring of welded structures using statistical process control. Mechanical Systems and Signal Pro-cessing, 27, 683-695.
Rucevskis, S., Janeliukstis, R., Akishin, P. and Chate, A. (2016). Mode shape-based damage detection in plate structure without baseline data. Structural Control and Health Monitoring, 23, 1180-1193.
Rucevskis, S., Sumbatyan, M. A.,Akishin, P. and Chate, A. (2015). Tikhonov’s regularization approach in mode shape curvature analysis applied to damage detection. Mechanics Research Communications, 65, 9-16.
Rucevskis, S., Wesolowski, M. and Chate, A. (2009). Vibration-based damage detection in a beam structure with multiple damage locations. Aviation, 13,61-71.
Salawu, O. S. and Williams, C. (1994). Damage location using vibration mode shapes. International Modal Analysis Conference, 933-939.
Shi, Z. Y., Law, S. S. and Zhang, L. M. (1998). Structural Damage Localization from Modal Strain Energy Change. Journal of Sound and Vibration, 218, 825-844.
Shi, Z. Y., Law, S. S., and Zhang, L. M. (2000). Structural Damage Detection from Modal Strain Energy Change. Journal of Engineering Mechanics, 126,1216-1223.
Wu, D. and Law, S. S. (2004). Damage localization in plate structures from uniform load surface curvature. Journal of Sound and Vibration, 276, 227-244.
Xu, F. Y., Zhu, W. D. and Smith, S. A. (2017). Non-model-based damage identification of plates using principal, mean and Gaussian curvature mode shapes. Journal of Sound and Vibration, 400, 626-659.
Yan, Y. J., Cheng, L., Wu, Z. Y. and Yam, L. H., (2007). Development in vibration-based structural damage detection technique. Mechanical Systems and Signal Processing, 21, 2198-2211.
Yang, C. and Oyadiji, S. O. (2017). Damage detection using modal frequency curve and squared residual wavelet coefficients-based damage indicator. Mechanical Systems and Signal Processing, 83, 385-405.
Zhong, H. and Yang, M. (2016). Damage detection for plate-like structures using generalized curvature mode shape method. Journal of Civil Structural and Health Monitoring, 6, 141-152.
Biographies

Lanka Ramesh is a Ph.D. student at Andhra University at Visakhapatnam, India since jan 2014. He graduated from Gandhi institute of technology and management, Visakhapatnam, India in May 2006 with bachelors of technology in Mechanical engineering. Lanka then went on to pursue a Master of technology in Machine Design from the National Institute of Technology, Rourkela, Odisha in 2008. He is also an assistant professor in Gudlavalleru Engineering College, Gudlavalleru, Andhra Pradesh. His research interests include vibration-based damage identification in structures and rotors.

Putti Srinivasa Rao received his Ph.D in machine design from Andhra University at Visakhapatnam, India; M. Tech degree in Machine Design from Jawaharlal Nehru Technological University Hyderabad, located in Hyderabad, Telangana, India and B. Tech degree in Mechanical Engineering from the Bangalore University, Bangalore, India. Dr. P. Srinivasa Rao is working as professor in Department of Mechanical Engineering in Andhra University at Visakhapatnam, India. His current interests are structural Health Monitoring and development of damage identification techniques. He is author or co-author of several scientific papers on international national journals.
European Journal of Computational Mechanics, Vol. 284, 269-306.
doi: 10.13052/ejcm1958-5829.2841
© 2019 River Publishers