Research on Hydro-pneumatic Suspension Test Bench Based on Electro-hydraulic Proportional Control
Xin Bai, Liqun Lu*, Meng Sun, Leilei Zhao and Hui Li
School of Transportation and Vehicle Engineering, Shandong University of Technology, Zibo 255000, China
E-mail: luliqun@sdut.edu.cn
*Corresponding Author
Received 29 March 2022; Accepted 26 May 2022; Publication 12 June 2023
Abstract
Compared with the traditional automotive suspension, hydro-pneumatic suspension has the characteristics of large energy storage ratio, nonlinear stiffness and can change the ground clearance of the vehicle body, which makes the vehicle have good ride comfort and handling stability during driving. In order to improve the performance of hydro-pneumatic suspension, it is necessary to design hydro-pneumatic suspension test bench for performance test. Aiming at the problem that the output signal of the mechanical test bench used in China is single and has large error, which is difficult to meet the performance test requirements of hydro-pneumatic suspension, a hydro-pneumatic suspension test bench based on electro-hydraulic proportional control is designed. Through AMESim/MATLAB joint system modeling and simulation, in the tracking comparison of sinusoidal signal, compared with the traditional PID control method, the fuzzy PID control method reduces the error by 56.8% and the lag time by 70%; Through the experimental analysis of hydro-pneumatic suspension elastic force characteristic diagram, indicator diagram and damping force velocity characteristic diagram, the error rate of the test bench in sinusoidal signal tracking experiment is less than 15%, which meets the test requirements of hydro-pneumatic suspension.
Keywords: Hydro-pneumatic suspension, electro-hydraulic proportional control system, fuzzy PID control, AMESim/Simulink, test bench.
1 Introduction
As a special suspension, hydro-pneumatic suspension combines the elastic element with the shock absorber, so it has good nonlinear characteristics and damping performance. Hydro-pneumatic suspension has the functions of balancing load, generating damping vibration and adjusting body height [1]. It can meet a variety of driving conditions and improve vehicle ride comfort and handling stability. Therefore, it is widely used in all kinds of heavy vehicles. In order to improve the performance of hydro-pneumatic suspension, it needs to be tested. Because the internal structure of hydro-pneumatic suspension is relatively complex, and many of its design theories are established on simplified mathematical models, its performance cannot be evaluated simply by simulation. It is necessary to verify its actual performance by test, and test the hydro-pneumatic suspension on the test bench.
The performance of the test bench has a great influence on the test results of hydro-pneumatic suspension. The research on suspension test abroad is relatively early, and its mainstream loading mode is hydraulic servo control. Since the end of last century, various test benches have been produced. Among them, MTS company in the United States, Schenck company in Germany and ABD company in the United Kingdom have begun to develop road simulation test bench and damping test bench. So far, they are still the leaders in this industry, and their road simulation technology is at the international leading level [2–5]. The domestic test bench has developed rapidly in recent years, and its loading methods have mainly experienced mechanical, electric test, electro-hydraulic servo, etc. [6]. The vertical loading test bench of hard point adjustable suspension designed by Chen Xinbo of Tongji University can realize the output of vertical excitation signals such as step, sinusoidal and integral white noise [7]. The State Key Laboratory of Jilin University has developed a set of K & C characteristic parameter test platform for single axle suspension of the whole vehicle [8], The loading mode adopted is the matching transmission of servo motor and ball screw. With the increasing requirements of suspension test bench, electro-hydraulic servo control, as an advanced control technology, gradually occupies a major position in suspension test equipment. However, the cost of servo control is too high for ordinary enterprises to bear, and servo control has high requirements for the cleanliness of oil medium, and there are many equipments in the factory, which will inevitably affect the cleanliness of oil and the normal operation of the system. The performance of the test bench has great influence on the test results of hydro-pneumatic suspension. Foreign test bench precision is high, but the price is high, small and medium-sized enterprises can not afford; But the domestic test bench output waveform is not accurate, large error and other shortcomings, these situations limit the development of China’s automobile industry. Therefore, it is necessary to design an acceptable price and fully functional test bed according to the nonlinear characteristics of hydro-pneumatic suspension, so as to more truly simulate the actual operating conditions of the car, and lay a better foundation for the development of a higher level of hydro-pneumatic suspension. Because the performance of electro-hydraulic proportional control technology meets the test requirements, the operation of its control system is relatively simple, and the cost of electro-hydraulic proportional control system is lower than servo control, and the requirement for oil cleanliness is low, which greatly reduces the system failure and makes the loading system more stable and reliable [9]. Therefore, the electro-hydraulic proportional control method is selected to complete the loading of the test system.
In this paper, the hydro-pneumatic suspension test bench is designed based on the electro-hydraulic control proportion, the schematic diagram of the hydraulic loading system is completed, and the electro-hydraulic proportional valve components required by the system are selected. The fuzzy control algorithm is added on the basis of the conventional PID control algorithm, and the fuzzy PID controller of the electro-hydraulic proportional system is established. The modeling and simulation of the AMESim/MATLAB joint system, the test rig construction and the characteristic analysis of the hydro-pneumatic suspension test are carried out. Through the modeling and simulation of the AMESim/MATLAB joint system, the error of the fuzzy PID control method is reduced by 56.8% compared with the traditional PID control method in sinusoidal signal tracking comparison. The lag time was reduced by 70%; Based on the analysis of elastic force characteristic diagram, indicator diagram and damping force velocity characteristic diagram of hydro-pneumatic suspension, the error rate of the test bench in sinusoidal signal tracking experiment is less than 15%, which meets the requirements of hydro-pneumatic suspension test, and verifies the correctness of the mathematical model and the feasibility of the test bench design.
2 Design of Hydro-pneumatic Suspension Test Bench Based on Electro-hydraulic Proportional Control
2.1 Structural Design of Test Bench
During the performance test of hydro-pneumatic suspension, when the hydro-pneumatic suspension is placed and installed, the hydraulic lock remains locked, and the upper and lower sliding blocks are connected and fixed. The actuating cylinder directly provides sinusoidal signal excitation for the hydro-pneumatic suspension, in which the force sensor completes the measurement of the output force of the hydro-pneumatic suspension, and the relative displacement between the actuating cylinder barrel and the piston rod is measured and recorded by the displacement sensor, and the displacement and output force are fitted to complete the displacement characteristic test of the hydro-pneumatic suspension; By deriving the displacement, the speed characteristic test of hydro-pneumatic suspension can be completed. The layout of the test bench is shown in Figure 1.
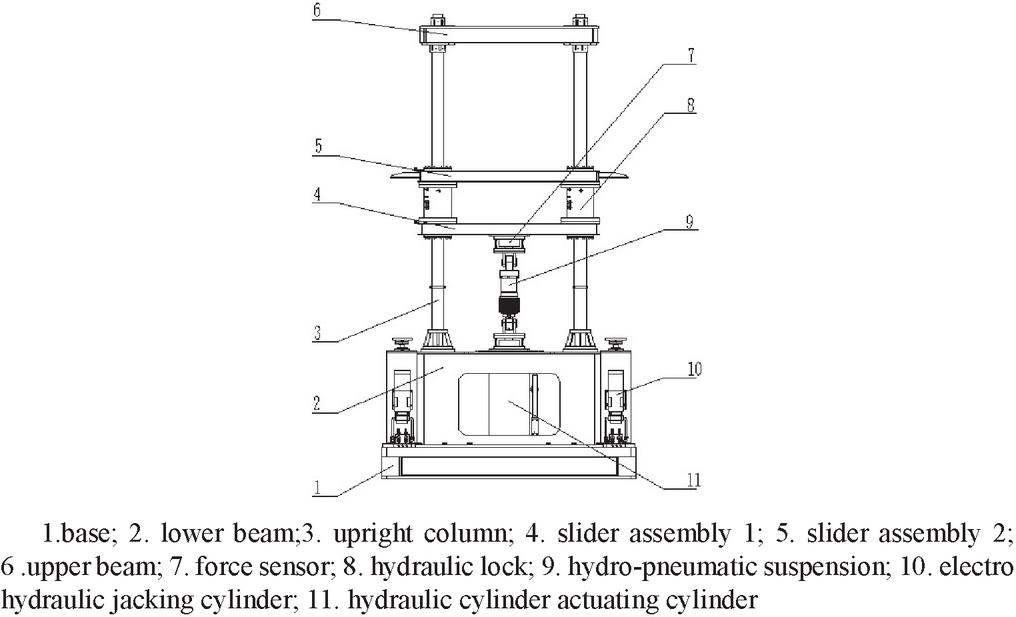
Figure 1 Hydro-pneumatic suspension performance test bench installation layout diagram.
During the 1/4 vehicle road simulation test, adjust the height of the slider assembly 1 to place the vehicle tire and suspension guide mechanism, and place the counterweight above the slider assembly 2 to simulate the vehicle mass. The hydro-pneumatic suspension is installed between the slider 1 and the slider 2. At this time, the hydraulic locking device is in a free state. The actuating cylinder drives the tire, hydro-pneumatic suspension and counterweight to vibrate at the same time. Through this arrangement, the actual operating conditions of the vehicle are simulated. The installation and layout of the test bench is shown in Figure 2.
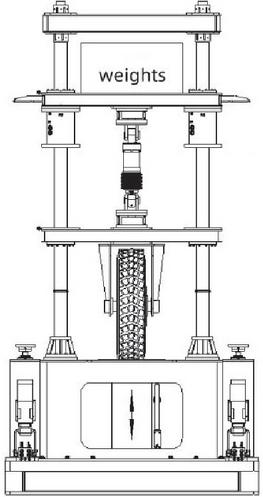
Figure 2 Schematic diagram of installation and layout of 1/4 vehicle road simulation test bench.
2.2 Working Principle of Hydraulic System
Through the analysis, it is found that the hydro-pneumatic suspension has nonlinear characteristics, and although the hydro-pneumatic suspension with regressive stiffness has been developed [10], the stiffness displacement of ordinary hydro-pneumatic suspension increases with the increase of displacement, and the change is nonlinear. When the input displacement of the suspension is less, the stiffness of the suspension increases relatively slowly; With the gradual increase of stroke, the growth rate of stiffness increases gradually. It is precisely because of this feature that vehicles equipped with hydro-pneumatic suspension maintain good ride comfort when driving on flat roads; When driving on poor roads, the vehicle can maintain a certain driving speed. By referring to the design scheme of hydro-pneumatic suspension test bench at home and abroad, the hydraulic system of the test bench is designed. The schematic diagram of the hydraulic system is shown in Figure 3.
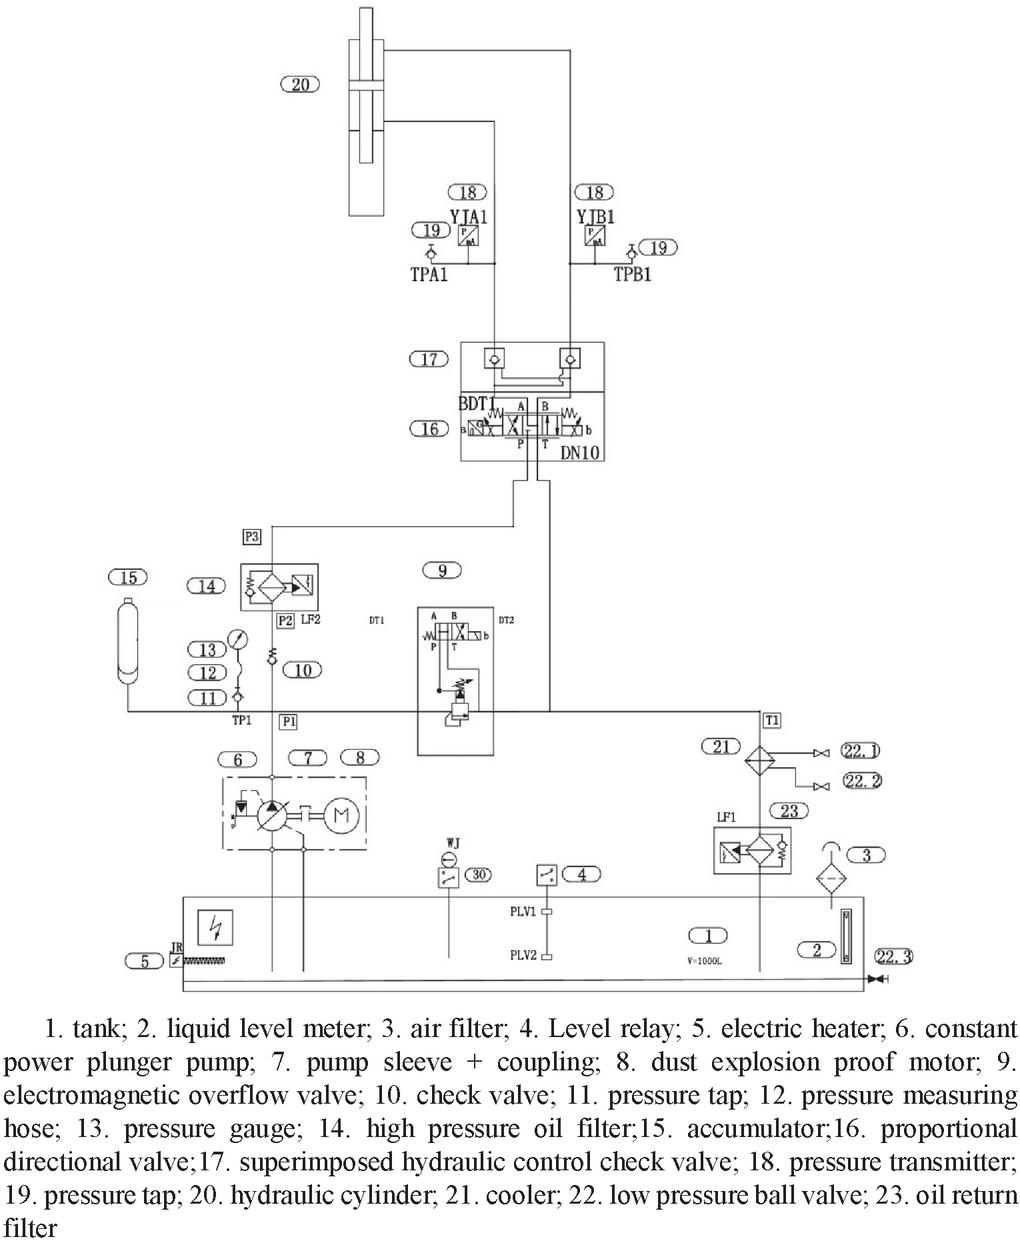
Figure 3 Schematic diagram of hydraulic excitation system.
2.3 Design and Selection of Key Parts
2.3.1 Selection of electro-hydraulic proportional valve
Because the electro-hydraulic proportional directional valve has the characteristics of strong anti pollution ability, high work efficiency, relatively low price, high control accuracy, and its performance is similar to that of the on-off valve. The comprehensive performance of proportional valve is no less than that of servo valve [11, 12]. Therefore, the electro-hydraulic proportional directional valve is selected to control the liquid flow and flow direction.
According to the design and calculation results of the hydraulic cylinder of the test bench, the maximum flow of the hydraulic cylinder is 60.2 L/min. Therefore, the flow of proportional valve is [13]:
| (1) |
Where, is the working flow of the proportional valve, L/min; is the maximum flow of hydraulic cylinder, L/min; is the pressure drop at the proportional valve port when the hydraulic cylinder is working, taken as 1 MPa; is the nominal pressure drop of proportional valve, taken as 0.9 mpa. (According to the selected proportional valve model, the pressure drop is evaluated. In this paper, the direct acting electro-hydraulic proportional valve manufactured by Rexroth company is selected, and its model is 4WREE10W-75-2X/G24K31/F1V).
According to the above formula, the working flow of the proportional valve is 64.2 l/min.
According to the flow, pressure and other information required by the hydraulic cylinder, the direct acting electro-hydraulic proportional directional valve produced by Rexroth company is selected, and its model is 4WREE10W-75-2X/G24K31/F1V. The median function of the valve is Y-shaped with a diameter of 10 mm. When the pressure drop of the valve is 10 bar, its rated flow is 75 L/min. The technical parameters are shown in Table 1.
Table 1 Electro-hydraulic proportional valve main parameters
| Summary | Parameter |
| Valve weight (kg) | 6.5 |
| Maximum working pressure (MPa) | 31.5 |
| Maximum flow (L/min) | 180 |
| Working ambient temperature (C) | 2050 |
| Repetition accuracy (VDC) | 24 |
| Current control signal (mA) | 420 |
| Drift diameter (mm) | 10 |
| Lag (%) | 0.1 |
| Response sensitivity (%) | 0.05 |
| Reverse error (%) | 0.05 |
Compared with the traditional electromagnetic directional valve, the electro-hydraulic proportional directional valve can take into account the control of oil flow direction and flow. Its working principle is: when the coils 5 and 6 are powered off, the control valve core 2 is maintained in the central position under the action of compression springs 3 and 4. When the coil 6 is powered on, the control valve core 2 will move to the left, while the spring 4 is in the tension state and the spring 3 is in the compression state, in which the displacement of the control valve core is proportional to the electrical input signal; On the contrary, when the coil 5 is powered on, the control valve core 2 will move to the right in proportion to the electrical signal. At this time, the spring 3 is in the tension state and the spring 4 is in the compression state. The schematic diagram of the valve is shown in Figure 4.
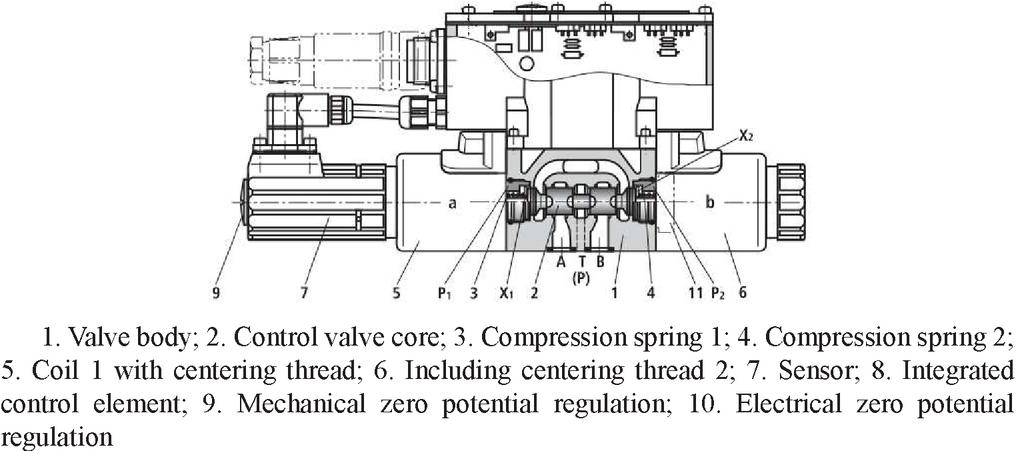
Figure 4 Electro-hydraulic proportional discharge valve.
The electro-hydraulic proportional directional valve has zero dead zone during actual operation. At this time, the proportional valve in the dead zone has no flow output, and the starting current of the dead zone is about one fifth of the rated current of the proportional valve. The causes of zero dead zone mainly include two aspects: one is that the valve core of electro-hydraulic proportional valve will cover the valve port when it is in the middle position, and the other is that the valve core will be affected by static friction during the initial movement. In order to solve the problem of zero dead zone, a compensation system is added to the control system to improve the dynamic performance of the proportional valve.
2.3.2 Fuzzy PID control principle
Fuzzy PID control algorithm has many forms. Its principle is: constantly detect the deviation E and deviation change rate EC of the system, according to the fuzzy relationship set by the system, modify the three key parameters of PID control online in real time: is proportional coefficient; is the integral time constant; is the differential time constant. In order to meet the requirements of PID control parameters in the case of different E and EC, the system has better dynamic performance. The structure diagram of the fuzzy PID self-tuning control system is shown in Figure 5.
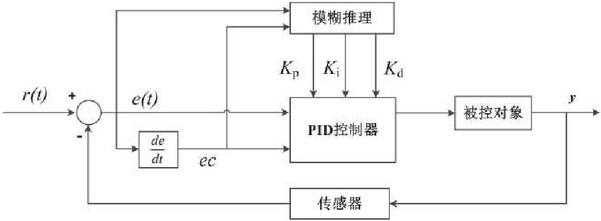
Figure 5 Fuzzy PID self-tuning control system.
The specific calculation formula of fuzzy PID parameter self-tuning algorithm is as follows:
| (2) |
Where, , and are the adjusted values of PID parameters, , and are the set initial values, and , and are the values obtained after adjustment.
2.3.3 Design of fuzzy PID controller for electro-hydraulic proportional control system
(1) Determination of the domain of input and output variables of control system The fuzzy universe of the input variables E and EC of the fuzzy PID control system is defined as , and the fuzzy universe of output variables is , the fuzzy universe of is , the fuzzy universe of is .
According to the operation characteristics of the hydro-pneumatic suspension test bench, the system is determined as seven fuzzy language values, and the English abbreviations of the fuzzy set can be expressed as {NB, NM, NS, ZO, PS, PM, PB}. Therefore, the set of E and EC fuzzy universe is , The fuzzy universe set of is , and the fuzzy universe set of is , the fuzzy universe set of is .
(2) Determination of membership function Considering the actual operating conditions of the system and the complexity of the function, the membership function of the system is determined as a triangular membership function with more sensitive response.
Although the fuzzy universe of each input and output of the system is different, the membership functions of each part are not different, so the membership functions of one input variable and two output variables are given. The membership function curve is shown in Figures 6 and 7.
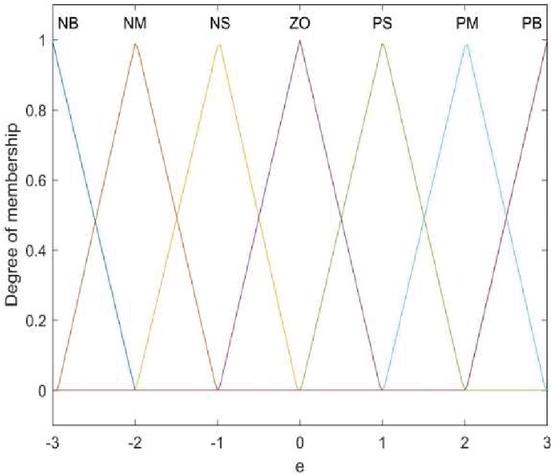
Figure 6 The membership function of E.
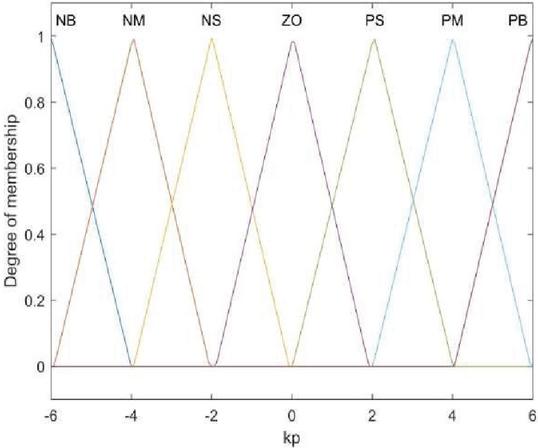
Figure 7 The membership function of .
(3) Fuzzy reasoning The fuzzy reasoning process of fuzzy PID control system is the output rule according to which , and are output when the system input E and EC are different combinations. According to the control effect of various parameters of PID algorithm on the system, combined with the actual working conditions of the hydro-pneumatic suspension test-bed controlled by electro-hydraulic proportion in this paper, the fuzzy rules of the control system are obtained, as shown in Tables 2, 3 and 4 [14, 15]. Import the 49 fuzzy rules obtained in Table 4 into the fuzzy rule editor of MATLAB software. As shown in Figure 8.
Table 2 Fuzzy rule adjustment table of
| EC | |||||||
| E | NB | NM | NS | ZO | PS | PM | PB |
| NB | PB | PB | PM | PM | PS | ZO | ZO |
| NM | PB | PB | PM | PS | PS | ZO | NS |
| NS | PM | PM | PM | PS | ZO | NS | NS |
| ZO | PM | PM | PS | ZO | NS | NM | NM |
| PS | PS | PS | ZO | NS | NS | NM | NM |
| PM | PS | ZO | NS | NM | NM | NM | NB |
| PB | ZO | ZO | NM | NM | NM | NB | NB |
Table 3 Fuzzy rule adjustment table of
| EC | |||||||
| E | NB | NM | NS | ZO | PS | PM | PB |
| NB | NB | NB | NM | NM | NS | ZO | ZO |
| NM | NB | NB | NM | NS | NS | ZO | ZO |
| NS | NB | NM | NS | NS | ZO | PS | PS |
| ZO | NM | NM | NS | ZO | PS | PM | PM |
| PS | NM | NS | ZO | PS | PS | PM | PB |
| PM | PM | ZO | PS | PS | PM | PB | PB |
| PB | ZO | ZO | PS | PM | PM | PB | PB |
Table 4 Fuzzy rule adjustment table of
| EC | |||||||
| E | NB | NM | NS | ZO | PS | PM | PB |
| NB | PS | NS | NB | NB | NB | NM | PS |
| NM | PS | NS | NB | NM | NM | NS | ZO |
| NS | ZO | NS | NM | NM | NS | NS | ZO |
| ZO | ZO | NS | NS | NS | NS | NS | ZO |
| PS | NS | NS | NS | ZO | PS | PS | PS |
| PM | ZO | ZO | ZO | ZO | ZO | ZO | ZO |
| PB | PB | NS | PS | PS | PS | PS | PM |
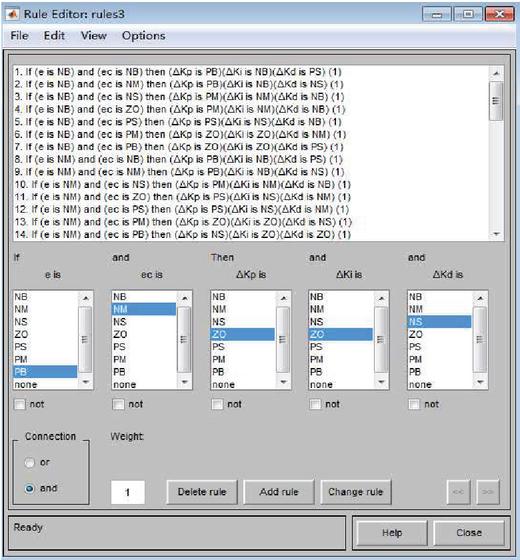
Figure 8 Fuzzy rule editor.
This paper selects Mamdina fuzzy reasoning method for reasoning. After the input of fuzzy rules is completed, 3d surface diagrams of three outputs can be obtained in the surface module, as shown in Figures 9–11.

Figure 9 The surface diagram of .
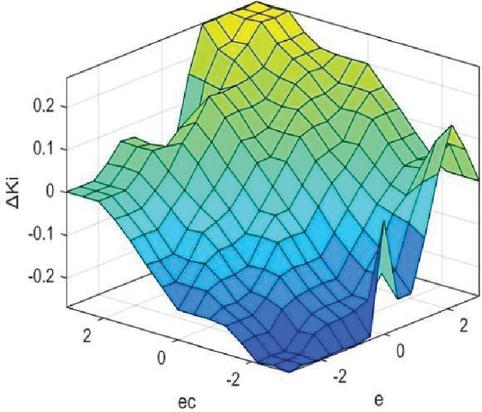
Figure 10 The surface diagram of .
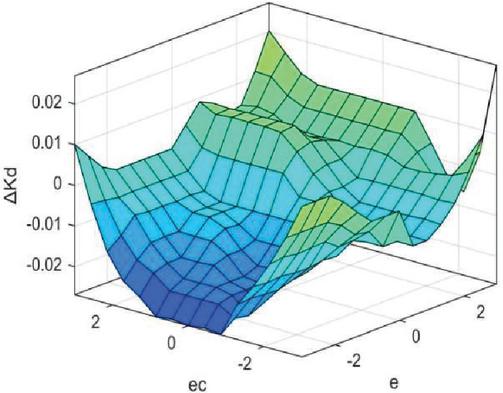
Figure 11 The surface diagram of .
The three-dimensional surface graph can more intuitively represent the fuzzy control rules designed above. Taking Figure 8 as an example, the graph shows the change relationship between the output variable and the two input variables E and EC, in which the abscissa is the domain of the input variable and the ordinate is the fuzzy domain of the output variable. The smoothness of the surface graph reflects the performance of the control rules to a certain extent, so the fuzzy control rules can be improved according to its smoothness. Then the center of gravity method is selected to complete the defuzzification of the control system.
3 Simulation of Electro-hydraulic Proportional Control System Based on AMESim/MATLAB
AMESim software has excellent performance in the field of system modeling. The hydraulic system can be established through the hydraulic library and other application libraries in the software [16, 17]. It can accurately complete the construction of the hydraulic loading system. Its disadvantage is that the control ability is poor, and the characteristics of MATLAB with strong control ability and excellent data processing ability can make up for this defect [18–20]. In this paper, AMESim and MATLAB are used for system modeling and simulation. The physical model of the control system is built by AMESim software, and the PID control and fuzzy PID control models are built in Matlab/Simulink. AMESim and MATLAB are connected through the interface module, so as to complete the import and output of data and realize the joint simulation.
3.1 Modeling of Hydraulic System Based on AMESim
AMESim software has the characteristics of simple operation, accurate and convenient modeling, which makes the operator no longer need to spend a lot of time and energy on the establishment of mathematical model and the editing of program code. It only needs to drag and connect the components in the software to complete the model construction, which greatly simplifies the model construction process of the system. Based on this mode, the actual working principle of the system can be reflected more intuitively, and the simulation and calculation of the system can be completed more accurately.
The simulation model is built according to the hydro-pneumatic suspension test platform, so as to compare the control effect of PID and fuzzy PID control algorithm. The physical model of hydraulic system based on AMESim is shown in Figure 12, which simulates the layout of loading system and hydro-pneumatic suspension during hydro-pneumatic suspension performance test. Input the hydraulic system parameters into AMESim and set the sampling time of the system to 0.01 s.
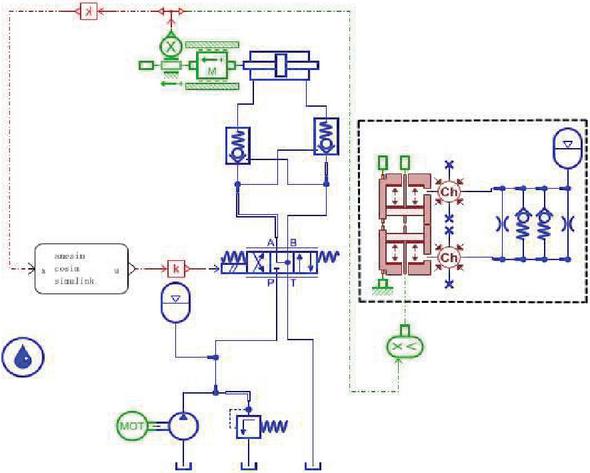
Figure 12 Hydro-pneumatic suspension test model based on AMESim.
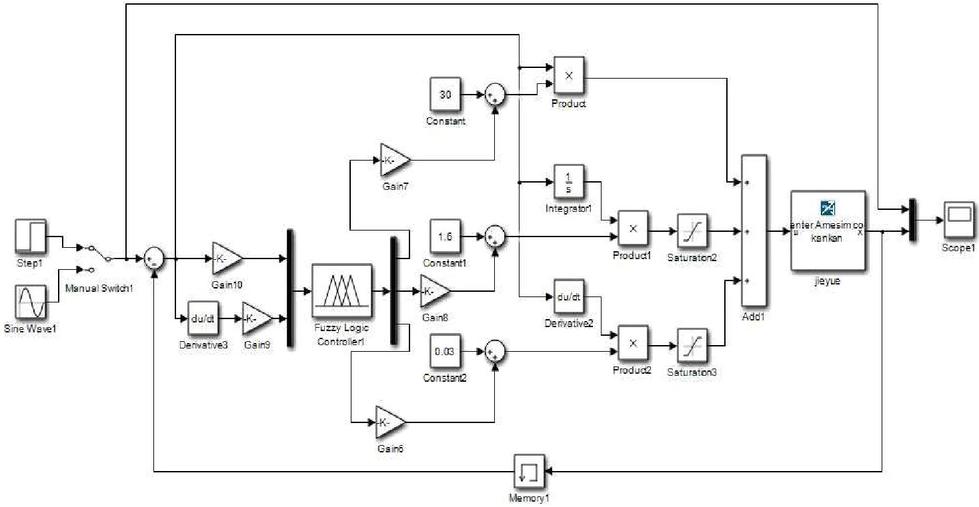
Figure 13 Fuzzy PID control model.
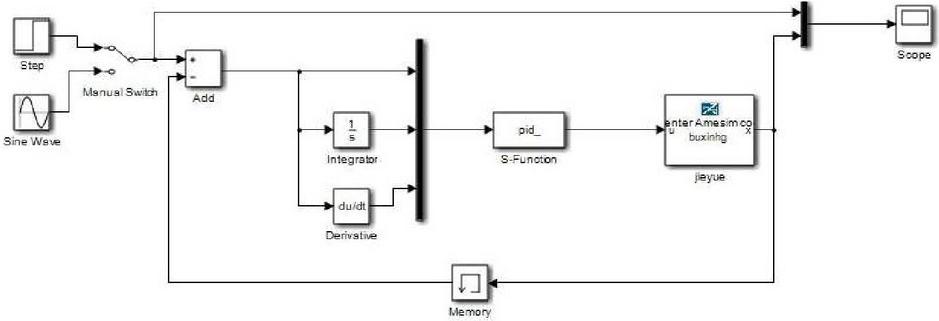
Figure 14 PID control model.
3.2 Control System Modeling Based on MATLAB/Simulink
In order to verify the performance of fuzzy PID control, the fuzzy PID control model and PID control model are built, as shown in Figures 13 and 14 respectively, to compare the control effects of the two algorithms. The parameters of PID control system are determined according to the trial and error method. After simulation and adjustment, is 30, is 1.6 and is 0.03.
3.3 Comparison and Analysis of Simulation Results
(1) The input signals in models 13 and 14 are sinusoidal signals with amplitude of 0.05 m, frequency of 1 Hz and simulation time of 2 s. The output effects of the two control methods are shown in Figures 15 and 16.
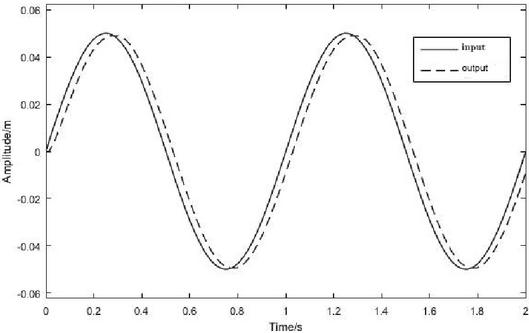
Figure 15 PID control sine simulation curve.
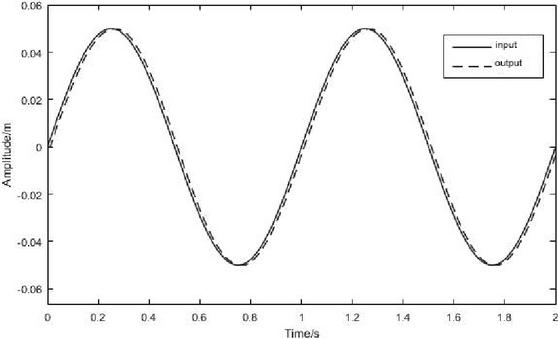
Figure 16 Fuzzy PID control sinusoidal simulation curve.
As shown in Table 5, in the tracking comparison of sinusoidal signals, compared with the traditional PID control method, the maximum error of fuzzy PID control method is reduced by 56.8% and the lag time is reduced by 70%. Therefore, compared with the traditional PID control, the error of fuzzy PID control is smaller and the following performance is better.
(2) Figure 17 is the physical model diagram of the system during the loading simulation test, and the 1/4 vehicle dynamics model is established. Among them, the unsprung mass of the car is 280 kg and the unsprung mass is 3000 kg.
Table 5 Two control methods for sinusoidal signal tracking pairs
| Control Method | Maximum Error/mm | Lag Time/s |
| PID control | 8.1 | 0.04 |
| Fuzzy PID control | 3.5 | 0.012 |
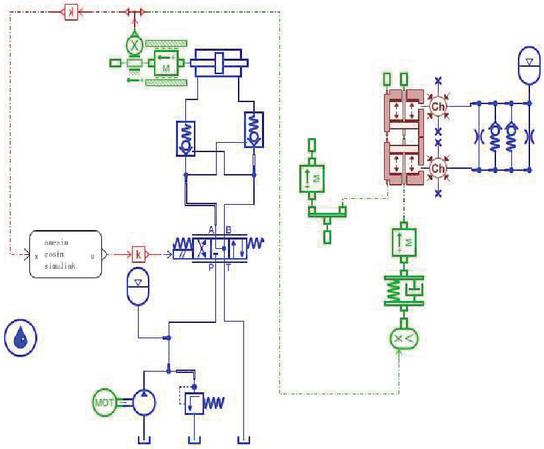
Figure 17 Loading simulation test.
The step signal is set to simulate the road bulge encountered by the vehicle during driving. The step signal is set to 0.05 m and the simulation time is 1 s. The comparison diagram of the step response effect of the system is obtained through simulation, as shown in Figure 18. The dotted line is conventional PID control and the solid line is fuzzy PID control. As can be seen from Figure 16, compared with the conventional PID control, the overshoot of the fuzzy PID control system and the time required to reach the steady state are greatly reduced. The time required for the conventional PID control method to reach the steady state is 0.33 s, and the fuzzy PID control reaches the steady state after 0.16 s, and the adjustment time is shortened by 51.5%. The maximum overshoot of conventional PID control system is about 7%, while fuzzy PID control system has almost no overshoot, and the control effect is better.
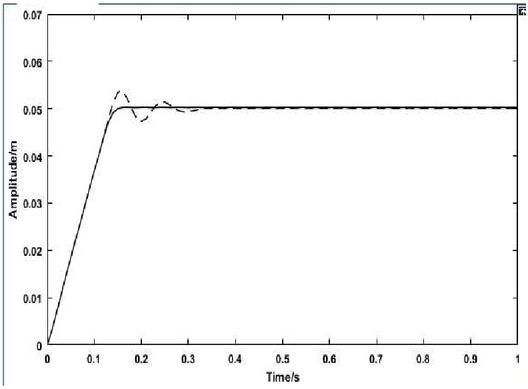
Figure 18 Step response comparison diagram.
4 Analysis of Test Characteristics of Hydro-pneumatic Suspension
4.1 Test System Composition
4.1.1 Hardware of test system
The test hardware equipment includes test bench, tested hydro-pneumatic suspension, hydraulic source system, signal conditioning module, data acquisition card and output card.
The test bench is mainly composed of guide column, loading cylinder and hydro-pneumatic suspension. The test bench is equipped with displacement sensor and force sensor. The test of hydro-pneumatic suspension is completed through data acquisition. The test bench can realize the performance test of hydro-pneumatic suspension, including displacement characteristic test, speed characteristic test, fatigue test and so on. The three-dimensional diagram of the test bench is shown in Figure 19.

Figure 19 Hydro-pneumatic suspension test bench structure diagram.
The test object is the hydro-pneumatic suspension of the snow removal vehicle. The total stroke of the hydro-pneumatic suspension is 200 mm, the diameter of the cylinder barrel is 110 mm, the diameter of the piston rod is 90 mm, the volume of the accumulator is 1.2 L, and the initial inflation pressure is 2 MPa.
4.1.2 Test system software
LabVIEW is selected as the measurement and control system development software of hydro-pneumatic suspension test bench, and the test parameters are displayed and recorded in the computer. LabVIEW software can be developed and used by users according to their own needs and corresponding experimental purposes through graphical symbols.
4.2 Test Data Analysis
4.2.1 Sinusoidal signal reproduction of loading system
In order to verify the effectiveness of fuzzy PID control algorithm with compensation in the loading system, the sinusoidal signal tracking test is carried out on the electro-hydraulic proportional position control system of hydro-pneumatic suspension test-bed. The specific process of the test is to input sinusoidal signal I with excitation frequency of 0.01 Hz and amplitude of 30 mm and sinusoidal signal II with excitation frequency of 1 Hz and amplitude of 30 mm to the loading control system respectively. The output effects of the two sinusoidal curves are shown in Figures 20 and 21 respectively. The upper half of the Figure is divided into sinusoidal input and feedback signal test curves, the blue curve represents the given signal and the yellow curve represents the actual output signal; The lower part is the real-time position error of the two curves in a period of time.
In order to test the output effect of loading cylinder under different amplitude conditions, the input amplitude is 50 mm without changing the excitation frequency. The output effects are shown in Figures 22 and 23 respectively.
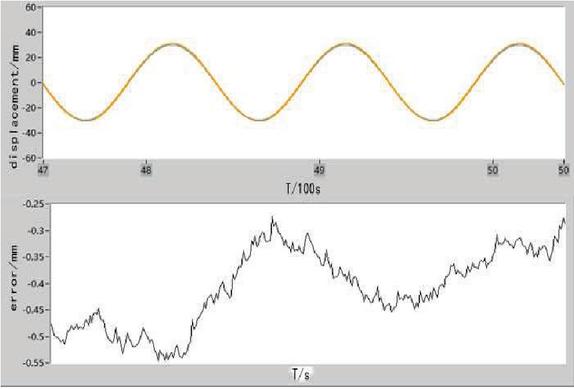
Figure 20 Test signal 0.01 Hz/30 mm.
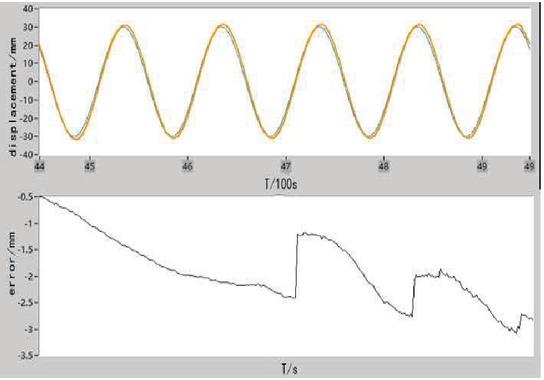
Figure 21 Test signal 1 Hz/30 mm.
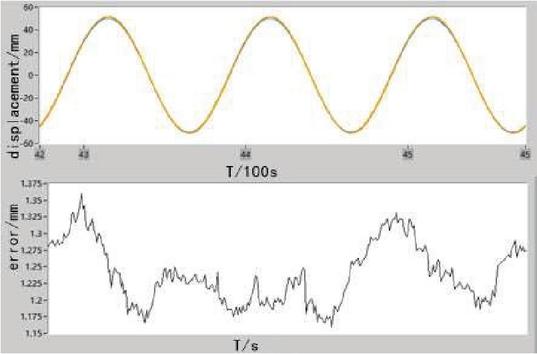
Figure 22 Test signal 0.01 Hz/50 mm.
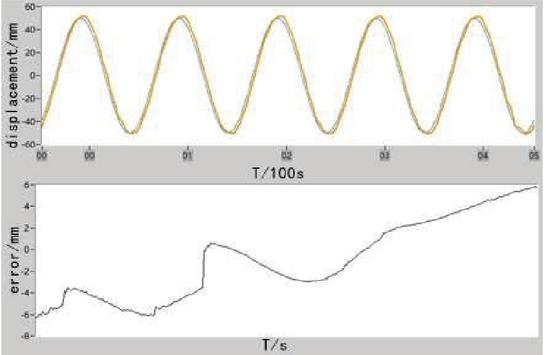
Figure 23 Test signal 1 Hz/50 mm.
The maximum absolute error values of Figures 20 and 21 are 0.82 mm and 3.4 mm respectively, and the error rates are 2.73% and 11.3% respectively. The absolute values of the maximum errors in Figures 22 and 23 are 1.36 mm and 6.23 mm respectively, and the error rates are 2.72% and 12.5% respectively. The test error rate is less than 15%, which meets the standard of construction machinery. Therefore, the test bench meets the test requirements of hydro-pneumatic suspension. (In Figure 23, the error increases over time because of sensor drift caused by interference from the external environment).
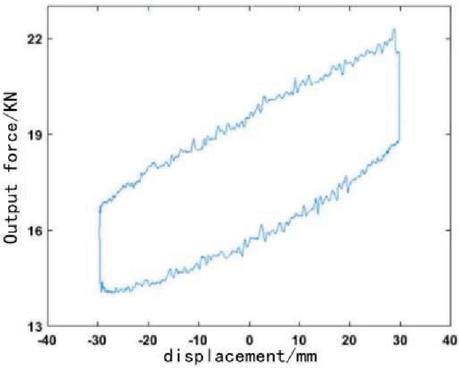
Figure 24 The original curve of elastic force.
4.2.2 Hydro-pneumatic suspension stiffness characteristic test
Under low-frequency excitation, because the relative movement speed of suspension cylinder and cylinder barrel is very small, the damping hole has little effect on the obstruction of low flow rate oil, so it can be approximately considered that the elastic force is the only output force of piston rod [21]. Therefore, the loading curve of stiffness characteristic test is signal I, with excitation frequency of 0.01 Hz and amplitude of 30 mm. Before the test, adjust the hydro-pneumatic suspension to the balanced position, and Figure 24 shows the original curve of elastic force.
It can be seen from Figure 24 that the compression and tensile stroke of the test curve do not coincide, and the noise generated by the vibration of the test bench during the hydro-pneumatic suspension stiffness characteristic test makes Figure 24 with sawtooth fluctuations. In order to obtain the elastic force curve of hydro-pneumatic suspension, in view of the small fluctuation of velocity, it can be assumed that the friction force is a pair of fixed values with the same size and opposite direction, and the average value of the two is the friction force and the filtering algorithm is used for denoising. The smooth elastic force curve after removing friction is shown in Figure 25.
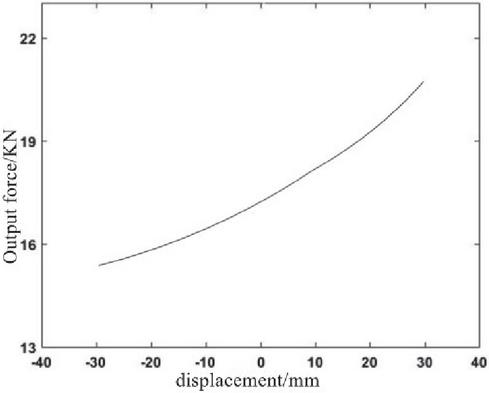
Figure 25 Elastic force curve after removal of friction.
As can be seen from the figure, the stiffness of the hydro-pneumatic suspension increases with the increase of the relative displacement between the piston and the cylinder barrel. When the relative displacement is small, the stiffness of the suspension is small. With the gradual increase of the relative displacement, the stiffness also becomes larger and larger.
4.2.3 Hydro-pneumatic suspension damping characteristic test
The relationship curve between the damping force of hydro-pneumatic suspension and the relative displacement between cylinder barrel and piston is the indicator diagram, and the relationship curve between the damping force and its relative speed is the speed characteristic diagram. The indicator diagram can characterize the advantages and disadvantages of the vibration damping performance of hydro-pneumatic suspension. The fuller, smoother and undistorted indicator diagram indicates that the higher the efficiency of the vibration damping performance of hydro-pneumatic suspension.
The indicator loading curve selected in this paper is signal II, with frequency of 1 Hz and amplitude of 30 mm. At this time, the output force of hydro-pneumatic suspension is the sum of damping force, elastic force and friction force. Therefore, the damping force can be obtained by removing the elasticity and friction force from the output force curve. The indicator diagram curve and damping force speed characteristic diagram are shown in Figures 26 and 27. The compression and extension stroke of hydro-pneumatic suspension are distinguished by the damping force. The part greater than zero is the compression stroke, and vice versa.
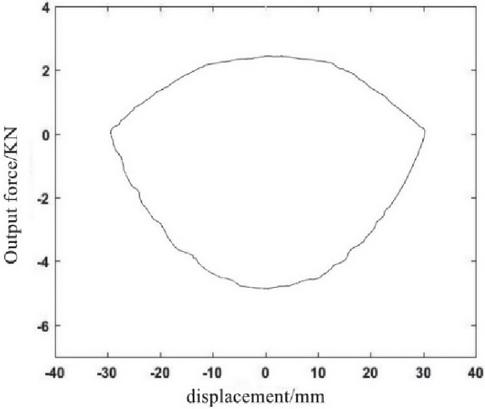
Figure 26 Indicator diagram.
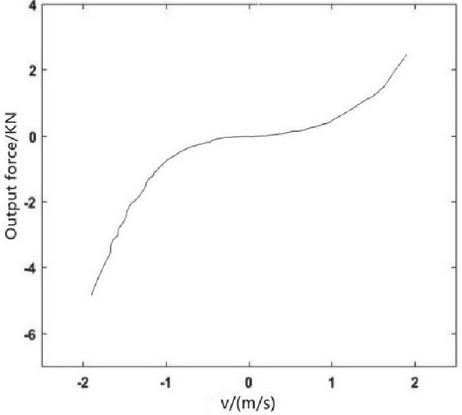
Figure 27 Velocity characteristic diagram of damping force.
It can be seen from Figures 26 and 27 that the damping force of the hydro-pneumatic suspension extension stroke is greater than that of the compression stroke. This way can make the hydro-pneumatic suspension give full play to its elastic characteristics when it is in the compression stroke, and give full play to its damping performance when it is in the extension stroke, so as to quickly attenuate the vibration. In addition, the damping force of hydro-pneumatic suspension increases with the increase of piston speed. At the same speed, the damping force of extension stroke is about 24 times that of compression stroke.
5 Conclusion
(1) According to the test requirements, the test bench is built, which can complete the performance test of hydro-pneumatic suspension and 1/4 vehicle road simulation test.
(2) The conventional PID control model and fuzzy PID control model are built in Matlab/Simulink platform. Compared with conventional PID control algorithm, the maximum error of fuzzy PID control algorithm for sinusoidal signal reproduction is reduced by 56.8%, and the lag time is reduced by 70%; For step signal reproduction, the time required to reach the steady state is reduced by 51.5%, and there is almost no overshoot. The fuzzy PID control algorithm is suitable for the electro-hydraulic proportional system of hydro-pneumatic suspension test bench.
(3) Taking LabVIEW as the software platform, the electro-hydraulic proportional loading control system program of hydro-pneumatic suspension test bench is designed and implemented. The sinusoidal system tracking test results show that when the test signals are 0.01 hz/30 mm and 1 Hz/30 mm, the error rates are 2.73% and 11.3% respectively; When the test signal is 0.01 hz/50 mm and 1 Hz/50 mm, the error rate is 2.72% and 12.5% respectively. The results show that the sinusoidal curve output by the electro-hydraulic proportional loading control system meets the actual requirements.
Authors’ Contributions
Relevant investigation, Meng Sun and Hui Li; conceptualization, Liqun Lu; computing method, Xin Bai; model establishment, Meng Sun and Leilei Zhao and Hui Li; reliability study, Liqun Lu and Leilei Zhao; resources, Liqun Lu; Write manuscript, Liqun Lu and Xin Bai.
Acknowledgments
General project of Shandong Natural Science Foundation (ZR2020ME127).
References
[1] An Fenglei. Research on Dynamics Simulation of the HPS System of All Terrain Crane[D]. Harbin: Harbin Institute of Technology, 2008.
[2] Li Shuai, Li Yi, Ma Liyuan. Research on Road Simulation Test of Electric Vehicle[J]. Automobile Technology, 2017(02): 16–19.
[3] Y. Samant Saurabh, Santosh Kumar, Kaushal Kamal Jain, Sudhanshu Kumar Behera, Dhiraj Gandhi, Sivapuram Raghavendra, Karuna Kalita. Design of Suspension System for Formula Student Race Car[J]. Procedia Engineering, 2016, 144: 1138–1149.
[4] Kulkarni Pritam V, Sawant P J, Kulkarni V V. Design and Development of Plane Bending Fatigue Testing Machine for Composite Material[J]. 2018, 5(5): 11563–11568.
[5] Xu Zhan. Reasearch on reproduction control of the standard road surface spectrum indoor[D]. Wuhan: Wuhan University of Technology, 2009.
[6] Li Xiyou. Research on Hydraulic Servo Control System for Automobile Shock Absorber Test-Bench[D]. Jinzhou: Liaoning University of Technology, 2016.
[7] Chen Xinbo, Wang Wei, Yang Yang, Liu Yiling, Chen Xi. Analysis and Design of a Vertical Loading Test Rig for Independent Suspension with Adjustable Hard Points[J]. Automotive Engineering, 2017, 39(06): 689–697.
[8] Yang Jiansen. Suspension K&C Characteristic Sensitivity Analysis to Automotive Handling[D]. Changchun: Jilin University, 2008.
[9] Li Bin. Analysis and Experimental Research of Proportional Valve with Displacement Feedback by the Moving Valve Sleeve[D]. Hangzhou: Zhejiang University, 2013.
[10] A. Martini, G. Bellani, C. Fragassa. Numerical Assessment of a New Hydro-Pneumatic Suspension System for Motorcycles[J]. International Journal of Automotive and Mechanical Engineering, 2018, 15(2): 5308–5325.
[11] O.V. Zalogin, A.S. Noskov. On the Study of Setting Dynamics of Axial Piston Pumps with Electro Hydraulic Proportional Control[J]. Procedia Engineering, 2016, 150: 289–293.
[12] Cao Bingwei, Liu Xinhui, Chen Wei, Tan Peng, Niu Pingfang, Mohamed Nayel. Intelligent Operation of Wheel Loader Based on Electrohydraulic Proportional Control[J]. Mathematical Problems in Engineering, 2020(16): 1–11.
[13] Lu Zhengyu, Zhang Junhui, Xu Bing, Wang Di, Su Qi, Qian Jinyuan, Yang Geng, Pan Min. Deadzone compensation control based on detection of micro flow rate in pilot stage of proportional directional valve.[J]. ISA transactions, 2019, 94: 234–245.
[14] Liu Jinkun. Matlab simulation of advanced PID control[M]. 3rd Edition. Beijing: Electronic Industry Press, 2011.
[15] Liu Wei. Research on the Coordinated Control Strategy of Vehicle under the Condition of Tire Blow-Out[D]. Guilin University of Electronic Science and technology, 2020.
[16] Wang Zhifu, Fang Jun, Song Zhijian, Song Qiang. Study on Speed Sensor-less Vector Control of Induction Motors Based on AMEsim-Matlab/Simulink Simulation[J]. Energy Procedia, 2017, 105: 2378–2383.
[17] Guo Yanxiu. Research on Control Method of the Electro Hydraulic Servo System of High-Speed Bogie Parameters Test Bench[D]. Jilin University, 2017.
[18] Rajaram M L, Kougianos E, Mohanty S P, et al. Wireless Sensor Network Simulation Frameworks: A Tutorial Review: MATLAB/Simulink bests the rest[J]. IEEE Consumer Electronics Magazine, 2016, 5(2): 63–69.
[19] Benaissa O M, Hadjeri S, Zidi S A. Modeling and Simulation of Grid Connected PV Generation System Using Matlab/Simulink[J]. International Journal of Power Electronics and Drive Systems, 2017, 8(1): 392–401.
[20] Chen Xiaoyun. Control Simulation and software development of Switched Reluctance Motor Based on Matlab/Simulink[D]. Jinan University, 2016.
[21] Phu N D, Hung N N, Ahmadian A, et al. A New Fuzzy PID Control System Based on Fuzzy PID Controller and Fuzzy Control Process[J]. International Journal of Fuzzy Systems, 2020. 22(7): 2163–2187.
Biographies

Xin Bai, born in 1999, she is a master’s student in the School of Transportation and Vehicle Engineering, Shandong University of Technology, China, mainly engaged in the research of vehicle suspension control system and parts design theory and technology.

Liqun Lu, born in 1969, associate professor of the School of Transportation and Vehicle Engineering of Shandong University of Technology, China. He obtained his Ph.D. degree in vehicle engineering from the University of Science and Technology Beijing in December 2008, mainly engaged in the research of intelligent control of special vehicles and key components, electro-hydraulic control system related technologies.

Meng Sun, born in 1998, she is a master’s student in the School of Transportation and Vehicle Engineering of Shandong University of Technology, China, mainly engaged in fluid transmission control technology and the design and research of key components of hydraulic systems.

Leilei Zhao, born in 1982, associate professor of the School of Transportation and Vehicle Engineering of Shandong University of Technology, China. He received his Ph.D. degree in mechanical and electronic engineering from Beijing University of Posts and Telecommunications in June 2019, mainly engaged in the design theory and technology research of vehicle suspension systems.

Hui Li, born in 1995, he obtained a master’s degree in transportation engineering from Shandong University of Technology, China in June 2021, mainly engaged in the design theory and technology research of vehicle suspension systems.
International Journal of Fluid Power, Vol. 24_3, 537–566.
doi: 10.13052/ijfp1439-9776.2436
© 2023 River Publishers