Influence of Jet Parameters on the Aero Engine Cleaning Flow Field
Jie Tang, Zhenhua Zhong*, Xin Lu and Liwen Wang
School of Aeronautical Engineering, Civil Aviation University of China, Tianjin, 300300, People’s Republic of China
E-mail: 1097936072@qq.com
*Corresponding Author
Received 12 May 2022; Accepted 04 July 2022; Publication 12 June 2023
Abstract
Engine blades will be contaminated during operation, On-line cleaning is the main method to solve blade fouling. In order to study the effect of jet parameters on the flow field of aero-engine cleaning, a low-pressure first-stage rotor flow channel model of a CFM56-7B engine was established, and the changes in the parameter of the cleaning flow field were analyzed under different incident pressures. The results showed that as the jet pressure increased, the average pressure along the blade height increased, whereas the average pressure along the cross section at 50% blade chord length decreased. The vorticity along the blade height cross section increased first and then decreased as the jet pressure increased, whereas the vorticity along the blade chord length cross section remained basically unchanged after the jet pressure reached 3 bar. Comparing experimental results, when the pressure is maintained at 3 bar, better cleaning effect can be obtained. The research provides a theoretical basis for the on-line cleaning.
Keywords: Aero-engine, cleaning flow field, jet parameters, online cleaning.
1 Introduction
Online cleaning of aero-engines is an important means to solve the pollution of gas path components. The optimization of process parameters is of great significance to improving the cleaning effect. During the working process of aero engine, suspended particles are inhaled and deposited on the surface of the compressor blade, which increases the surface roughness and airfoil thickness of the blade, resulting in a decrease in the intake air flow rate, changes in the aerodynamic flow field, and separation of the airflow in the intake port [1, 2]. These phenomena will cause deterioration of aero engine aerodynamic performance, lower thrust and total pressure ratio, lower compressor efficiency, and accelerated exhaust gas temperature margin decline. Previous experience with military and civil aviation engines shows that online cleaning is an important technical approach to prevent engine performance degradation and slow corrosion development [3].
The process parameters of aero-engine online cleaning have been extensively studied in the literature. Chiariotti and Borello [4] summarized the research status of gas turbines in online cleaning systems. Research on cleaning jets includes investigations of the jet pressure, droplet size, droplet incident position and direction. Results have shown that the speed and size of droplets are the key factors that affect the engine during online cleaning. Zhang [5, 6] studied the cleaning process of shipborne aircraft engine and the running state of washing equipment in cold and analyzed the concentrations of cleaning solution on cleaning effect. And they conducted a numerical study on a typical cleaning system used for industrial gas turbines. Their results showed that cleaning efficiency is largely dependent on the jet velocity and the nozzle parameters used by the jet. Ishaque and Zheng [7] investigated the effect of incoming water on axial flow compressors through numerical simulations. A self-coded droplet-wall interaction model was used to study the droplet impingement and the film breaking process on the compressor blade surface, which also included the splash effect. It was concluded that as the water content increases, the loss of characteristics increases, the working range is shortened, the flow angle changes, higher clogging occurs in the tip section of the flow and tip losses lead to additional energy losses and performance degradation. Yang and Zhang [8] investigated the effect of incoming water on the performance of a compressor and the characteristics of the tip gap flow. Simulation results show that water droplets change the distribution of airflow parameters along the span direction, leading to a decrease in mass flow velocity and an increase in the angle of attack in the tip region, as well as the separation of the boundary layer at the suction surface. In addition, the loss of momentum caused by droplet impact and rupture directly leads to a sharp increase in static entropy in the tip region of the blade. The study of droplet collisions has provided a great deal of assistance in the study of engine cleaning.
Engine in-wing cleaning is the installation of a cleaning device on the lip of the aircraft’s air inlet. The device is powered by the starter of the aircraft engine and rotates at low speed. The cleaning fluid is atomised through a nozzle and enters the engine to clean it [9]. Jiang Keyi et al. [10] used the flow field simulation method to determine the cleaning method and cleaning jet parameters of a certain type of turbofan engine, and concluded that the mass flow parameters of cleaning fluid, but the influence of nozzle back pressure and cleaning fluid flow on cleaning effect cannot be determined by compressor flow field simulation for lack of online cleaning test. Chellini and Roberto [11] discussed the application of cleaning nozzles in large-scale turbine cleaning. The PSA Mark3 atomizing nozzle developed by Turbotect was tested on a specially developed test platform and in the wind tunnel laboratory of a university in Switzerland. After verification, it was concluded that the nozzle had a droplet size of 50 to 250 microns at a working pressure of 4 bar, which provided a good cleaning effect.
From the above research, it can be seen that the research on the mechanism of aero-engine cleaning flow field mainly focuses on the research of engine droplet parameters on the cleaning flow field, and the lack of comparison of online experimental results leads to the fact that the research results cannot be applied to the actual engine cleaning. In order to study in more detail the effect of jet parameters on the static pressure, velocity and vortex in the cleaning flow field during engine in-wing cleaning, this paper analyses them through a combination of smooth three-dimensional numerical simulations and experiments. The analysis in this paper provides important theoretical support for the optimisation of the process parameters of aero-engine in-wing cleaning.
2 Research Object and Numerical Simulation Method
2.1 Research Object
The engine online cleaning process is shown in Figure 1. The water is atomized by the nozzle and enters the internal bypass of the engine to complete the cleaning of the fouling on the blade surface.
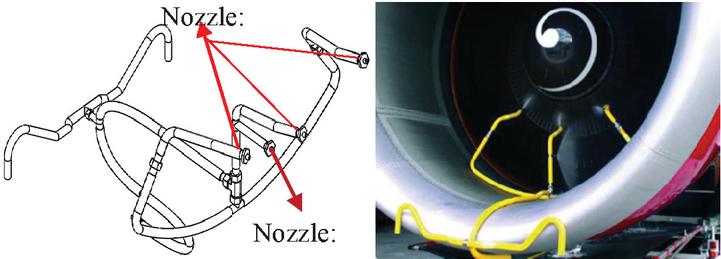
Figure 1 The aero-engine online cleaning.
To study the characteristics of the low-pressure cleaning flow field of the aero-engine during online cleaning, this paper selects the most commonly used aircraft engine for medium- and short-range routes (CFM56-7B) as the research object and establishes a low-pressure first-stage moving blade compressor model of the CFM56-7B engine. The radius r of the hub wall of the moving blade compressor and the radius R of the casing wall were measured at the Beijing Ameco overhaul plant. For the inlets and outlets of the compressor motor blades, the hub wall radius and casing wall radius were mm and mm. The CFM56-7B engine has 80 low-pressure first-stage moving blades. The established blade model is joined with the hub wall to create a low-pressure first-stage moving blade model. The physical model is reduced in size by 1:2.5. The model used for numerical calculations is shown in Figure 2.
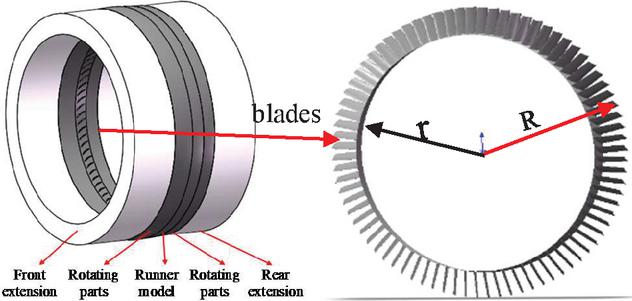
Figure 2 Compressor calculation flow channel model.
The flow path model is obtained by performing a Boolean operation on the annular body formed by the compressor rotor blade model, the compressor hub wall and the casing wall. The inlet surface of the compressor flow channel model extends axially by 30 mm, and the outlet surface extends axially by 20 mm. The purpose of the follower torus is to make the fluid passing through the stationary blade transition when the follower blade rotates. The three parts are combined to form the moving blade flow channel model. In the fluid simulation calculation, to prevent the occurrence of reverse flow, it is necessary to add an extension to the inlet and outlet of the moving blade flow channel model.
2.2 Numerical Simulation Methods and Grid Verification
2.2.1 Numerical methods
Jet parameter boundary condition setting
(1) Nozzle model selection
According to the results of theoretical calculations and experiments using the CFM56-7B aero engine fan blade spacing and compressor inlet ring width, the nozzle selected for cleaning the three internal channels is the 2520 nozzle, whereas the nozzle selected for cleaning the one external channel is the 11020 nozzle, as shown in Figure 1.
(2) Density of cleaning fluid
After the action of the aerodynamic field of the engine fan, the atomized liquid flow is evenly dispersed in the duct before entering the compressor. For the convenience of analysis, this article assumes that the water mist entering the compressor is evenly distributed.
According to the nozzle parameter table, the flow rate can be found under different pressures. The nozzle jet speed is obtained by the following formula: [12–14]. The relationships between pressure and the nozzle jet speed for the 2520 nozzle and 11020 nozzle is shown in Table 1.
Table 1 Relationship between pressure and the nozzle jet speed for the 2520 nozzle and 1020 nozzle
| Pressure of Cleaning | Flow of the | Flow of the |
| Fluid (Bar) | 2520 Nozzle (L/min) | 11020 Nozzle (L/min) |
| 2 | 6.5 | 7.9 |
| 3 | 7.9 | 11.8 |
| 4 | 9.1 | 13.7 |
The mixture speed of Air and water is denoted , and the ratio of the mass flow of cleaning liquid to the mass flow of air is denoted . Then, the mixture speed of air and water is . The air velocity is obtained by numerical simulation as m/s, which can be used to obtain the mixture speed of air and water at the compressor inlet. The compressor inlet hub wall radius is r 348 mm, the casing wall radius is R 420 mm, the inlet cross-sectional area is A 0.1737 m, and the mixed density of fine water mist is calculated by the following formulas:
| (1) | ||
| (2) |
where is the mass flow rate, is the volumetric flow rate, is the mixed density of fine water mist, is the mixture speed of air and water, and is the cross-sectional area. The corresponding relationship between the jet pressure and the mixed density is shown in Table 2.
Table 2 Relationship between the jet pressure and mixing density
| Pressure of Cleaning | Inlet Flow | Inlet Flow | Mixing Density |
| Fluid (Bar) | Rate (L/min) | Speed (m/s) | (kg/m) |
| 2 | 17.15 | 6.49 | 4.152 |
| 3 | 20.85 | 7.48 | 5.912 |
| 4 | 24.03 | 8.48 | 7.726 |
(3) Inlet and outlet boundary conditions
Through numerical simulation analysis, it is concluded that the inlet velocity and outlet pressure are selected for the boundary conditions of the compressor. The inlet velocity is 6.49 m/s. In the fully developed internal flow, the turbulence intensity is 5%. The outlet pressure is 1.0712 atm, the normal outflow boundary is selected, and the pressure distribution adopts a uniform radial distribution.
Turbulence model settings
Most of the current convection field analysis uses the standard model because it shows strong robustness and stability in calculations [12], but for some flows, such as flow separation, flow reattachment, and rotating fields, the results obtained from the standard model will be poor and cannot accurately describe the boundary layer flow near the wall. Therefore, a model, , needs to be introduced for this purpose. The transport equations of turbulent flow energy and turbulent large eddy frequency are expressed as follows:
| (3) | ||
| (4) |
where represents the turbulent flow energy caused by the average velocity gradient; represents the generation of large eddy frequencies; and represent the effective diffusion coefficient of and , respectively; and represent the dissipation due to turbulence and , respectively; and and represent the source terms.
Compared to the standard model, the model can better describe the boundary layer flow near the wall and perform better in the presence of reverse pressure gradients [16]; however, the performance of the model is very sensitive to the of the incoming flow. Menter proposed combining the standard model and the model into an SST model by introducing a mixing function [17], which retains the characteristics of the near wall surface of the model [18], gradually integrates the model in the process of moving away from the wall surface and eliminates convection. As the SST model overcomes the sensitivity problem found in the current models, this model has higher accuracy and credibility in the field of rotational flow.
2.2.2 Grid verification
Grid determination
The mesh types supported by fluent include triangle, quadrilateral, tetrahedron, pyramid pentahedron, triangular cylindrical pentahedron and hexahedron. For the rotating machinery of compressor flow field simulation in this paper, it is difficult to keep the grid line consistent with the flow direction, and quadrilateral and hexahedral grids have no advantages, while triangular and tetrahedral grids have strong adaptability to complex geometry, which can save a lot of time in the grid generation stage. Considering the time cost and computing resources of mesh generation, triangular and tetrahedral meshes are selected in this paper.
In the near wall area, the fluid flow is obviously affected by the wall. The wall area can be divided into three sub layers, namely viscous bottom layer, transition layer and logarithmic law layer. In order to capture the wall flow of hub surface and shroud surface, it is necessary to mesh the boundary layer on the wall. For the boundary layer grid, the height of the first layer grid is particularly important. In CFD calculation, the model is used near the wall. For the low Reynolds number model, it is necessary to meet y 1, and it is better to be close to 1.
The mesh drawn in mesh is shown in Figure 3. Import it into fluent for mesh conversion to generate polyhedral mesh. The converted mesh model is shown in Figure 4.
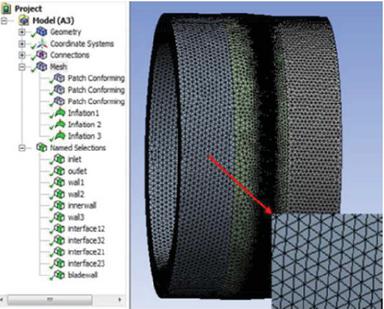
Figure 3 Meshing of modle.
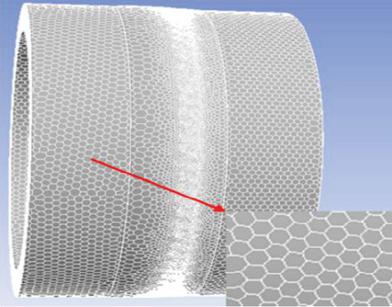
Figure 4 Polyhedral mesh.
For the same example, the pressure nephogram under two different grids is shown in Figure 5. From Figure 5, it can be seen that polyhedral grid can better capture the characteristics of blade edge pressure and blade surface pressure distribution, so polyhedral grid is selected.

Figure 5 Tetrahedral grid pressure nephogram and Polyhedral mesh pressure nephogram.
Grid independence analysis
Before fluent numerical calculation, it is of great significance to find the optimal grid density and verify the grid independence for the reliability of calculation accuracy. Select one of the calculation examples to ensure that all setting conditions are the same, change the number of grids, and observe the average vorticity of 50% blade chord section. The results are shown in Figure 6. It can be seen from the figure that after the number of grids exceeds 1.8 million, the calculation results tend to be flat. Considering the computer performance and time cost, 1.8 million grids are selected for simulation calculation in this paper.
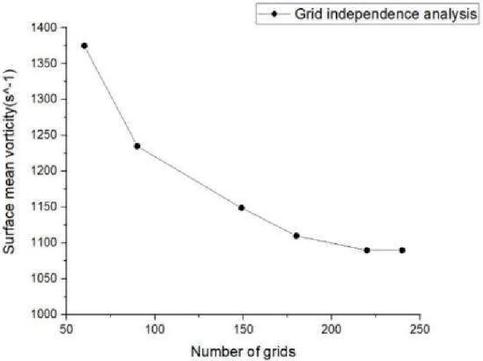
Figure 6 Grid independence analysis.
3 Calculation Results and Analysis
3.1 Effect of Jet Parameters on the Static Pressure of the Cleaning Flow Field
This paper analyses the effect of nozzles on the static pressure of the cleaning flow field under specific pressures of 1 atm, 2 atm, 3 atm, 4 atm and 5 atm. A cylindrical surface section was established along the direction of the blade height in the area of the compressor rotor blades to observe the change trend of pressure along the blade height. Additionally, a chord length cross section of the blade was established along the axial direction to observe the change trend of the axial pressure. Figure 7 shows magnified views of the static pressure at different blade heights. as the blade height increases, the pressure increases first and then decreases, and the overall change in pressure is small.
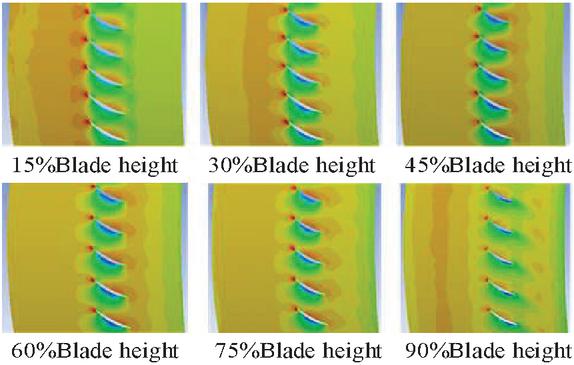
Figure 7 Static pressure for the chord cross section.
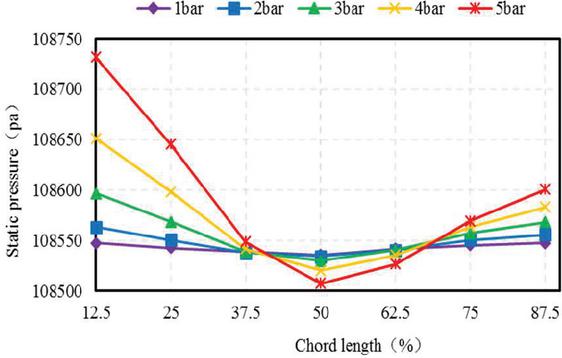
Figure 8 Average pressure in different blade chord sections.
Under different incident pressures, the average pressures are analysed at different sections of the blade chord length, and the results are shown in Figure 8. The results show that under the same incident pressure, as the blade chord length increases, the average pressure in the cross section decreases first and then increases. Moreover, the average pressure reaches a minimum at the 50% chord length cross section because the flow field reaches the maximum velocity when passing near the midline of the suction surface of the blade. The Bernoulli equation shows that this maximum velocity leads to the minimum pressure in this location. For the same blade chord cross section, in the 12.5–37.5% chord length region, the blade section pressure increases with increasing incident pressure, but the trend gradually decreases along the chord length. In the 37.5–62.5% chord length region, the larger the incident pressure is, the smaller the average pressure on the chord section, but the trend is to decrease first and then increase. In the 62.5–87.5% chord length region, the average pressure on the chord length section gradually increases with increasing incident pressure, but the increasing trend is smaller than the initial decreasing trend. This phenomenon occurs because although the compressor blades do work on the flow field, the total energy of the flow field is increased, but the increase in the flow rate makes the decrease in the pressure energy more obvious. The pressure reaches the minimum on the suction surface of the 50% blade chord section.
3.2 Effect of Jet Parameters on the Cleaning Flow Field Velocity
The nature of the velocity of the cleaning flow field determines the strength of the momentum exchange between the flow field and the compressor wall, which is of great significance for cleaning the compressor wall. Fluent simulation software was used to analyse the velocity characteristics of the cleaning flow field along the height and chord of the blade. Figure 9 shows magnified views of the velocity at different blade heights. This figure shows that the average velocity in the cross section increases first and then decreases along the direction of the blade height, and the average velocity in the suction surface is significantly greater than that in the pressure surface.
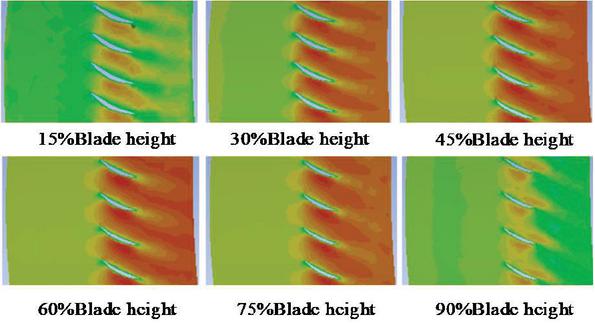
Figure 9 Velocity for the cylindrical cross section.
The average velocities along the cylindrical cross section at different blade heights under different incident pressures are shown in Figure 10. The results show that under the same incident pressure, as the blade height gradually increases, the average velocity in the cylindrical cross section showed a trend of increasing first and then decreasing and reached the maximum at 45–60% blade height. This phenomenon mainly occurs because the compressor blades did work on the cleaning flow field, which increased the kinetic energy of the flow field. Due to the effect of viscous friction near the wall of the casing, the velocity slightly decreased. At the same blade height, the average velocity in the cylindrical cross section gradually increased as the incident pressure increased, and the increase was uniform between different blade heights.
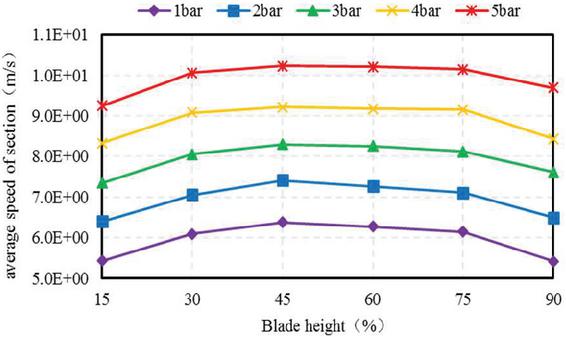
Figure 10 Velocity variation in the cylindrical cross section at different blade heights.
Observation surfaces were established at different positions along the blade chord. Figure 11 shows magnified views of the cross section at different blade chord lengths. The average velocity in the cross section gradually increases along the blade chord length, and the average velocity in the suction surface area is significantly greater than that in the pressure surface area.
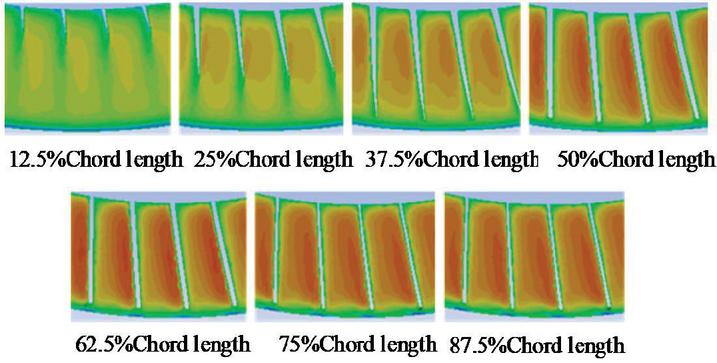
Figure 11 Velocity for the blade chord cross section.
Figure 12 shows that under the same jet pressure, the average cross-sectional velocity increases linearly along the blade chord length. This phenomenon mainly occurs because the compressor blade plays a great role in cleaning the flow field. At the same blade chord length, the average cross-sectional velocity increases with increasing jet pressure. A cleaning flow field with higher velocity is more conducive to the exchange of momentum between the cleaning flow field and the compressor wall surface, thereby increasing the effectiveness of compressor blade cleaning.
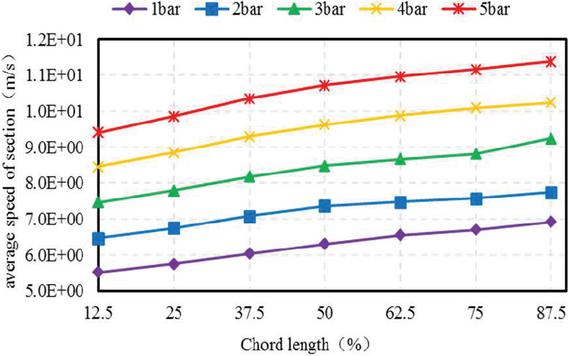
Figure 12 Variation in cross-sectional velocity at different blade chord lengths.
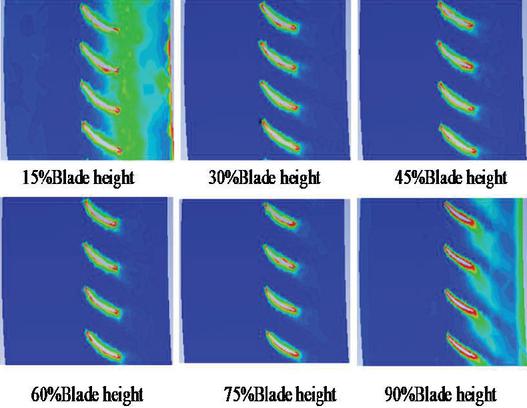
Figure 13 Vorticity for the cylindrical cross section.
3.3 Effect of Jet Parameters on the Cleaning flow Vorticity
The vorticity of the fluid velocity vector is called the vorticity, which is a physical quantity that measures the strength and direction of the vortex. In the compressor blade cleaning flow field, the vorticity is closely related to the flow field velocity. An analysis of the flow field is of great significance. Figure 13 shows magnified views of the vorticity at different blade heights. The average vorticity in the cross section decreases first and then increases as the blade height increases, indicating that the vortices are more concentrated in the area near the compressor hub wall and the casing wall. Moreover, there are also vortices in the air flow channel. However, the intensity of the vortices is relatively weak.
Figure 14 shows the change trend of the vorticity in the cylindrical cross section at different blade heights under different incident pressures. The figure shows that the change trend of the cross-sectional vorticity is the same under the different incident pressures, in which it decreases first and then increases. The vorticity at the hub wall surface is higher than the vorticity at the casing wall surface. At the same blade height, the average cross-sectional vorticity increases as the jet pressure increases, and the increasing trend becomes more obvious as the blade height increases.
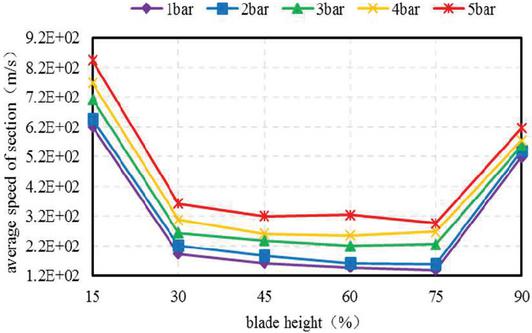
Figure 14 Vorticity for the cylindrical cross section at different blade heights.
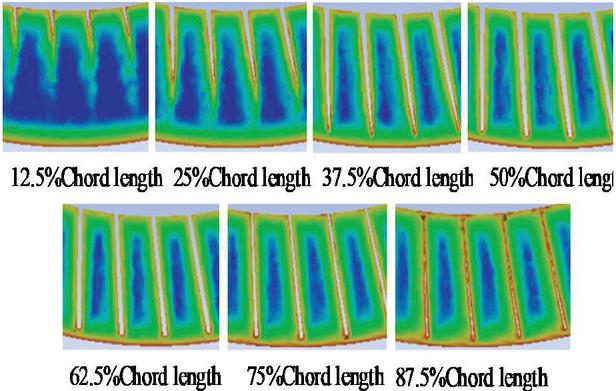
Figure 15 Vorticity of the blade chord cross section.
Similarly, the axial vorticity of the compressor blade cleaning flow field is analysed. Figure 15 shows magnified views of the vorticity at different blade chord lengths. The results show that the average cross-sectional vorticity gradually increases along the blade chord length, and the vorticity reaches a maximum in the pressure and suction surface areas of the blade. This phenomenon mainly occurs because the viscous friction between the fluid and the wall has a great effect on the generation of vortices.
Figure 16 shows the variation trend of vorticity in different blade chord cross sections under different incident pressures. The results show that under the same incident pressure, the average cross-sectional vorticity gradually increases as the blade chord length increases. At the same blade chord length, as the jet pressure increases, the vorticity increases. This phenomenon mainly occurs for two reasons: (1) the work of the compressor blades on the cleaning flow field increases the kinetic energy of the flow field, which enhances the flow field vorticity, (2) the increase in the external jet pressure further promotes the turbulent characteristics of the flow field.
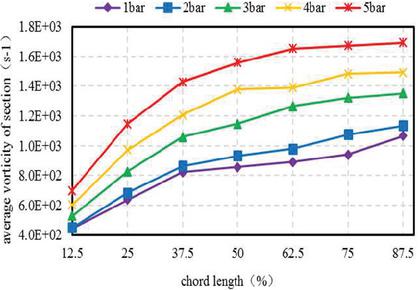
Figure 16 Variation in cross-sectional vorticity at different blade chord lengths.
4 Aircraft Engine Online Cleaning Test
When the jet pressure is maintained at 3 bar, better cleaning effect and higher economic benefits can be obtained. A Boeing 737-600 of Air China was cleaned online with a pressure of 3 bar, as shown in Figure 17.
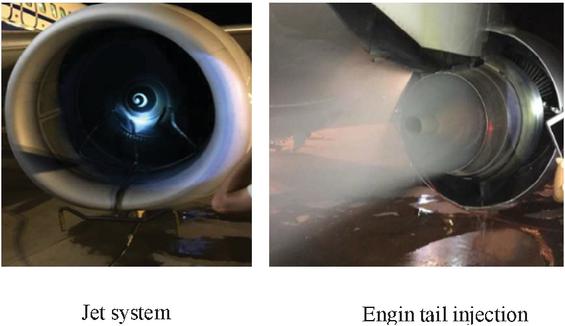
Figure 17 Aircraft engine online cleaning.
By parsing the messages of the Aircraft Communications Addressing and Reporting System, we obtain the EGTM (Exhaust Gas Temperature Margin) raw data of the flight cycles of the two engines from April 10, 2019 in the past 10 months, and pre-process the obtained EGTM data to eliminate noise points and bulk Error and smooth the data to eliminate interference. In comparison with reference [19], also using the CFM56 engine rotor as a model, this paper evaluates the step change and drop rate of EGTM data after washing to provide theoretical support for this paper to observe the degree of recovery of EGTM before and after washing to compare the effect of washing at different pressures. This paper found that the EGTM recovered to 14.6C when observing the change in EGTM before and after washing. Comparing the cleaning results at different pressures, as shown in Figure 18, the best recovery of the EGTM was achieved when the injection pressure was 3 bar. This analysis proves the correctness of the numerical analysis.

Figure 18 Comparison of EGTM recovery under different jet pressures.
5 Conclusion
In this paper, through numerical simulations, a first-stage moving blade compressor model and a flow channel model of the engine are established, and the jet parameter boundary conditions and a turbulence model are constructed. The effect of the jet parameters on the compressor cleaning flow field is analysed in detail, and verified by experiment. The following conclusions can be drawn:
(1) The average static pressure along the blade height cross section increases as the jet pressure increases. Moreover, for the cross section at 50% blade chord length, the average pressure decreases as the jet pressure increases. According to calculations of the average flow field pressure, the optimal jet pressure is 3 or 4 bar.
(2) The average velocity of the cleaning flow field increases with increasing jet pressure, and this increase in velocity is uniform in both the blade height cross section and blade chord cross section.
(3) The vorticity along the blade height cross section increases with increasing jet pressure. Moreover, the rate of vorticity increase along the blade chord cross section first increases and then decreases as the jet pressure increases. As the jet pressure increases from 2 bar to 3 bar, there is a large increase in vorticity; however, subsequent increases in jet pressure do not result in large vorticity changes.
(4) Comparing experimental results, when the jet pressure is maintained at 3 bar, the cleaning effect is better and the economic benefits are higher.
The research results show that when the jet pressure is 3 bar, the engine has the best online cleaning effect, which provides a theoretical basis for the selection of engine cleaning nozzle parameters.
Acknowledgements
Thanks for the teacher’s guidance and modifications to make this paper more perfect. This thesis was supported by the Scientific research Project of Tianjin Education Commission (2020KJ019); National Natural Science Foundation of China, Joint Foundation Project, (U1933202), Research on Key Technologies for In-situ Minimally Invasive Maintenance of Civil Aircraft Engines.
Nomenclature
| The radius of the hub wall of the moving blade compressor | |
| The radius of the casing wall | |
| Flow rate | |
| The nozzle jet speed | |
| The mixture speed of Air and water | |
| The ratio of the mass flow of cleaning liquid to the mass flow of air | |
| Air velocity | |
| The inlet cross-sectional area | |
| The mass flow rate |
| The volumetric flow rate | |
| The fluid density | |
| Turbulent flow energy | |
| Turbulent large eddy frequency | |
| The turbulent flow energy caused by the average velocity gradient | |
| The generation of large eddy frequencies | |
| The effective diffusion coefficient of | |
| The effective diffusion coefficient of | |
| The dissipation due to turbulence | |
| The dissipation due to turbulence | |
| The source terms of | |
| The source terms of |
References
[1] Suman, A., Vulpio, A., Casari, N., Pinelli, M., Kurz, R., and Brun, K. (March 31, 2021). “Deposition Pattern Analysis on a Fouled Multistage Test Compressor.” ASME. J. Eng. Gas Turbines Power. August 2021; 143(8): 081006.
[2] Kurz R, Musgrove G, Brun K. Experimental evaluation of compressor blade fouling[J]. Journal of Engineering for Gas Turbines and Power, 2017, 139(3).
[3] WANG Chunhui, XU Zhipeng, YANG Xinyi, Numerical Simulation Study on Two Phase Flow Field of Cleaning Aero Engine, System Simulation Technology, 11(2):101–105123, 2015
[4] Chiariotti A, Borello D, Venturini P, et al. Erosion prediction of gas turbine compressor blades subjected to water washing process[C]//Asia Turbomachinery & Pump Symposium. 2018 Proceedings. Turbomachinery Laboratory, Texas A&M Engineering Experiment Station, 2018.
[5] Li Benwei, Wu Heng, Zhang Yong, Lin Xuesen, The strength calculation and vibration analysis of an on-line cleaning jet frame of an engine, Journal of Navy Aviation Engineering College, 32(2):235–240, 2017
[6] Li Benwei, Wu Heng, Shen Wei, etc. Selection and test of on-line channel cleaning injection parameters for a turbofan engine [J]. Journal of Aerospace Power, 2018, v.33 (05): 10–17.
[7] Ishaque G, Zheng Q, Ahmad N, Luo M, Aziz A. Aerodynamic performance investigation of an axial flow compressor under water ingestion. Proceedings of the Institution of Mechanical Engineers, Part A: Journal of Power and Energy. June 2022.
[8] Yang L, Zhang H, Lin A. Effects of water ingestion on the tip clearance flow in compressor rotors. Proceedings of the Institution of Mechanical Engineers, Part G: Journal of Aerospace Engineering. 2019;233(11):4235–4246.
[9] Zhu Lei, Zuo Hong-fu, Cai Jing, Zhang Chi. Optimization Method of Civil Engine Washing Interval Based on Operational Reliability [J]. Aeronautical Computing Technique, 2014, 44(3): 47–52.
[10] Fu Xuyun, Zhong Shisheng, Jiang Haibo, Mao Haoquan, Quantitative evaluation method of civil aviation engine washing effect, Aerospace engineering progress, 6(3): 347–353, 2015.
[11] Chellini, Roberto, Wash nozzles designed for larger turbines, Diesel and Gas Turbine Publications, 36(4): 332–345, May, 2004.
[12] Montanari M, Ronchi F, Rossi C, et al. Control and performance evaluation of a clutch servo system with hydraulic actuation[J]. Control Engineering Practice, 2004, 12(11): 1369–1379.
[13] Molitor D A. Hydraulics of Rivers, Weirs and Sluices: The Derivation of New and More Accurate Formulas for Discharge Through Rivers and Canals Obstructed by Weirs, Sluices, Etc., According to the Principles of Gustav Ritter Von Wex[M]. J. Wiley & sons, 1908.
[14] Castro, J.M. and Jackson, P.L. (2001), Bankfull Discharge Recurrence Intervals and Regional Hydraulic Geometry Relationships: Patterns in the Pacific Northwest, USA. JAWRA Journal of the American Water Resources Association, 37: 1249–1262.
[15] Wu J C. Elements of vorticity aerodynamics, pp. 14–19, Shanghai Jiaotong University Press, shanghai, 2014.
[16] Menter F R, Two-equation eddy-viscosity turbulence models for engineering applications, AIAA Journal, 32(8) 1994.
[17] Lighthill M J, boundary layer theory in laminar boundary layer, pp. 46–113, Oxford University Press, Oxford, 1963.
[18] Stroud I, Xirouchakis P C. STL. Advances in Engineering Software, pp. 83–95, Elsevier Ltd, Oxford, 2000.
[19] Zhiqi Y A N, Zhong S, Lin L I N, et al. A step parameters prediction model based on transfer process neural network for exhaust gas temperature estimation after washing aero-engines[J]. Chinese Journal of Aeronautics, 2022, 35(3): 98–111.
Biographies

Jie Tang. From 2003 to 2007, he studied in thermal energy and power engineering of School of fluid power and control of Lanzhou University of technology and received a bachelor’s degree in engineering. From 2007 to 2010, he studied in mechanical and electronic engineering of School of mechanical engineering of Yanshan University and received a master’s degree in engineering. From 2014 to 2021, he studied in fluid transmission and control of Yanshan University and received a doctor’s degree. Main research directions: Fluid transmission and control; Aviation ground special equipment; Electromechanical hydraulic integration. He is an associate professor at Civil Aviation University of China.

Zhenhua Zhong. He studied aircraft power engineering at Yantai Nanshan University from 2017 to 2021, received a bachelor’s degree in engineering. Since 2021, he has majored in machinery at Civil Aviation University of China and studied for a master’s degree in engineering.

Xin Lu. From 2008 to 2012, he studied in the Department of thermal energy and power of the school of energy and environmental engineering of Hebei University of technology and obtained a bachelor’s degree. From 2012 to 2014, he studied in the Department of power machinery and engineering of the school of mechanical engineering of Tianjin University and obtained a master’s degree. From 2014 to 2018, he received a doctor’s degree in the Department of power machinery and engineering of the school of mechanical engineering of Tianjin University. Main research interests: Research on rub impact fault characteristics of rotor dynamics; Theoretical research on Aeroengine wing cleaning; Research on aircraft tractor dynamics, he is a lecturer in power engineering, flight department, School of Aeronautical Engineering, Civil Aviation University of China.

Liwen Wang. He graduated from Northeast Heavy Machinery Institute (now Yanshan University) in 1984, majoring in hydraulic pressure, and from 1987 to 1996, he was a master, doctor and postdoctoral of Harbin Institute of technology. He is currently the director of the ground special equipment research base of civil aviation of China and the director of the science and Technology Department of Civil Aviation University of China. Distinguished expert of CAAC, first floor of Tianjin 131 talent project, national civil aviation model worker, advanced individual of Tianjin Jiusan Society, and expert enjoying special allowance of the State Council. He served as a director of China Aviation Association, a member of the youth working committee of China Aviation society, a member of the hydraulic and pneumatic Professional Committee of China Aviation society, a member of the Youth Committee of fluid transmission and control of China Mechanical Engineering Society, and a director of China transportation system engineering society.
International Journal of Fluid Power, Vol. 24_3, 491–512.
doi: 10.13052/ijfp1439-9776.2434
© 2023 River Publishers