Facilitating Energy Monitoring and Fault Diagnosis of Pneumatic Cylinders with Exergy and Machine Learning
Zhiwen Wang1, Bo Yang1, Qian Ma2, Hu Wang1, Rupp Carriveau3, David S-K. Ting3 and Wei Xiong1,*
1Department of Mechanical Engineering, Dalian Maritime University, Dalian 116026, Liaoning, China
2Department of Information Science and Technology, Dalian Maritime University, Dalian 116026, Liaoning, China
3Turbulence and Energy Laboratory, Ed Lumley Centre for Engineering Innovation, University of Windsor, Windsor N9B 3P4, Ontario, Canada
E-mail: wzw@dlmu.edu.cn; xiongwei@dlmu.edu.cn
*Corresponding Author
Received 24 July 2022; Accepted 30 March 2023; Publication 06 November 2023
Abstract
Pneumatic systems are widely used in industrial production sectors. Increasing penetrations of Intelligent Manufacturing and Green Manufacturing are highlighting the drawbacks of pneumatic technology in terms of particularly low energy efficiency and low-level fault diagnosis intelligence. Here we propose that a combined energy-based maintenance and fault diagnostic approach for pneumatic systems could be a game-changer for pneumatics. In this study, a pneumatic cylinder with internal and external leakages is examined and a typical pneumatic experimental system is built. Exergy is adopted for evaluating the available energy of compressed air. Data-driven machine learning models, SAE SoftMax neural network model and SAE SVM model, are developed for fault detection and diagnosis. By comparing different machine learning methods with various pressure, flowrate, and exergy data, it is found that the diagnostic accuracy when using pressure and flowrate data is highly dependent on operating conditions, while the diagnostic accuracy when using exergy data is always high regardless of operating conditions. This indicates the promise of developing an exergy-based maintenance paradigm in pneumatic systems. Besides, with exergy and machine learning, more downstream faults can be detected and diagnosed with fewer upstream sensors. This study is the first attempt to develop an exergy-based maintenance paradigm in pneumatic systems. We hope it could inspire the following investigations in other energy domains.
Keywords: Pneumatic system, pneumatic cylinder, energy monitoring, fault diagnosis, exergy, machine learning.
1 Introduction
The manufacturing sector consumes about half of the global total energy generation and about 90% of industrial energy consumption [1, 2]. Increasing pressures from government regulations, energy prices, market forces, and sustainability awareness, etc. are pushing manufacturing enterprises to accept Intelligent Manufacturing and Green Manufacturing and to upgrade their production lines and management systems. Energy Management Systems (EMS) and Prognostic and Health Management (PHM) are critical enablers for Green Manufacturing and Intelligent Manufacturing. Generally, EMS and PHM are separately considered and operated in manufacturing workshops. In recent years, the novel interactive EMS-PHM Paradigm (i.e., Energy-Based Maintenance Paradigm) has drawn great attention and evolved rapidly [3–6]. Manufacturing energy data needs to play a more important role in decision-making processes.
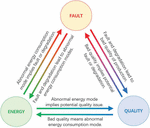
Essentially, for a complex multi-energy domain coupled electromechanical system, the production processes are the controls of energy/power flows, that is, the energy/power flow can affect the states of components and systems. That means the energy data could be used for energy efficiency optimization, condition monitoring, fault diagnostics and prognostics, and final quality management. Figure 1 shows the Fault-Energy-Quality nexus framework which illustrates the interactions between fault states, energy consumption, and quality of products in automatic production systems. Abnormal energy consumption modes imply faults or degradations of components/systems, subsequently low-quality products. Conversely, bad quality issues are generally caused by faults or degradations of components/systems, and faults or degradations lead to abnormal energy consumption modes. In this framework, the energy data is easily obtained and monitored.
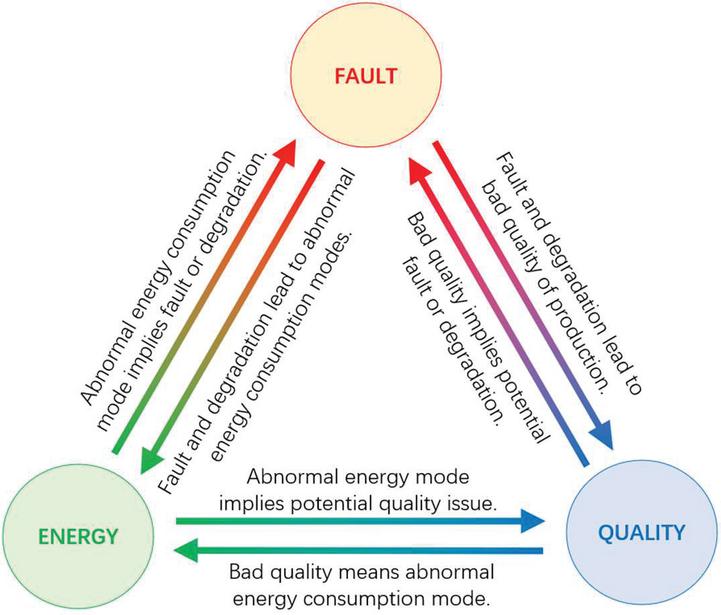
Figure 1 Fault-Energy-Quality nexus framework.
In automatic production systems, energy is generally transmitted and converted by mechanical, electrical, hydraulic, and pneumatic approaches. Hereinto, pneumatic systems are widely used in various automatic workshops, such as automobile assembly, automatic welding, electronics assembly, canning and packing, and robotics. This confirms the well-established, highly valued attributes of pneumatic systems, such as low investment costs, simple structure, easy maintenance, environmental friendliness, and long service life, etc. [7–9]. However, compared with mechanical, electrical, and hydraulic systems, the pneumatic system presents two obvious disadvantages. First of all, energy efficiency with a value of less than 15% is significantly lower than that of other transmission systems [10, 11]. Even though the initial capital investment of a pneumatic system is much lower than hydraulic and electric systems, the high energy cost caused by low efficiency can generally account for 70%80% of the total life cycle cost. Air is clean and cheap, but compressed air is one of the most expensive energy carriers. To date, there is no systematic and uniform standard for evaluating the energy performance of pneumatic systems [12, 13]. Secondly, the development of intelligent fault diagnoses and prognoses technologies for pneumatic components/systems are trailing behind others. This could be attributed to a couple of things: (i) the investigation cost of pneumatic components/systems are very low, and the reliabilities are relatively high, therefore complicated and expensive sensors are not judged an economically prudent option for investment, and; (ii) the particularly non-linear and coupling properties of compressed air increase the fault diagnoses and prognoses challenges for pneumatic components/systems. Thus, to maintain a competitive edge for pneumatics in this time of Intelligent Green Manufacturing, these shortcomings must be overcome. A more dedicated and economic fault diagnosis and prognostic approach is needed. Here we submit that the integration of energy management and fault diagnostics and prognostics of pneumatic components and systems could be a game changer in this space. The first critical issue is to solidly prove the scientific hypothesis that there is a mapping relationship between energy modes and fault modes in pneumatic components/systems.
Thus, in this study, we take the most representative actuator pneumatic cylinder as an example, and we prove that the exergy data can be used for fault diagnosis with the help of machine learning methods. Further, we prove that the exergy signal always outperforms the single pressure signal and flowrate signal as a diagnostic, irrespective of the operating conditions. This evidence is critical for further developing an Exergy-Based Maintenance Paradigm for complex pneumatic systems. The organization of this paper is as follows: In Section 2, an overview of the state of the art of fault diagnosis, energy and exergy analysis in pneumatic systems is provided and analysed. Section 3 provides the methodology used in this study, including exergy calculation, experiments, data processing, and machine learning methods. Results are analysed and discussed from different perspectives in Section 4. Finally, conclusions are drawn in Section 5.
2 Literature Review of Fault Detection and Diagnosis in Pneumatic Systems
In these times of Industry 4.0, increasingly more pneumatic enterprises are developing intelligent management and fault diagnosis technologies by taking advantage of the Internet of Things (IoT), big data, and machine learning, etc. In recent years, several industrial products and services have been released. For instance, in 2021, EMERSON-AVENTICS launched the plug-and-play Smart Pneumatics Analyzer and Smart Pneumatics Monitor for preventative maintenance and energy optimization by continuously monitoring the flow of air in a system to detect leaks in real-time [14]. Almost simultaneously, by taking advantage of machine learning, FESTO-RESOLTO launched the Festo Automation Experience (Festo AX) software platform with functions of preventive maintenance, monitoring the quality in production and energy consumption [15]. However, more time is needed to fairly assess the true efficacy of these ‘black-box’ products. Some would say there is still a notable gap between promising scientific research developments and industrial applications. That is, compared to other power/energy transmission systems, intelligent fault diagnosis in pneumatic systems is in its infancy from the perspective of scientific research, let alone industrial applications. For example, leakage is one of the most common faults and contributes to 10%40% of energy waste in pneumatic systems. The existing leak detection and positioning of pneumatic systems/components in most workshops are still primitive, complex, and limited: suds and hearing. Some workshops introduce a more reliable option, the ultrasonic leak detector; nevertheless, it is not in real-time, it is costly both in terms of labour and time, and it is incapable of detecting internal leakages. In recent years, some pneumatic functional modules have been developed to detect downstream leakages by periodically detecting pressure decrease and flowrate increase [16, 17]. However, the locations of leakage points cannot be provided by these pneumatic functional modules.
In general, fault diagnosis in pneumatic systems can be classified into three categories: experience-based, model-based, and data-driven approaches.
Experience-based fault diagnosis is currently the most widely used approach in manufacturing workshops. It is quite simple and economical to implement. However, its function is highly dependent on the experience of workers. Unfortunately, few workers are competent to carry out a reliable and accurate diagnosis of pneumatic systems and components. The maintenance manuals provided by manufacturers generally only show some common and static faults under limited conditions [18, 19]. Although the experienced-based approach can be used when historical data is very limited, it is generally less reliable than the other two approaches, especially when the system and environment change dynamically [4]. The widely recommended Fault Tree Analysis (FTA) can be regarded as a systematic and normalized experienced-based method [20]. However, solid and thorough knowledge of pneumatic systems/components is the precondition for accurate diagnosis. Generally, this is feasible for the designer but not the user. Besides, the experienced-based approach is generally used for breakdown maintenance. In other words, the fault diagnosis is not conducted until the facilities/plants break down. For a more convenient automation application, experience-based approaches can be further extended and embedded in computer-aided expert systems based on sound, knowledge, and experience [21–24].
Model-based fault diagnosis is largely founded on mathematic models of systems and components, which are generally deduced from phenomenological laws and apriori knowledge about systems and components. Theoretically, once the mathematic model is established, a model-based approach should provide higher accuracy than the other two approaches. However, the cost is generally very high and a model can be limited to a specific system [4]. The determinations of some critical parameters are usually bottlenecks. For a complex system, it is very difficult and sometimes impractical to establish an accurate mathematic model, especially when considering interaction, nonlinearity, randomness, and degradation. The accuracy of fault diagnosis drops dramatically with a coarse model. The situation is more challenging for pneumatic systems due to the strong coupling of pressure, flowrate, and temperature of compressed air. Therefore, there are almost no established model-based fault diagnosis cases in terms of complex pneumatic systems except several cases on pneumatic components and small test benches [25–31].
Data-driven fault diagnosis can be regarded as the extension of conventional signal-based approaches with the booming IoT, big data, and machine learning, etc. It is a cutting-edge topic in the field of FDD (Fault Detection and Diagnosis) and has been widely and successfully applied in a variety industry sectors [32, 33]. No solid white-box mathematic models are needed, and representative features can be extracted from the historical and new data. Accordingly, it could also be the most promising enabler for FDD in pneumatic systems. In the past decades, many data-driven methods with various data signals have been investigated. Such data includes pressure of compressed air, flowrate of compressed air, acoustic emission, electric energy consumption, vibration of components, temperature, position, displacement/velocity/acceleration, etc. Leu et al. [34] conducted some fault diagnosis simulations of pneumatic circuits based on a bidirectional LSTM (Long Short-Term Memory) Neural Network. Five types of signals, including internal and external pressure, temperature, flowrate of compressed air, and piston displacement of the pneumatic cylinder, were used as data set inputs for training the LSTM model. The results showed that the accuracy of the bidirectional LSTM model is higher than that of a typical LSTM model and traditional diagnosis methods and the accuracy of specific fault diagnosis was higher than 95%. It should be noted that the data sets were collected via simulations and not experiments, as some signals were not practically available workshops. Li and Kao [35] introduced a method for diagnosing external leakage faults on both sides of the pneumatic cylinder using wavelet methods and pattern recognition. The multiresolution wavelet decomposition of various sensor signals such as pressure, flowrate, etc. was employed to extract features for final classification. The method worked but the accuracy was not released. The process of feature extraction was relatively complex and the universality was unknown. Demetgul et al. [36] evaluated the fault diagnosis performance of a combination of eight sensors and ANNs (Artificial Neural Networks) on a didactic modular production system (MPS) from the Festo Company. These sensors include pressure sensor of main system, magazine optics sensor, vacuum information P/E switch, material handling P/E switch, linear potentiometer, material handling arm pressure sensor, vacuum analogy pressure sensor, and material in the stock optic sensor. The 25 features of signals were calculated for identifying 11 faults. The results showed that ANNs could be used for the diagnostic of even extremely repetitive automation systems and more sensors were needed for accurately diagnosing more faults. Therefore, they recommended that the number of the fault modes to be kept below 5 for a more reliable diagnosis. Zachrison and Sethson [37] explored the feasibility of detecting the operating changes of a rod-less pneumatic cylinder by using self-organizing maps. Various combinations of displacement, velocity, and pressure signals were used for eigenvector. It was found that more features and more sensors did not mean a better detection result for a specific change. Santolamazza et al. [38, 39] thought that it was an interesting method to detect and predict faults by analysing signals of energy consumption because the degradation and energy performance were always intertwined. Therefore, they explored the possibility of real-time detecting anomalous behaviours of a compressed air generation system in a manufacturing factory. A baseline (healthy state) model of energy consumption was created by using artificial neural networks (ANNs). And then the deviation from the baseline was calculated by comparing the actual energy consumption with the baseline, which could imply the anomalous behaviours. Besides, they further evaluated the availabilities of other machine learning techniques for better energy consumption control in compressed air generation systems. Similarly, Benedetti et al. [40] and Bonfá et al. [41] also proved the feasibility of controlling energy performance and detecting anomalous behaviours of compressed air generation systems by analysing energy consumption data. Abela et al. [42, 43] investigated the feasibility of detecting downstream leakages of compressed air in pneumatic systems by calculating the pressure changes in the upstream. The experimental results showed that it is feasible in a limited and controlled simple test system but not so in more complex systems. Ertel et al. [44] thought that it was too expensive and impractical to monitor the individual pneumatic components and every pneumatic system was typically unique, therefore it was more practical to identify faulty operation from normal operation at the system level instead of detailed fault diagnosis of individual pneumatic components. Thus, with only flowrate data, they successfully identified the faulty state of a simple pneumatic test system using one-class-learning algorithm nearest neighbour-data-description. Kovacs and Ko [45] identified the fault states of pneumatic cylinders based on real data from a factory using various unsupervised machine learning methods. Qi et al. [46] proposed a fault-diagnosis system for reciprocating compressors used in petroleum industry by taking advantage of big data and machine learning. Big data of five years, including vibration, pressure, temperature, noise, and position signals, were collected for feature extraction. The results showed that the system could identify most of potential faults with more than 80% accuracy. Mahmoud et al. [47] and Czopek et al. [48] explored the feasibility of detecting leakages of pneumatic components by analysing acoustic emission signals caused by leakages of compressed air. Pneumatic valves are also the essential components in pneumatic systems. There are several studies on fault detection and diagnosis of pneumatic valves with different data-driven and machine learning methods, such as principal component analysis (PCA), Bayesian classification, adaptive neuro-fuzzy inference, and ANNs etc. [49–54].
Overall, fault detection and diagnosis of pneumatic systems and components are in high demand, but this knowhow is in its infancy. Based on our surveys of previous studies, the following defects still need to be overcome.
• It is very difficult to conduct FDD when considering the faults on both system level and individual component level. Current studies focus on either system or component.
• Generally, more, and more diverse sensors are needed for diagnosis of different faults.
• Fault detection is relatively easier but fault diagnosis is difficult.
• Some theoretical studies are notionally good, but have not been tested in an actual workshop environment.
• Data-driven approaches are the most promising. Data-driven modelling and hybrid modelling could make up for the shortfalls of traditional model-based approaches. However, in terms of pneumatic systems, data-driven FDD is still maturing, that is, the self-learning and self-adaptive functions are still not available.
According to the introduction and literature review, we propose that combining exergy data with machine learning could help to overcome these shortcomings to some extent, advancing FDD in pneumatic systems. This study is the first step to test this hypothesis.
3 Methodology
The use of the data-driven methods for FDD usually involves the following steps: data selection, data preprocessing, feature extraction, classifier building, and fault detection and diagnosis. Thus, in this section, we first explain why the exergy data is selected to estimate the energy performance of pneumatic systems. Then, a pneumatic experimental setup is designed for collecting data and simulating internal and external leakage faults. Collected exergy data is preprocessed and then sent to a stacked Auto-encoder (SAE) for feature extraction. Subsequently, a support vector machine (SVM) classifier is trained for FDD. Finally, several detailed experiments are designed to validate the methodology.
3.1 Exergy of Compressed Air
Generally, for evaluating the energy performance of pneumatic systems at the system level and the component level, three approach categories can be summarized, including the calculation of the mass or volume of compressed air, the thermodynamic first-law-based approach, and the thermodynamic second-law-based approach. Different approaches are utilized in different systems and applications by different vendors and users. Nevertheless, in recent years, the second-law-based exergy analysis has been widely investigated and proven to be a more solid criterion than others for evaluating energy performance of pneumatic systems [11, 55–58]. Actually, exergy-based methods have been widely used in many fields, and a standard analytical framework has been developed [59]. Most recently, thanks to the powerful capacity of presenting detailed and reliable energy information, exergy-based methods have also been used for energy performance prediction and predictive control with the help of machine learning [60–63]. Besides, from the perspective of data fusion, exergy of compressed air can be regarded as a data fusion criterion of pressure, flowrate, and temperature. More information can be implied from exergy than other single data. Thus, in this study, the exergy is used for representing the energy data for FDD.
In pneumatic systems, there are no chemical reactions and the changes of kinetic energy and potential energy of compressed air are generally negligible. Thus, the chemical exergy, kinetic exergy, and potential exergy of compressed air are not considered. The total exergy can be represented by the physical exergy as expressed as
| (1) |
where is the total exergy flowrate in J/s, is the mass flowrate of compressed air in kg/s, is the specific exergy in J/kg, is the specific enthalpy in J/kg, is the specific entropy in J/kg/K, is the temperature in K, and subscript 0 signifies the reference state.
In industrial pneumatic systems, the pressure of compressed air is generally below 1 MPa, therefore, the compressed air can be regarded as an ideal gas. The specific exergy can be calculated by
| (2) |
where is the constant-pressure specific heat of compressed air in J/kg/K, is the gas constant in J/kg/K, and is the pressure in Pa.
Exergy represents the maximum amount of useful work that can be obtained as the system is brought to equilibrium with the environment. Thus, a clear definition of the reference environment is essential. In this study, the pressure and temperature of atmospheric reference state are set as 101325 Pa and 25C, respectively.
The temperature fluctuations of environment and system are negligible in the pneumatic system investigated in this study. Thus, the exergy of compressed air is further simplified and calculated by the following equation.
| (3) |
3.2 Experimental Setup
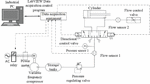
For leakage faults detection and diagnosis of the pneumatic cylinder, an experimental setup of a typical pneumatic system is built as shown in Figure 2. Compressed air is generated via a variable-speed air compressor providing a near-constant pressure compressed air storage tank. A pressure regulating valve is set downstream of the storage tank to regulate the pressure in the downstream system. The pneumatic cylinder is controlled by a three-position five-way solenoid directional control valve. A single full operation cycle of the pneumatic cylinder includes an expansion stroke and a contraction stroke. The external leakage faults are simulated by controlling a flow control valve in the rod port side. The internal leakage faults are simulated by damaging the sealing ring artificially. Pressure sensor 1 and flow sensor 1 are installed upstream of the pneumatic cylinder. The flow sensor is a type of FESTO SFAB. The accuracy of flowrate metering is (3% o.m.v. 0.3% F.S.). The flow measuring range is 6600 L/min for flow sensor 1. The pressure sensor is a type of SMC ISE40A. The accuracy of pressure metering is 2% F.S. The pressure measuring range is 0.11.000 MPa. The acquired pressure data and flowrate data are used for calculating exergy data. The combined uncertainty of exergy is about 4% of the expected value of exergy in the main range of measurement of this study. Flow sensor 2 is used for measuring and controlling the flowrate of external leakage. It is also a FESTO SFAB flow sensor. The flow measuring range is 0.550 L/min. All sensor and pneumatic components can be enabled and regulated via the PC for data acquisition and control. ADVANTECH PCI-1710U data acquisition card is used for DAQ and the software system is programmed via LabVIEW. The frequency of data acquisition is set at 100 Hz.
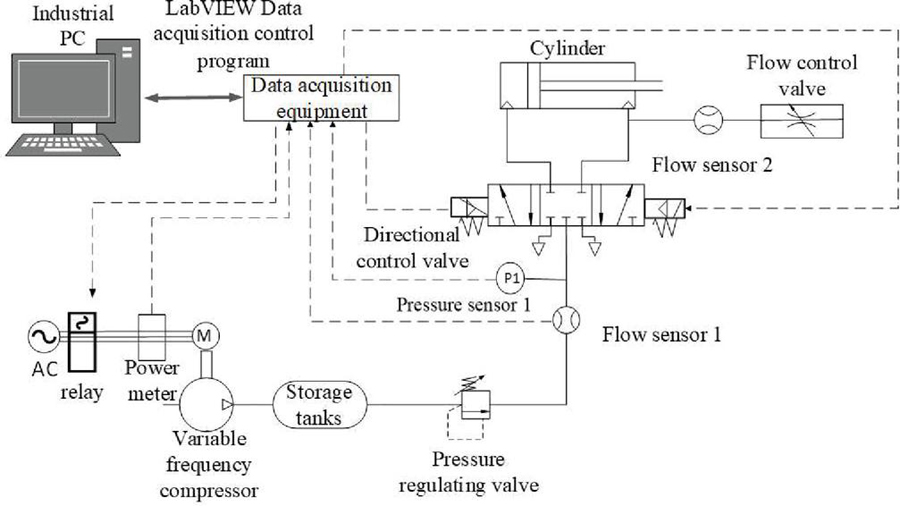
Figure 2 Experimental setup of a typical pneumatic system.
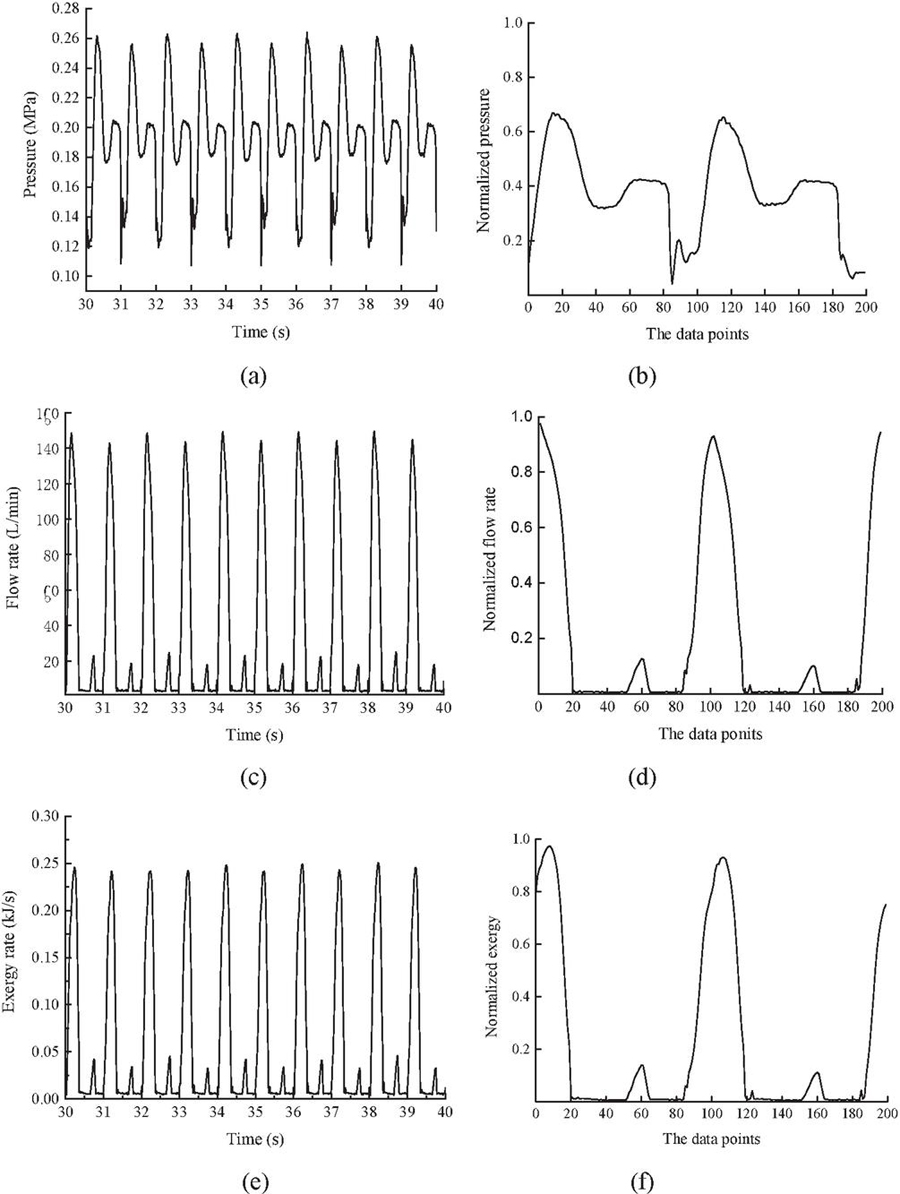
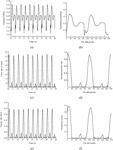
Figure 3 Acquired data from sensors.
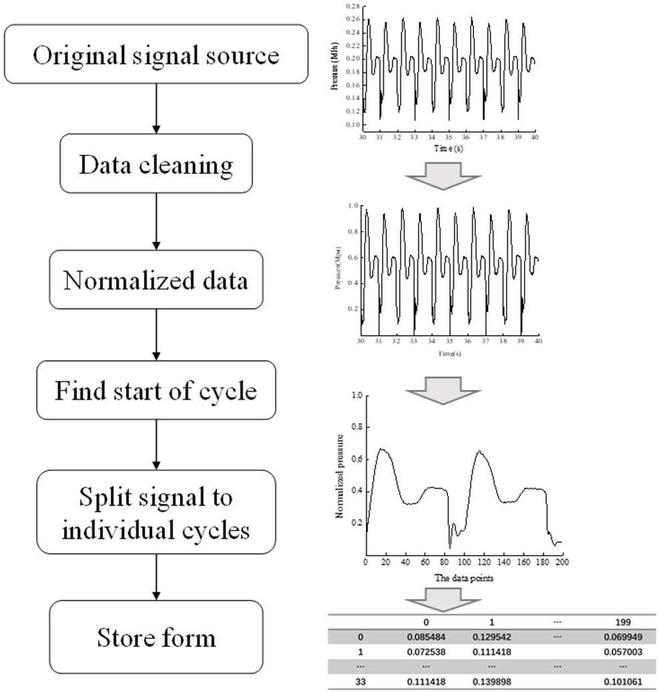
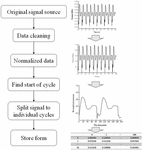
Figure 4 Flowchart of data preprocessing.
3.3 Data Preprocessing
Generally, there is some interference information in the raw data caused by errors of sensors and experimental setup. With data preprocessing, the redundant information in raw data can be eliminated, thereby facilitating the following feature extraction and learning processes. Figures 3(a), 3(c), and 3(e) show the intercepted raw data of pressure, flowrate, and exergy, respectively. Figure 4 shows the flowchart of data preprocessing. In this study, the data preprocessing is conducted in Python. First, the missing data and anomalous data are detected and handled. Normalization is then performed for mapping data into the section [0, 1] without changing the distribution of raw data. Figures 3(b), 3(d), and 3(f) show the intercepted normalized data of pressure, flowrate, and exergy, respectively. Due to the periodicity of raw data, the cycle segmentation is conducted, and the raw data flow is split into individual cycles corresponding to a single operation cycle of a pneumatic cylinder. Each cycle of the pneumatic cylinder is regarded as a sample used for feature extraction and machine learning. The frequency of data acquisition is set as 100 Hz and the period of one cycle of the cylinder is set as 2 seconds. Thus, one sample contains 200 data points as shown in Figures 3(b), 3(d), and 3(f). The start of the cycle is identified through a peak-detection method in Python. Finally, the samples are stored in a table. In this study, training data and test data are preprocessed using the same methods. Besides, it is evident that the profile of exergy is more similar to that of flowrate from Figure 3. This means the exergy is more flowrate dependent. According to Equation (3), there is a logarithm relation between exergy and pressure, and there is a positive proportional relationship between exergy and flowrate. Thus, the change of exergy is relatively small when the pressure changes.

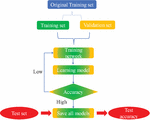
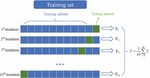
Figure 5 Process of machine learning.
3.4 Machine Learning Methods
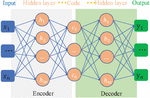
Figure 5 shows the flowchart of the training and testing classifier model with machine learning. The dimensions of a single preprocessed sample are 200. It is necessary to carry out a dimensionality reduction for feature extraction and selection. After testing and comparing the artificially defined features (mean value, kurtosis, peak value, and root-mean-square, etc.) with features extracted from PCA and AE (autoencoder), AE is here finally adopted as the method of feature extraction. There are many variants of AE, including SAE, VAE (variational autoencoder), and RAE (regular autoencoder), etc. According to the testing results, SAE is accepted in this study. Figure 6 shows the detailed structure of SAE. SAE is composed of several cascaded AEs with many hidden layers. Encoder and decoder are neural networks. In the encoder, the high dimensional data can be significantly reduced to the latent features with very low dimensions. The decoder can restore the low-dimensional features to the original high-dimensional data, which could be used for verifying the performance of SAE.
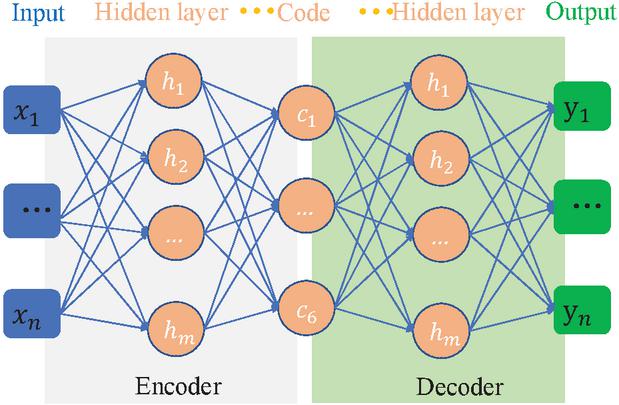
Figure 6 Structure of SAE.
The extracted and selected features from SAE are sent to the machine learning model to train the classifier. In this study, SVM is the dominating method used for supervised learning of the classifier by taking advantage of its outstanding performance in handling small sample data sets. Then the neural network method is used for comparison. The performance of the classifier model is continually evaluated and optimized by adjusting the parameters of SAE and SVM. Finally, the testing data sets are utilized to validate the accuracy of the classifier.
3.5 Experiments
Table 1 shows the normal and faulty conditions used in experiment #1, including two normal operating conditions and four external/internal leakage faults. Due to the periodicity and regularity of operations of the experimental pneumatic system, a small sample of data is acquired. In this study, the total training data set contain 480 (80 6) samples, and each sample is composed of 200 points. The experiment is repeated twice for acquiring data of training set and test set respectively. It is worth noting that the training set and test set are randomly selected from the original data sets. Training and test processes are repeated five times, and the final result is the average of five individual results. Finally, the training and test data sets of each operating condition consisted of 34 samples and 14 samples, respectively. Table 2 shows the numbers of the training and test set and the corresponding labels of the six different operating conditions.
Table 1 Normal and faulty conditions used in experiments
| Setting Pressure of | ||
| Operating Conditions | Degree of Fault | Regulating Value (MPa) |
| Normal #1 | None | 0.2 |
| External leakage #1 | The flowrate of leakage is about 20 L/min (the peak value of leakage). | 0.2 |
| Internal leakage #1 | The sealing ring is broken. | 0.2 |
| Normal #2 | None | 0.3 |
| External leakage #2 | The flowrate of leakage is about 20 L/min. | 0.3 |
| Internal leakage #2 | The sealing ring is broken. | 0.3 |
Table 2 Training and testing data sets and labels of different operating conditions
| Randomly Selected | Randomly Selected | ||
| Operating Conditions | Training Data Sets | Testing Data Sets | Label |
| Normal #1 | 34 | 14 | 0 |
| External leakage #1 | 34 | 14 | 1 |
| Internal leakage #1 | 34 | 14 | 5 |
| Normal #2 | 34 | 14 | 2 |
| External leakage #2 | 34 | 14 | 4 |
| Internal leakage #2 | 34 | 14 | 3 |
When the pressure change of the pneumatic system is not significant, it is predicted that detecting the change of operating condition is more difficult. It is necessary to investigate which kind of data among pressure, flowrate, and exergy is capable of detecting this small difference. Thus, another set, supplementary experiment #2, is conducted as shown in Table 3. The difference of pressure between two operating conditions is only 0.02 MPa.
Table 3 Detailed information of experiment #2
| Setting | Randomly | Randomly | ||
| Pressure | Selected | Selected | ||
| Operating | of Regulating | Training | Testing | |
| Conditions | Value (MPa) | Data Sets | Data Sets | Label |
| Normal #3 | 0.28 | 40 | 28 | 6 |
| Normal #4 | 0.30 | 40 | 28 | 7 |
After experiments, the acquired data is preprocessed and then sent to SAE for feature extraction and selection. Relu and Sigmoid are selected as the activation functions in SAE, and the SAE network structure is set as [200, 100, 50, 10, 2]. The number of hidden layers is set as 4 for the encoder, and the number of iterations is 300. The features after dimensionality reduction are sent to SVM model for learning. The kernel function of the SVM is RBF (Radial Basis Function), and the penalty factor and parameter of kernel function are 10 and 0.1, respectively. Five tests are conducted, and each accuracy of fault diagnosis is recorded.
4 Results and Discussions
In this section, the availabilities of SAE and SVM are verified with a loss curve and K-Fold Cross Validation. After that, the results of experiment #1 and experiment #2 are presented and discussed respectively. The diagnostic accuracy of various data (pressure, flowrate, and exergy) is compared and analysed. Then the results of different machine learning models (SAE SoftMax neural network model and SAE SVM model) are compared.
4.1 Availability Verification of SAE and SVM
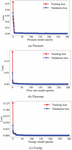
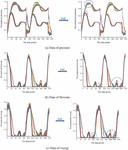
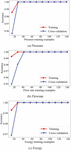
Because SAE belongs to the neural network and the size of the training dataset is very small, the overfitting problem is likely to appear. Thus, the validation dataset is split from the training data. And the loss curves of the training dataset and validation dataset are analysed for evaluating the overfitting of SAE model. The overfitting problems can be solved by optimizing hyperparameters (e.g., the number or the size of the layers). Figure 7 shows the loss curves of the training dataset and validation dataset of pressure, flowrate, and exergy, respectively. It is clear that the training loss and validation loss converge to zero, therefore, overfitting is not present. It also means the SAE model can effectively reduce dimensions and reconstruct the original data. Figures 8(a), (b), and (c) shows the original and reconstructed data of pressure, flowrate, and exergy, respectively. Each figure includes data of all six operating conditions in one test. As highlighted by circles, some distinguishing features can be more easily identified with reconstructed data of SAE.
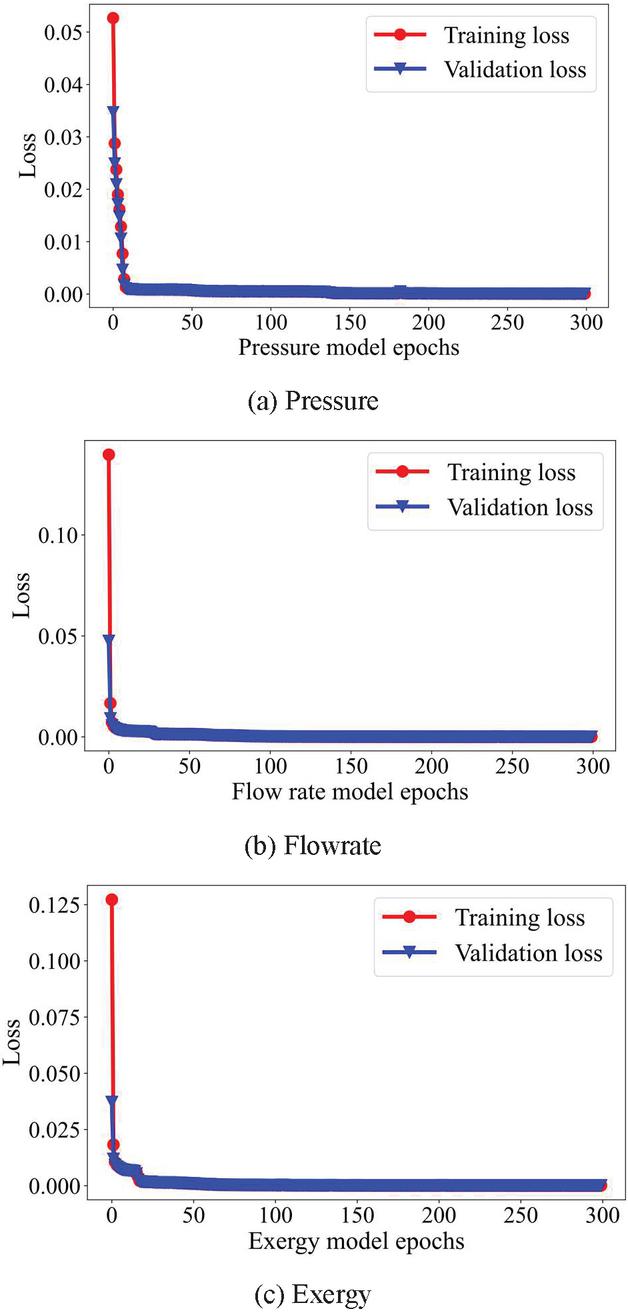
Figure 7 Loss curve of SAE.
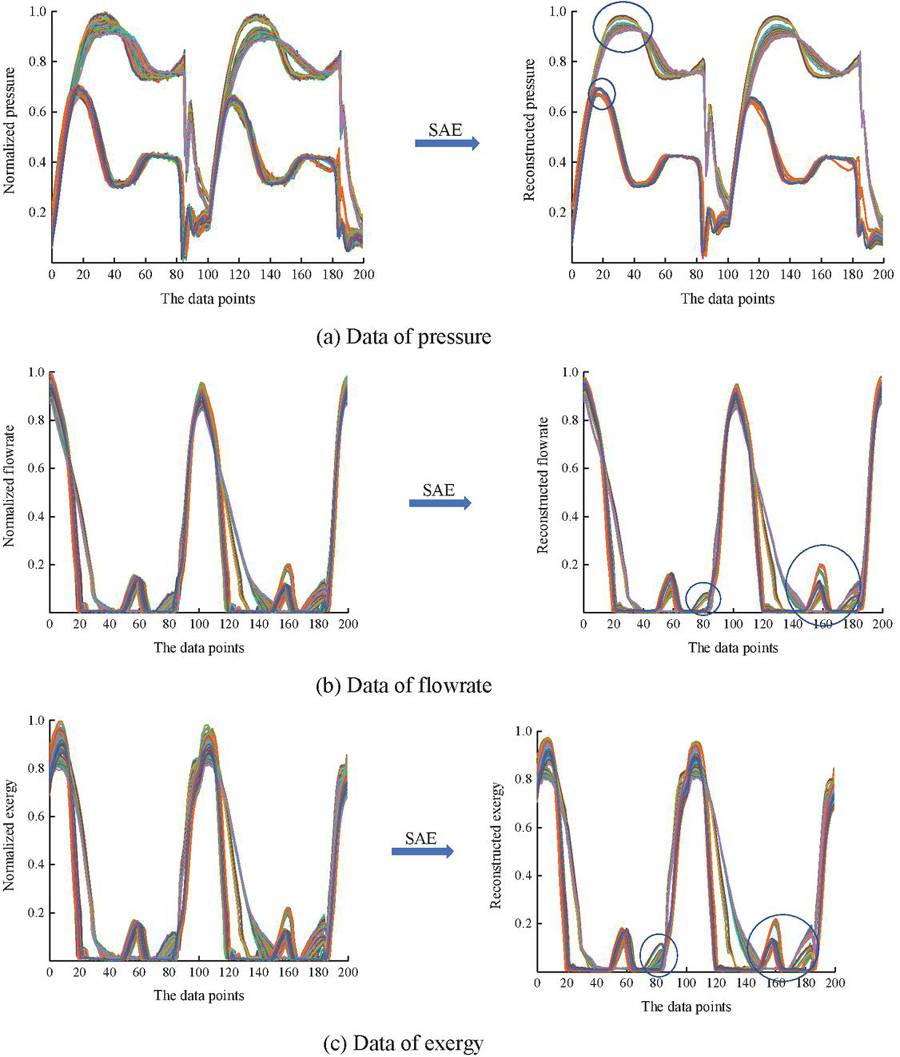
Figure 8 Original and reconstructed data of SAE.
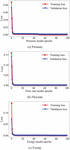
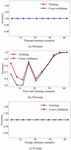
The aim of machine learning is to achieve generalized models that could perform well on never-before-seen data. Underfit will be evident if the established model is very simple, while overfit will appear if the model is too complex. In this study, the size of the training dataset is very small. As shown in Figure 9, the K-Fold Cross Validation method with hyperparameter c 10 is adopted to measure the general capacity of established models. Figure 10 shows the learning curves of different data with K-Fold Cross Validation. It is evident that the model performs well with validation sets and there is no overfitting.

Figure 9 K-Fold Cross Validation (K 10).
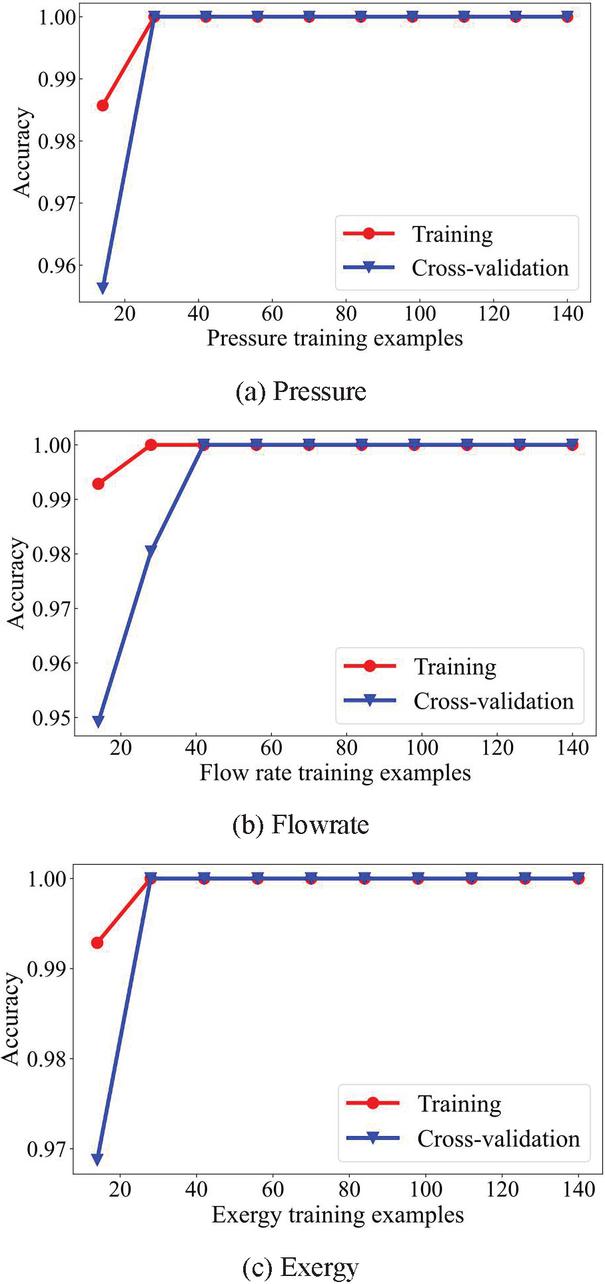
Figure 10 Learning curves of different data with K-fold cross validation0
4.2 Comparison of Pressure, Flowrate, and Exergy Results
4.2.1 Results and discussion of experiment #1
Table 4 shows the testing accuracy of various signals with SAE and SVM. The average accuracy of pressure, flowrate, and exergy are 83.6%, 97.4%, and 93.6%, respectively. The accuracy of test 2 and test 4 of the pressure signal are only 60% and 71% respectively. Overall, the established fault diagnosis models with flowrate and exergy data perform much better than that with pressure data.
Figure 11 shows the confusion matrices of various signals in test 2. In terms of pressure data, it is clear that normal #2 condition with label 2 and internal leakage #2 condition with label 3 cannot be accurately identified. Samples with label 2 and label 3 are rather indistinct, thereby contributing to an extremely low accuracy of 60%. On the other hand, samples of flowrate and exergy data can be accurately identified except for slightly ambiguous label 0 and label 5.
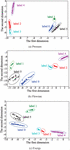
The results presented in Table 4 and Figure 11 are highly dependent on the feature extraction capacity of SAE model. In this study, the selected two-dimensional features of pressure, flowrate, and exergy data are visualized with the DBSCAN (Density-Based Spatial Clustering of Applications with Noise) clustering algorithm as shown in Figure 12. It is evident that SAE model performs better when extracting features of flowrate and exergy data than that of pressure data, especially in terms of label 2 and label 3.
Table 4 Testing accuracy of pressure, flowrate, and exergy signals in experiment #1
| Accuracy | |||
| Testing Number | Pressure | Flowrate | Exergy |
| (1) | 100% | 96% | 96% |
| (2) | 60% | 98% | 94% |
| (3) | 93% | 98% | 93% |
| (4) | 71% | 99% | 93% |
| (5) | 94% | 96% | 92% |
| Average accuracy | 83.6% | 97.4% | 93.6% |
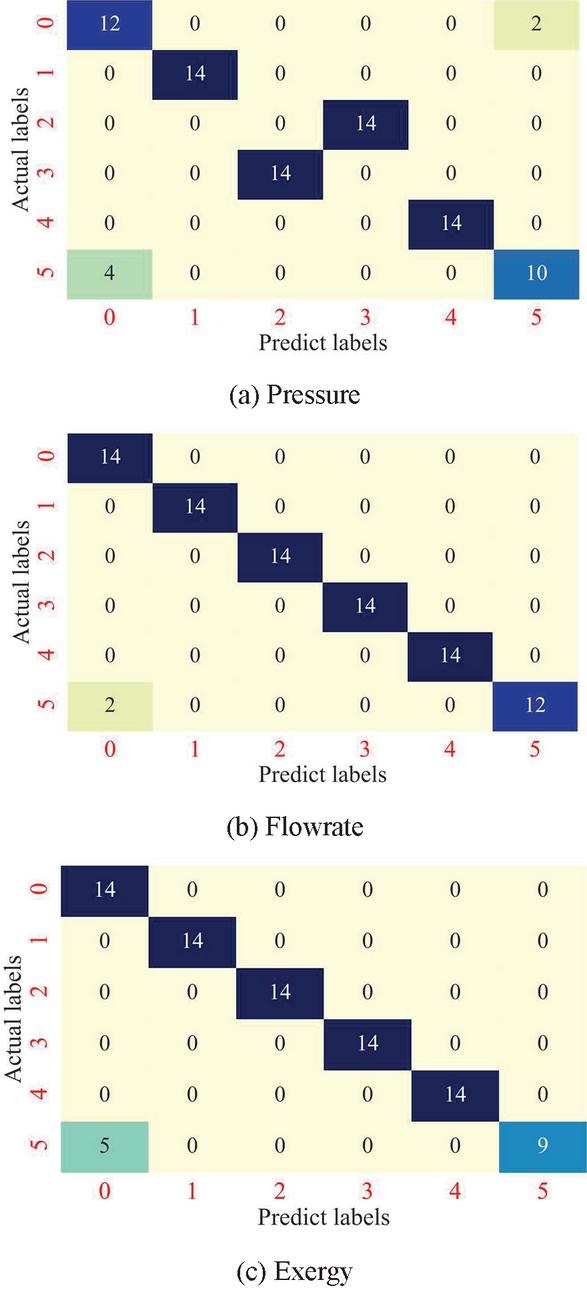
Figure 11 Confusion matrixes of various signals in test 2.
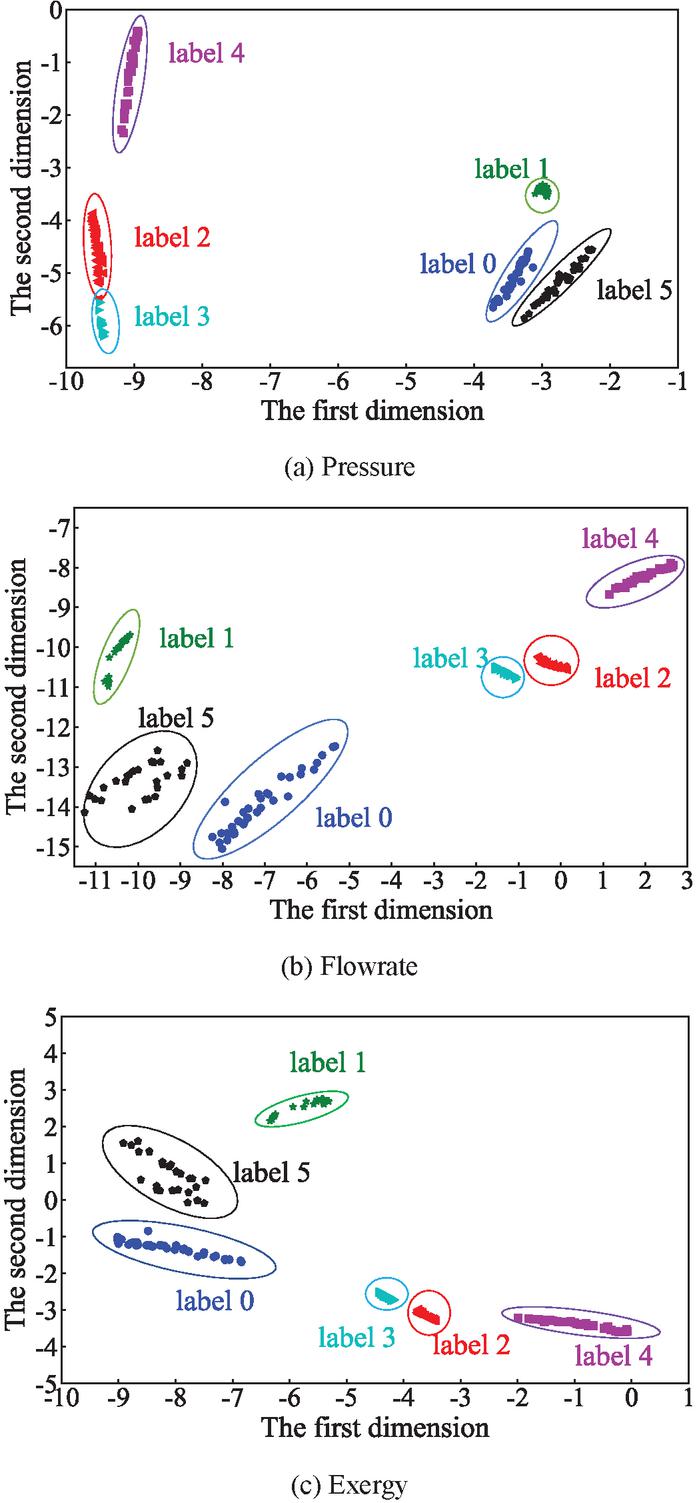
Figure 12 Visualization of selected features with DBSCAN clustering.
Exergy can be regarded as the fusion of pressure and flowrate. The diagnostic accuracy with exergy data is still very high even though the diagnostic accuracy with pressure data is extremely low. It implies that exergy is more significantly affected by flowrate rather than pressure. To validate this implication, the grey correlation analysis is conducted. Grey correlation analysis can measure the correlation among factors according to the similarity or difference of development trends of factors. The confusion between label 2 and label 3 directly contributes to the bad performance of pressure data. Thus, the data with label 2 and label 3 is selected for grey correlation analysis. In this study, exergy is regarded as the reference, and pressure and flowrate are used for comparisons. The results are shown in Table 5. It is clear that the correlation between flowrate and exergy is larger than the correlation between pressure and exergy. Exergy is more affected by flowrate than pressure in this experiment. Thus, the diagnostic accuracy with exergy data is almost as high as that with flowrate data. Nevertheless, the negative impact of pressure on exergy still cannot be neglected, which results in a relatively lower exergetic accuracy over flowrate.
Table 5 Grey correlation analysis of pressure, flowrate, and exergy
| Correlation of Label 2 | Correlation of Label 3 | |
| Pressure | 0.86 | 0.89 |
| Flowrate | 0.98 | 0.96 |
4.2.2 Results and discussion of experiment #2
Similar to those in Section 4.1, the loss curves and learning curves of pressure, flowrate, and exergy data are shown in Figures 13 and 14, respectively. The model performs well on validation sets and there is no overfitting. Table 6 shows the testing accuracy of various signals with SAE and SVM. The average accuracy of pressure, flowrate, and exergy are 100%, 93.4%, and 100%, respectively. The result of experiment #2 is opposite to that of experiment #1, and the accuracy of pressure is higher than that of flowrate. Table 7 shows the results of the grey correlation analysis. Exergy is still more affected by flowrate than pressure. However, in experiment #2, pressure imposes a positive impact on exergy, thereby contributing to a higher accuracy of exergy than flowrate.
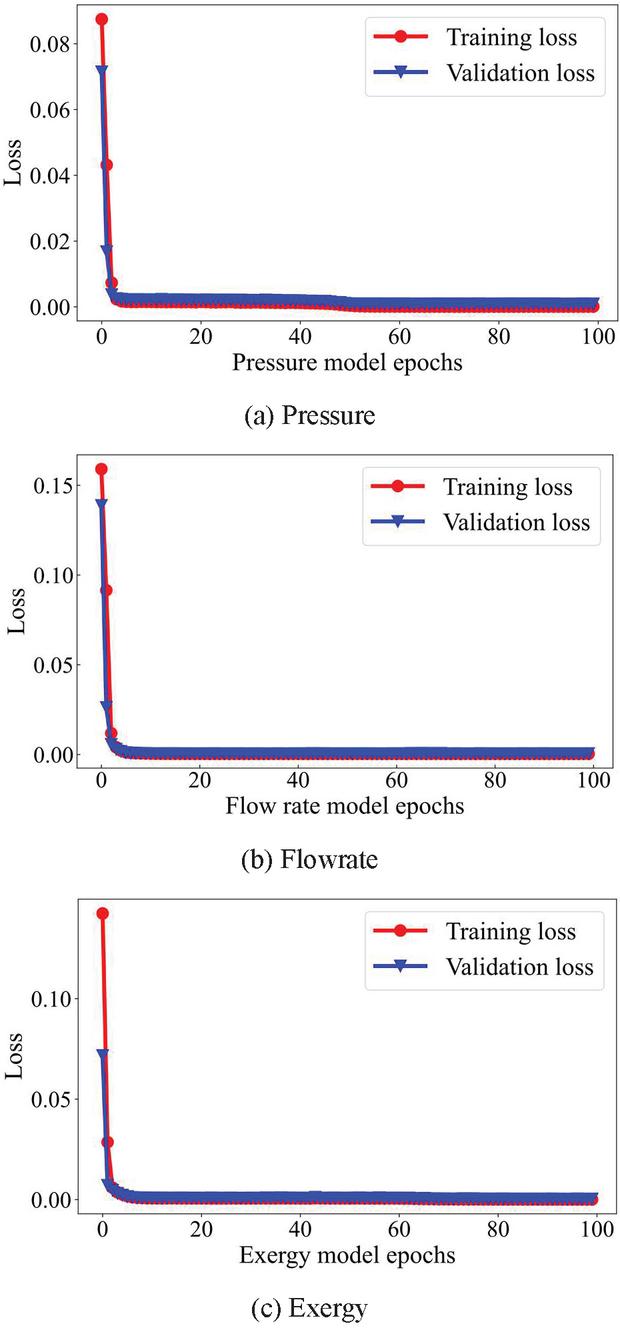
Figure 13 Loss curves of SAE in experiment #2.
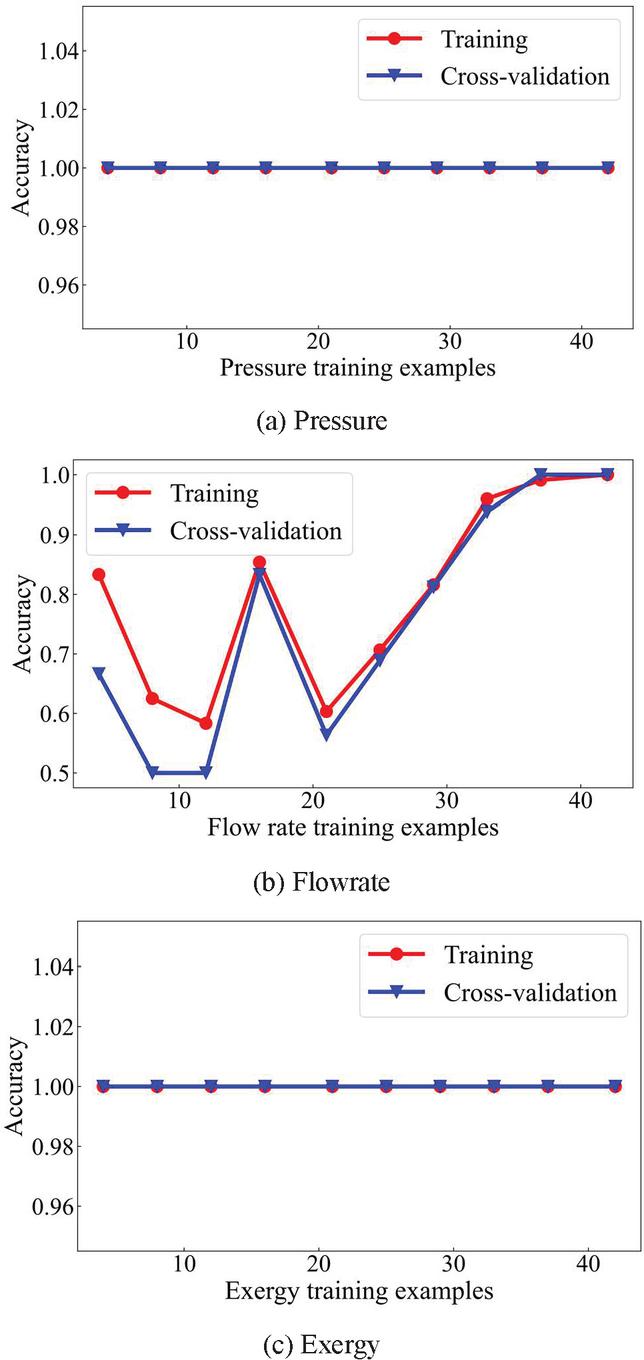
Figure 14 Learning curves of different data with K-Fold Cross Validation in experiment #2.
Table 6 Testing accuracy of pressure, flowrate, and exergy signals in experiment #2
| Accuracy | |||
| Testing Number | Pressure | Flowrate | Exergy |
| (1) | 100% | 93% | 100% |
| (2) | 100% | 92% | 100% |
| (3) | 100% | 95% | 100% |
| (4) | 100% | 94% | 100% |
| (5) | 100% | 93% | 100% |
| Average accuracy | 100% | 93.4% | 100% |
Table 7 Grey correlation analysis of pressure, flowrate, and exergy in experiment #2
| Correlation of Label 6 | Correlation of Label 7 | |
| Pressure | 0.78 | 0.8 |
| Flowrate | 0.98 | 0.93 |
According to the results of experiment #1 and #2, we could conclude that the diagnostic accuracy of pressure data and flowrate data are highly dependent on operating conditions, while the diagnostic accuracy of exergy data remains high irrespective of the operating conditions. The exergy is more affected by flowrate than pressure because the pressure change is not large in this study. The pressure could impose both positive and negative impacts on exergy under different operating conditions.
Although the accuracy of pressure and exergy are higher than that of flowrate as shown in Table 6. But it does not mean the flowrate loses its effectiveness in the Experiment #2. The average accuracy of flowrate is 93.4% which is still an acceptable result. This only means the pressure and exergy perform better than flowrate under these operating conditions.
4.3 Comparison of Different Machine Learning Methods
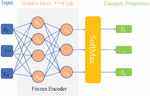
In order to explore if the results change with different machine learning methods, a SAE SoftMax neural network model is also studied to compare with SAE SVM model. Figure 15 shows the structure of the SAE SoftMax neural network model. SAE is used for dimensionality reduction and SoftMax is for classification. The weights of the encoder are frozen when training SAE. After training, the last two layers are unfrozen for fine tuning. The SAE SoftMax neural network model also runs 5 times for getting a final average accuracy.
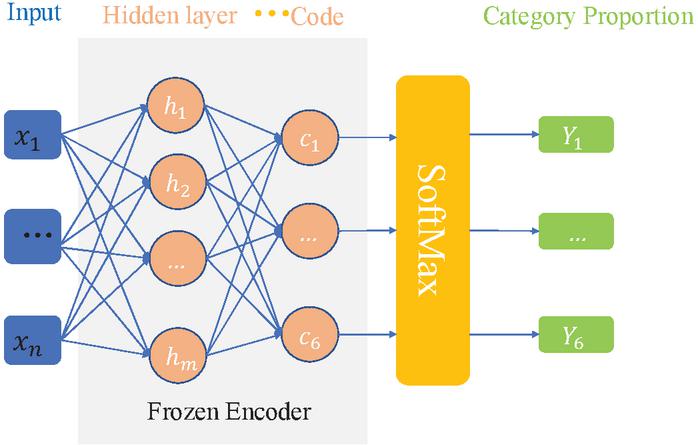
Figure 15 Structure of SAE SoftMax neural network model.
Table 8 Testing accuracy of various signals with SAE SoftMax in experiment #1
| Accuracy | |||
| Testing Number | Pressure | Flowrate | Exergy |
| (1) | 95% | 95% | 94% |
| (2) | 97% | 85% | 87% |
| (3) | 70% | 94% | 85% |
| (4) | 85% | 94% | 89% |
| (5) | 76% | 94% | 93% |
| Average accuracy | 84.6% | 92.4% | 89.6% |
Table 9 Testing accuracy of various signals with SAE SoftMax in experiment #2
| Accuracy | |||
| Testing Number | Pressure | Flowrate | Exergy |
| (1) | 100% | 50% | 100% |
| (2) | 100% | 100% | 100% |
| (3) | 100% | 100% | 100% |
| (4) | 100% | 79% | 50% |
| (5) | 100% | 73% | 100% |
| Average accuracy | 100% | 80.4% | 90% |
Tables 8 and 9 show the testing accuracy of various signals with SAE SoftMax model in experiment #1 and experiment #2 respectively. Overall, the accuracy of SAE SoftMax is lower than that of SAE SVM. This is mainly because the number of samples in the training set is too small for a neural network model while SVM is good at learning with small sample data sets. Nevertheless, it is clear that the trends are consistent with the results of the SAE SVM model. For experiment #1, the diagnostic accuracy of exergy data is lower than that of flowrate data but higher than that of pressure data. For experiment #2, the diagnostic accuracy of the exergy data is lower than that of pressure data but higher than that of flowrate data.
There is no doubt that the accuracy of diagnosis could be improved with a more sophisticated machine learning method. Whatever methods are used, the accuracy of diagnosis is mainly dependent on if the ‘changes’ caused by the faults could be effectively identified by the machine learning algorithm. With the same machine learning method, which data is better? It is decided by the change of which data is more evident and can be easier identified. In the Experiment #1, the change of flowrate is more evident than that of pressure when comparing the normal and fault conditions under the same operating pressure. Therefore, the accuracy of flowrate is higher than that of pressure. While, in the Experiment #2, the change of pressure is more evident than that of flowrate although the pressure difference is only 0.02 MPa. Therefore, the accuracy of pressure is higher than that of flowrate. It should also be noted that the result of accuracy is an averaged value. It varies in individual tests, especially in Experiment #1 when the operating conditions are more complex than those in Experiment #2. The accuracy of pressure is higher than that of flowrate in test (1) in Table 4 and test (2) in Table 8, although the average accuracy of pressure is much lower than that of flowrate.
5 Conclusions
Intelligent Manufacturing and Green Manufacturing are pushing manufacturing enterprises to upgrade their FDD and energy management systems. Pneumatic components and systems are widely used in manufacturing sectors. However, compared with other power transmission technologies, FDD and energy management of pneumatic technology are trailing behind due to various factors. In this study, based on a Fault-Energy-Quality nexus framework, we have integrated energy management and fault diagnostics/prognostics of pneumatic components and systems. This study is the first attempt to prove the fundamental hypothesis that there is a mapping relationship between energy modes and fault modes in pneumatic components/systems. Exergy is adopted to evaluate the energy performance of compressed air. Machine learning methods are used for establishing FDD models. A typical pneumatic circuit with a pneumatic cylinder was taken here as an example for the experiment. The main conclusions from this study are:
• Exergy could be used for evaluating energy performance and also for representing the fault conditions of pneumatic systems and components.
• Pressure, flowrate, and exergy data are all effective for fault detection and diagnosis in pneumatic systems. However, the indicator performance of these data is highly dependent on operating conditions and systems/components. Nevertheless, the exergy data, as a fusion of pressure and flowrate, is always effective with high accuracy.
• Data-based machine learning is a powerful enabler of FDD for pneumatic systems and components, although different accuracy is obtained with different methods. The advantage of exergy data is its consistency in performing well with different machine learning methods.
• With upstream sensor data, internal and external leakages of a downstream pneumatic cylinder can be successfully detected and diagnosed. This implies that it is possible to detect and diagnose more faults with fewer sensors in pneumatic systems with the help of exergy and machine learning.
This study attempts to develop a new exergy-based maintenance approach for complex pneumatic systems. Even though the experiments and models are not very complex, the preliminary results substantiate that it is feasible to develop an exergy-based maintenance program in simple pneumatic systems. What about complex systems with more components and more faults? This issue will be investigated in our next study.
Acknowledgements
This work was supported by the National Natural Science Foundation of China under Grant [number 51905066 and number 62002039].
References
[1] Linke BS, Sutherland JW. Introduction to Energy Efficient Manufacturing. John Wiley & Sons, Ltd. 2018.
[2] Zhou B, Qi Y, Liu Y. Proactive preventive maintenance policy for buffered serial production systems based on energy saving opportunistic windows. Journal of Cleaner Production 2020; 253: 119791. https://doi.org/10.1016/j.jclepro.2019.119791.
[3] Bermeo-Ayerbe MA, Ocampo-Martinez C, Diaz-Rozo J. Data-driven energy prediction modeling for both energy efficiency and maintenance in smart manufacturing systems. Energy 2022; 238: 121691. https://doi.org/10.1016/j.energy.2021.121691.
[4] Hoang A, Do P, Iung B. Energy efficiency performance-based prognostics for aided maintenance decision-making: Application to a manufacturing platform. Journal of Cleaner Production 2017; 142: 2838–2857. https://doi.org/10.1016/j.jclepro.2016.10.185.
[5] Sun Z, Dababneh F, Li L. Joint Energy, Maintenance, and Throughput Modeling for Sustainable Manufacturing Systems. IEEE Transactions on Systems, Man, and Cybernetics: Systems 2020; 50(6): 2101–2112. DOI: 10.1109/TSMC.2018.2799740.
[6] Orošnjak M, Jocanović M, Čavić M, Karanović V, Penčić M. Industrial maintenance 4(.0) Horizon Europe: Consequences of the Iron Curtain and Energy-Based Maintenance. Journal of Cleaner Production 2021; 314: 128034. https://doi.org/10.1016/j.jclepro.2021.128034.
[7] Cummins JJ, Thomas S, Nash CJ, Justice A, Mahadevan S, Adams DE, Barth EJ. Experimental evaluation of the efficiency of a pneumatic strain energy accumulator. International Journal of Fluid Power 2017; 18: 167–180. https://doi.org/10.1080/14399776.2017.1335141.
[8] Heidingsfeld M, Horio R, Baesch B, Riethmüller C, Gresser GT, Sawodny O. Introduction, mathematical modelling and motion control of the novel pneumatic textile actuator. International Journal of Fluid Power 2017; 18: 92–101. https://doi.org/10.1080/14399776.2016.1265875.
[9] Shi K, Zheng H, Li J, Bao G. Study on the Articulated Finger Based on Pneumatic Soft Joint. International Journal of Fluid Power 2021; 22: 277–292. https://doi.org/10.13052/ijfp1439-9776.2226.
[10] Cummins JJ, Nash CJ, Thomas S, Justice A, Mahadevan S, Adams DE, Barth EJ. Energy conservation in industrial pneumatics: A state model for predicting energetic savings using a novel pneumatic strain energy accumulator. Applied Energy 2017; 198: 239–249. https://doi.org/10.1016/j.apenergy.2017.04.036.
[11] Tong Z, Wang H, Xiong W, Ting DSK, Carriveau R, Wang Z. Accumulated and transient exergy analyses of pneumatic systems with isochoric and isobaric compressed air storage tanks. Energy Storage 2021; 3(6): e269. https://doi.org/10.1002/est2.269.
[12] Benedettia M, Bonfà F, Bertini I, Introna V, Ubertini S. Explorative study on Compressed Air Systems’ energy efficiency in production and use: First steps towards the creation of a benchmarking system for large and energy-intensive industrial firms. Applied Energy 2018; 227: 436–448. https://doi.org/10.1016/j.apenergy.2017.07.100.
[13] Salvatori S, Benedetti M, Bonfà F, Introna V, Ubertini S. Inter-sectorial benchmarking of compressed air generation energy performance: Methodology based on real data gathering in large and energy-intensive industrial firms. Applied Energy 2018; 217: 266–280. https://doi.org/10.1016/j.apenergy.2018.02.139.
[14] AVENTICS. https://www.emerson.com/en-us/automation/brands/aventics [Accessed 27-4-2022].
[15] Festo Automation Experience. https://www.festo.com/us/en/e/solutions/digitalization-of-production/software-for-industrial-production/festo-automation-experience-id\_408724/\# [Accessed 27-4-2022].
[16] AVENTICS. Smart Pneumatics Opportunities for Industry Through Intelligent Pneumatics. Germany: AVENTICS GmbH, 2018. https://www.aventics.com/media/AVENTICS\_USA/Service/Documentation\_downloads/Sales\_Catalog/AVENTICS-Smart-Pneumatics\_IoT\_R500000017.pdf.
[17] FESTO. Energy efficiency modules MSE6, MSE series. Germany: Festo, 2019. https://www.festo.com/cat/en-gb\_gb/data/doc\_ENGB/PDF/EN/MSE6\_EN.PDF.
[18] SMC. Maintenance Parts List. (https://ca01.smcworld.com/catalog/smc-maint/mpv/m-e11-9-buhie/data/m-e11-9-buhie.pdf) [Accessed 12-3-2022].
[19] Compressed Air & Gas Institute. Compressed Air and Gas Handbook. (https://www.cagi.org/education/handbook.aspx) [Accessed 12-3-2022].
[20] Barner A, Bredau J, Schiller F. Efficient Drive-Based Analysis of Fault Detection Measures in Safety-Related Pneumatic Systems. 21st International Workshop on Principles of Diagnosis, 2010. https://doi.org/10.36001/phmconf.2010.v2i1.1918.
[21] Guo B, Qi F, Fu G. A Knowledge-Based Diagnostic System for Pneumatic System. 2008 International Symposium on Knowledge Acquisition and Modeling, 2008. DOI: 10.1109/KAM.2008.159.
[22] Guo J, Zhao G, Dong C. Fault Diagnosis of Air Pressure Drive System Based on Expert System. Hydraulics Pneumatics & Seals 2008(6): 11–14.
[23] Wang X, Gao L, Tao G. Research on expert system of fault detection and diagnosing for pneumatic system of automatic production line. Chinese Journal of Mechanical Engineering 2002; 15(2): 136–141. DOI:10.3901/CJME.2002.02.136.
[24] Zhang D, Hao J, Chen L, Zhou L. Fault Diagnosis Approach for Pneumatic Control Valves Based on Modified Expert System. 2020 19th International Symposium on Distributed Computing and Applications for Business Engineering and Science (DCABES). DOI: 10.1109/DCABES50732.2020.00035.
[25] Bhagya RN, Santhosh KV. Is Fault Detection and Diagnosis in Pneumatic Actuator A Topic of Concern? Journal of Advanced Research in Fluid Mechanics and Thermal Sciences 2021; 77(2): 102–129. DOI: 10.37934/arfmts.77.2.102129.
[26] Daigle M, Kulkarni CS, Gorospe G. Application of Model-based Prognostics to a Pneumatic Valves Testbed. IEEE Aerospace Conference Proceedings, March 2014. DOI: 10.1109/AERO.2014.6836319.
[27] Engelberth T, Krawczyk D, Verl A. Model-based method for condition monitoring and diagnosis of compressors. Procedia CIRP 2018; 72: 1321–1326. https://doi.org/10.1016/j.procir.2018.03.271.
[28] Grewal KS, Dixon R, Goodall R, Pearson J. Model-based Fault Detection and Control Design-Applied to a Pneumatic Industrial Application. 5th IFAC Symposium on Mechatronic Systems. Cambridge, MA, USA, Sept 13–15, 2010. https://doi.org/10.3182/20100913-3-US-2015.00093.
[29] Nagel T, Elarfaoui T, Liu S. Observer Based Leak Diagnosis for Pneumatic Systems in Commercial Vehicles. 2012 American Control Conference, Fairmont Queen Elizabeth, Montréal, Canada, June 27–June 29, 2012. DOI: 10.1109/ACC.2012.6315437.
[30] Rahman BM, Busch GT, Ahmed Q, Rizzoni G. Structural Analysis-Based Fault Diagnosis of Pneumatic Systems. Proceedings of the ASME 2016 Dynamic Systems and Control Conference DSCC2016, October 12–14, 2016, Minneapolis, Minnesota, USA. https://doi.org/10.1115/DSCC2016-9888.
[31] Rahman BM, Busch GT, Ahmed Q, Rizzoni G. Fault Diagnosis of Pneumatic Systems: Application of a Systematic Model-Based Methodology. IFAC PapersOnLine 2017; 50: 3294–3300. https://doi.org/10.1016/j.ifacol.2017.08.505.
[32] Huang T, Zhang Q, Tang X, Zhao S, Lu X. A novel fault diagnosis method based on CNN and LSTM and its application in fault diagnosis for complex systems. Artificial Intelligence Review 2022; 55:1289–1315. https://doi.org/10.1007/s10462-021-09993-z.
[33] Nath AG, Udmale SS, Singh SK. Role of artificial intelligence in rotor fault diagnosis: a comprehensive review. Artificial Intelligence Review 2021; 54: 2609–2668. https://doi.org/10.1007/s10462-020-09910-w.
[34] Leu VK, Sun Y, Chen L, Fang M, Zhang M. Research on Fault Diagnosis Method of Pneumatic Circuit Used Bidirectional LSTM Neural Network. Computer & Digital Engineering 2022; 50(2): 367–372. DOI: 10.3969/j.issn.1672-9722.2022.02.027.
[35] Li X, Kao I. Analytical Fault Detection and Diagnosis(FDD)for Pneumatic Systems in Robotics and Manufacturing Automation. 2005 IEEE/RSJ International Conference on Intelligent Robots and Systems. Canada: IEEE, 2005: 2517–2522. DOI: 10.1109/IROS.2005.1545573.
[36] Demetgul M, Tansel IN, Taskin S. Fault diagnosis of pneumatic systems with artificial neural network algorithms. Expert Systems with Applications 2009; 36: 10512–10519. https://doi.org/10.1016/j.eswa.2009.01.028.
[37] Zachrison A, Sethson M. Detection of system changes for a pneumatic cylinder using self-organizing maps. Proceedings of the 2006 IEEE Conference on Computer Aided Control Systems Design, Munich, Germany, October 4–6, 2006. DOI: 10.1109/CACSD-CCA-ISIC.2006.4777056.
[38] Santolamazza A, Cesarotti V, Introna V. Anomaly detection in energy consumption for condition-based maintenance of compressed air generation systems an approach based on artificial neural networks. IFAC PapersOnLine 2018; 51: 1131–1136. https://doi.org/10.1016/j.ifacol.2018.08.439.
[39] Santolamazza A, Cesarotti V, Introna V. Evaluation of machine learning techniques to enact energy consumption control of compressed air generation in production plants. Conference: XXIII Summer School “Francesco Turco” – Industrial Systems Engineering, Palermo, Italy September 2018, 79–86.
[40] Benedetti M, Bonfà F, Introna V, Santolamazza A, Ubertini S. Real Time Energy Performance Control for Industrial Compressed Air Systems: Methodology and Applications. Energies 2019; 12(20): 3935. https://doi.org/10.3390/en12203935.
[41] Bonfá F, Benedetti M, Ubertini S, Introna V, Santolamazza A. New efficiency opportunities arising from intelligent real time control tools applications the case of Compressed Air Systems’ energy efficiency in production and use. Energy Procedia 2019; 158: 4198–4203. https://doi.org/10.1016/j.egypro.2019.01.809.
[42] Abela K, Refalo P, Francalanza E. Analysis of pneumatic parameters to identify leakages and faults on the demand side of a compressed air system. Cleaner Engineering and Technology 2022; 6: 100355. https://doi.org/10.1016/j.clet.2021.100355.
[43] Abela K, Refalo P, Francalanza E. Design and implementation of an energy monitoring cyber physical system in pneumatic automation. Procedia CIRP 2020; 88: 240–245. https://doi.org/10.1016/j.procir.2020.05.043.
[44] Ertel W, Lehmann R, Medow R, Finkbeiner M, Meyer A. Model Free Diagnosis of Pneumatic Systems using Machine Learning. The 9th International Fluid Power Conference, March 24–26, 2014, Aachen, Germany.
[45] Kovacs T, Ko A. Monitoring Pneumatic Actuators’ Behavior Using Real-World Data Set. SN Computer Science 2020; 1: 196. https://doi.org/10.1007/s42979-020-00202-2.
[46] Qi G, Zhu Z, Erqinhu K, Chen Y, Chai Y, Sun J. Fault-diagnosis for reciprocating compressors using big data and machine learning. Simulation Modelling Practice and Theory 2018; 80: 104–127. https://doi.org/10.1016/j.simpat.2017.10.005.
[47] Mahmoud H, Vlasic F, Mazal P, Jana M. Leakage analysis of pneumatic cylinders using acoustic emission. Insight – Non-Destructive Testing and Condition Monitoring 2017; 59(9): 500–505. DOI: 10.1784/insi.2017.59.9.500.
[48] Czopek D, Gryboś D, Leszczyñski J, Wiciak J. Identification of energy wastes through sound analysis in compressed air systems. Energy 2022; 239: 122122. https://doi.org/10.1016/j.energy.2021.122122.
[49] Andrade A, Lopes K, Lima B, Maitelli A. Development of a Methodology Using Artificial Neural Network in the Detection and Diagnosis of Faults for Pneumatic Control Valves. Sensors 2021; 21: 853. https://doi.org/10.3390/s21030853.
[50] Kowsalya A, Kannapiran B. Principal Component Analysis Based Approach for Fault Diagnosis in Pneumatic Valve Using DAMADICS Benchmark Simulator. International Journal of Research in Engineering and Technology 2014; 3(7): 702–707. DOI: 10.15623/ijret.2014.0319125.
[51] Subbaraj P, Kannapiran B. Artificial Neural Network Approach for Fault Detection in Pneumatic Valve in Cooler Water Spray System. International Journal of Computer Applications 2010; 9(7): 24–28. DOI: 10.5120/1395-1881.
[52] Subbaraj P, Kannapiran B. Fault detection and diagnosis of pneumatic valve using Adaptive Neuro-Fuzzy Inference System approach. Applied Soft Computing 2014; 19: 362–371. https://doi.org/10.1016/j.asoc.2014.02.008.
[53] Sundarmahesh R, Kannapiran B. Fault Diagnosis of Pneumatic Valve with DAMADICS Simulator using ANN based Classifier Approach. IJCA Proceedings on International Conference on Innovations In Intelligent Instrumentation, Optimization and Electrical Sciences. Foundation of Computer Science (FCS), 2013.
[54] Wang Y, Wu J. A fault diagnosis method for pneumatic regulating valve based on PCA and Bayesian classification. China Measurement & Test 2019; 45(12): 112–118. In Chinese.
[55] Nourin FN, Espindola J, Selim OM, Amano RS. Energy, Exergy, and Emission Analysis on Industrial Air Compressors. Journal of Energy Resources Technology 2022; 144: 042104. DOI: 10.1115/1.4051682.
[56] Shi Y, Cai M, Xu W, Wang Y. Methods to Evaluate and Measure Power of Pneumatic System and Their Applications. Chinese Journal of Mechanical Engineering 2019; 32: 42. https://doi.org/10.1186/s10033-019-0354-6.
[57] Taheri K, Gadow R. Industrial compressed air system analysis Exergy and thermoeconomic analysis. CIRP Journal of Manufacturing Science and Technology 2017; 18: 10–17. https://doi.org/10.1016/j.cirpj.2017.04.004.
[58] Wang Z, Xiong W, Wang H, Wang Z. Exergy analysis of the pneumatic line throwing system. International Journal of Exergy 2016; 19(3): 364–379. DOI: 10.1504/IJEX.2016.075669.
[59] Dincer I, Rosen MA. Exergy: Energy, Environment and Sustainable Development, 3nd ed., Elsevier, London, 2020.
[60] Kartal F, Özveren U. Investigation of the chemical exergy of torrefied biomass from raw biomass by means of machine learning. Biomass and Bioenergy 2022; 159: 106383. https://doi.org/10.1016/j.biombioe.2022.106383.
[61] Kerdan IG, Gálvez DM. Artificial neural network structure optimisation for accurately prediction of exergy, comfort and life cycle cost performance of a low energy building. Applied Energy 2020; 280: 115862. https://doi.org/10.1016/j.apenergy.2020.115862.
[62] James C, Kim TY, Jane R. A Review of Exergy Based Optimization and Control. Processes 2020; 8: 364. https://doi.org/10.3390/pr8030364.
[63] Jane R, Kim TY, Glass E, Mossman E, James C. Tailoring Mission Effectiveness and Efficiency of a Ground Vehicle Using Exergy-Based Model Predictive Control (MPC). Energies 2021; 14: 6049. https://doi.org/10.3390/en14196049.
Biographies

Zhiwen Wang received the bachelor’s degree in Marine Engineering from Dalian Maritime University in 2012 and the philosophy of doctorate degree in Marine Engineering from Dalian Maritime University in 2018, respectively. He is currently working as an Associate Professor at the Department of Mechanical Engineering, Dalian Maritime University. His research areas include energy saving and FDD of pneumatics, thermodynamics, and energy storage.

Bo Yang received the bachelor’s degree in Mechanical Engineering from Zaozhuang University in 2020. He is now pursing the master’s degree in Mechanical Engineering in Dalian Maritime University. His research areas include energy saving and FDD of pneumatics, and machine learning.

Qian Ma received her B.D., M.D. and Ph.D. degrees in computer software and theory from Northeastern University in 2011, 2013, and 2019, respectively. She is currently an associate professor with the College of Information Science and Technology, Dalian Maritime University, Dalian, China. Her research interests include missing data imputation, data management and artificial intelligence.

Hu Wang received the bachelor’s degree in Mechanical Engineering from Ludong University in 2019 and the master’s degree in Mechanical Engineering from Dalian Maritime University in 2022, respectively. He is currently pursuing the doctorate degree in Dalian Maritime University. His research areas include energy storage, and fluid power transmission and control.

Rupp Carriveau is a Professor of Civil and Environmental Engineering, University of Windsor, Canada. He is the director of Turbulence & Energy Lab. He received his BSc in Civil Structural Engineering from University of Windsor. He obtained his MSc and PhD in Fluids Engineering from Western University, Canada. His research interests cover energy storage, renewable energy, and systems optimization etc.

David S-K. Ting is a Professor of Mechanical, Automotive & Materials Engineering, University of Windsor, Canada. He received his BSc in 1989 from University of Manitoba. He obtained his MSc and PhD in 1992 and 1995 from University of Alberta, Canada. His major research interests are turbulence, heat transfer, energy & thermal systems, renewable energy, and aerodynamics.

Wei Xiong is a Professor of Mechanical Engineering, Dalian Maritime University. He is the director of Ship Electromechanical Equipment Institute. He received his PhD in the Faculty of Mechatronic Engineering from Harbin Institute of Technology, China. His major research interests are fluid power and control, marine rescue, and compressed air energy storage.
International Journal of Fluid Power, Vol. 24_4, 643–682.
doi: 10.13052/ijfp1439-9776.2442
© 2023 River Publishers