A Method for the Camera-less Remote Surveillance on Hydraulically Actuated Heavy Equipment Using IoT Environment
Victor Zhidchenko* and Heikki Handroos
Laboratory of Intelligent Machines, LUT University, Lappeenranta, Finland
E-mail: Victor.Zhidchenko@lut.fi; Heikki.Handroos@lut.fi
*Corresponding Author
Received 09 June 2022; Accepted 21 July 2022; Publication 12 September 2022
Abstract
The paper considers the proposed method for the camera-less remote surveillance on hydraulically actuated heavy equipment. The method uses the data about the pressure and position of hydraulic actuators as an input. These data are transmitted over the internet in the Internet of Things (IoT) environment to the IoT cloud computing platform. A simulation model consisting of hydraulic and multibody dynamics submodels composes the digital twin of the machine under surveillance. This digital twin is maintained and calculated in the cloud. It reproduces the movements of the machine and calculates the forces acting in it. Together with the GPS coordinates, these data provide the full information on the machine operation. As a result, the productivity of the machine can be estimated, the misuse can be detected, and the load history can be gathered in order to estimate the remaining life of the machine or to plan the maintenance activities. The influence of the sensor accuracy on the simulation results is evaluated. The experimental results are presented that verify the feasibility of the proposed method on the example case of hydraulic mobile crane.
Keywords: Simulation, dynamic model, hydraulic model, heavy equipment, mobile working machines, Digital Twin, Internet of Things, IoT.
1 Introduction
Heavy equipment used in construction, mining and agriculture segments (such as the cranes, the excavators, the loaders, the tractors, the dozers) is an expensive asset. In order to decrease the cost of ownership, the users and owners of the machines usually make efforts to maximize their usage [1]. Equipment monitoring helps to solve this task by providing the information about the state of the machine and in some cases about its productivity. With the expansion of Internet of Things (IoT), many remote monitoring solutions have been created as the components of the fleet management systems. Currently available solutions gather primarily the sensor data about the condition of the machine, such as its GPS coordinates, the level of fuel, the speed of motors and pumps rotation, the temperature of the engine, the voltage supplied by the battery, the position of some parts. The description of several fleet management systems which are utilized by the companies in the mining industry is given in [2]. The tasks being solved by the fleet management systems in the maritime transport sector are described in [3].
The systems mentioned above use the so-called data-driven approach [4]. They monitor the data to be within predefined bounds and discover the trends and correlations in the sensor data that produce new information. This approach usually does not require the knowledge about the physical laws that govern data dependencies. It allows to use the same data processing methods in different domains, but the capabilities of data analysis are usually limited with the methods of statistics and approximation. In contrast, the model-driven approach uses the sensor data as an input to the simulation model of the object. An ability to gather sensor data from the remote objects and to process them in real time provided by the modern IoT environments, has led to the emergence of the Digital Twin concept. Many definitions of the term “Digital Twin” exist [5], but the common idea is to use some simulation model simultaneously with a real object to get the information about the object from the sensor data. The digital twin can also be limited to statistical processing of data, but the model-based digital twins are expected to become the main consumers of IoT data [4]. The model accounts for data interdependencies governed by the physical laws and thus can provide the results unavailable with data-driven approach.
Some applications use kinematic models of the machines to control the work at the worksite and to monitor the productivity of the machines [6, 7]. Dynamic models are extensively used in control tasks within the state observers [8].
This work considers the use of kinematic and dynamic models of heavy equipment for remote monitoring of these machines. Unlike on-board real-time controllers, the proposed method uses a limited set of sensors, particularily the pressure and position sensors in hydraulic cylinders of heavy machines actuated by fluid power, to monitor the motion and the load of these machines remotely through the internet. The use of the simulation models allows to reduce the volume of data transmitted over the network in comparison with the video surveillance. It avoids the problems related to the working environment, like rain, snow, fog, dust, darkness, that influence the quality of video. The advantage of using dynamic models is the opportunity to get the forces acting in the machine and to estimate its load.
The following section introduces the proposed method. Section III describes the simulation environment developed to evaluate the proposed method. The experimental results are presented in section IV. Section V concludes the paper and discusses the directions for future research.
2 Description of the Method for Remote Surveillance on Hydraulically Actuated Heavy Equipment
This work considers the task of remote monitoring of the hydraulically actuated machines with the use of their models – digital twins. The monitored parameters are the position of the machine components at each time point and the forces acting in the machine. Similar to the video surveillance systems that provide information about the motion of the objects, the proposed method for obtaining information about the machine motion, using its digital twin, is called here the method for remote surveillance.
For the hydraulically actuated heavy equipment the easily accessible data are available for dynamic simulation. The data from the position sensors of hydraulic cylinders, which provide the extension length for the cylinder, give information about the motion of these actuators. For many types of heavy equipment, the motion of the actuators fully defines the motion of other parts of the machine. The data from the pressure sensors in hydraulic cylinders provide information about the forces acting in them. Thus, gathering the data about the pressure and the position of hydraulic actuators, it is possible to monitor the machine operation and to calculate the loads that the machine undergoes. The position of the machine components can be easily calculated from the actuators position using the kinematic model of the machine. To calculate the forces acting in different joints of the machine mechanical structure, the dynamic model of the machine should be used.
Nowadays, the pressure gauges are widely used in heavy equipment. Modern digital pressure gauges can take several thousand measurements per second. Since the natural frequency of many hydraulically actuated mechanisms used in heavy equipment does not exceed several hertz [9, 10], the sampling rate of the digital pressure gauges is sufficient for capturing dynamics of these machines.
The magnitude of the force produced by a commonly used double-acting hydraulic cylinder can be calculated with the following equation [11]:
| (1) |
where p is the pressure in the piston-side chamber; p is the pressure in the rod-side chamber of the cylinder; A and A are the piston side and rod side areas; F is the cylinder friction force. The cylinder friction depends on the velocity of the rod. Different formulations exit for the friction force. One of the commonly used expressions is the following [12]:
| (2) |
where F is a Coulomb friction; v is the rod velocity; v is a Coulomb velocity threshold; b is a viscous friction coefficient.
The cylinder forces produce torques in the joints of the machine’s mechanical structure. The data about the forces and the torques allows calculation of the machine’s dynamics. Thus, the pressure and position of hydraulic cylinders, and the inertia properties of the structural components of the machine can be used to get full information about the motion of the machine. The proposed method for remote surveillance solves this task by supplying the position and pressure measured in the cylinders to the kinematic and dynamic models of the machine. The software implementing these models can be run onboard the machine with the use of some EDGE device [13], or it can be run remotely in some datacenter using cloud computing. The sensor data should be transmitted to the cloud over the IoT environment. Local execution has an advantage of faster processing and using the simulation results for solving the tasks of machine operation. The calculated data needed for remote monitoring can be sent to the user in convenient form. The volume of transmitted data can be lower than in the case of raw sensor data transmission. The network requirements can also be lower. Execution in the cloud provides an opportunity of gathering the sensor data from many machines and processing them to get new information with Big Data techniques. The disadvantage of this approach is high network bandwidth needed to transmit the raw sensor data.
The dynamic model of the machine can be created using different formulations [14]. For the remote surveillance applications, the formulations with the lowest computational complexity should be considered. Minimization of the time needed for the simulation run is important for several reasons. First, it allows to increase the number of models processed in each period of time. This is meaningful for the cloud-based fleet management systems. Second, it provides an opportunity to reduce requirements on computing power of the on-board computer. Several dynamic formulations exist with near to O(N) complexity [15]. Since the mechanical structure of heavy equipment can often be represented by a tree or a chain of links connected by different types of joints, the Iterative Newton-Euler Formulation (INEF) [16] is suitable in many cases.
The equation of motion of a multibody system can be written in the Newton-Euler formulation as follows [14]:
| (3) |
where M is the mass matrix of the system; X is the vector of generalized coordinates; Q is the vector of generalized external forces; Q is the vector of generalized constraint forces of the system. Q can be eliminated if the components of X consist of the independent coordinates only. M is a constant matrix in many cases. X can be calculated from Q and Q by solving (3) with the initial conditions: Q(0) Q, Q(0) Q, X(0) X, .
For the hydraulically actuated machines the vector Q is composed of the actuator forces and the external forces, such as the gravity force and the forces coming from external objects which are usually represented by the material processed by the machine, such as ground, soil, or stones. This work does not consider the collisions of the machine mechanical components with the external objects. The external forces considered in this work are represented by the gravity force only. This is a typical case for the load-handling machines like cranes and loaders. The inertia properties of the multibody systems describing such machines depend on the mass of the load. This work assumes that the mass is known, e.g. it is measured by a load sensor.
In theory, to simulate the motion of the system one should define the initial conditions and solve the Equation (3). In practice, the use of digital computing devices requires discretization of the problem. Continuous functions that constitute the components of the vectors X and Q should be replaced by their discrete representations. If these functions are discretized with sufficiently small time step, it is possible to solve Equation (3) numerically with some predefined accuracy. Dynamic models of the machines are widely used in this way for solving the tasks of automatic control. If the data from the machine are obtained remotely, which is the case in the remote surveillance task, the sampling interval of the obtained values is usually larger than the time step required for solving Equation (3) numerically.
In many cases the integration time step for the systems that include hydraulic and mechanical parts is 10 s depending on the hydraulic circuit of the system [17]. The data transmission rate required for sending the measurement data obtained from the machine with some sampling rate depends on the number of parameters describing the state of the machine, the data format, the telecommunication technology and the data transmission protocol. It can be shown that using 4G cellular network and User Datagram Protocol (UDP) connection secured by Virtual Private Network (VPN) technology requires the data transmission rate more than 4 Mbits/s for sending the data from a mobile machine with the sampling rate more than 8000 measurements per second. Such rate is usually unavailable for the applications dealing with heavy equipment, because the equipment is often operated in the areas with poor network coverage. This leads to the task of estimating the values of the measured parameters laying between the received samples.
Natural splines were used in this work for the interpolation of position and pressure data. To calculate the cylinder force using the Equation (1), the velocity of the rod should be known. It can be calculated on-board the machine and transmitted together with the position and pressure data, or it can be calculated from the received data using numerical differentiation. In this work the rod velocity is calculated from the position data with the Newton formula [18].
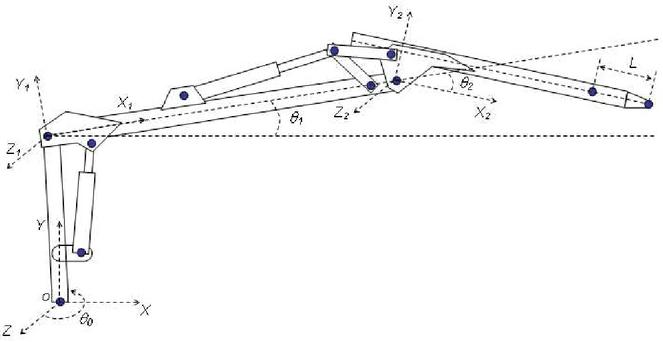
Figure 1 The kinematic model of the simulated mobile log crane.
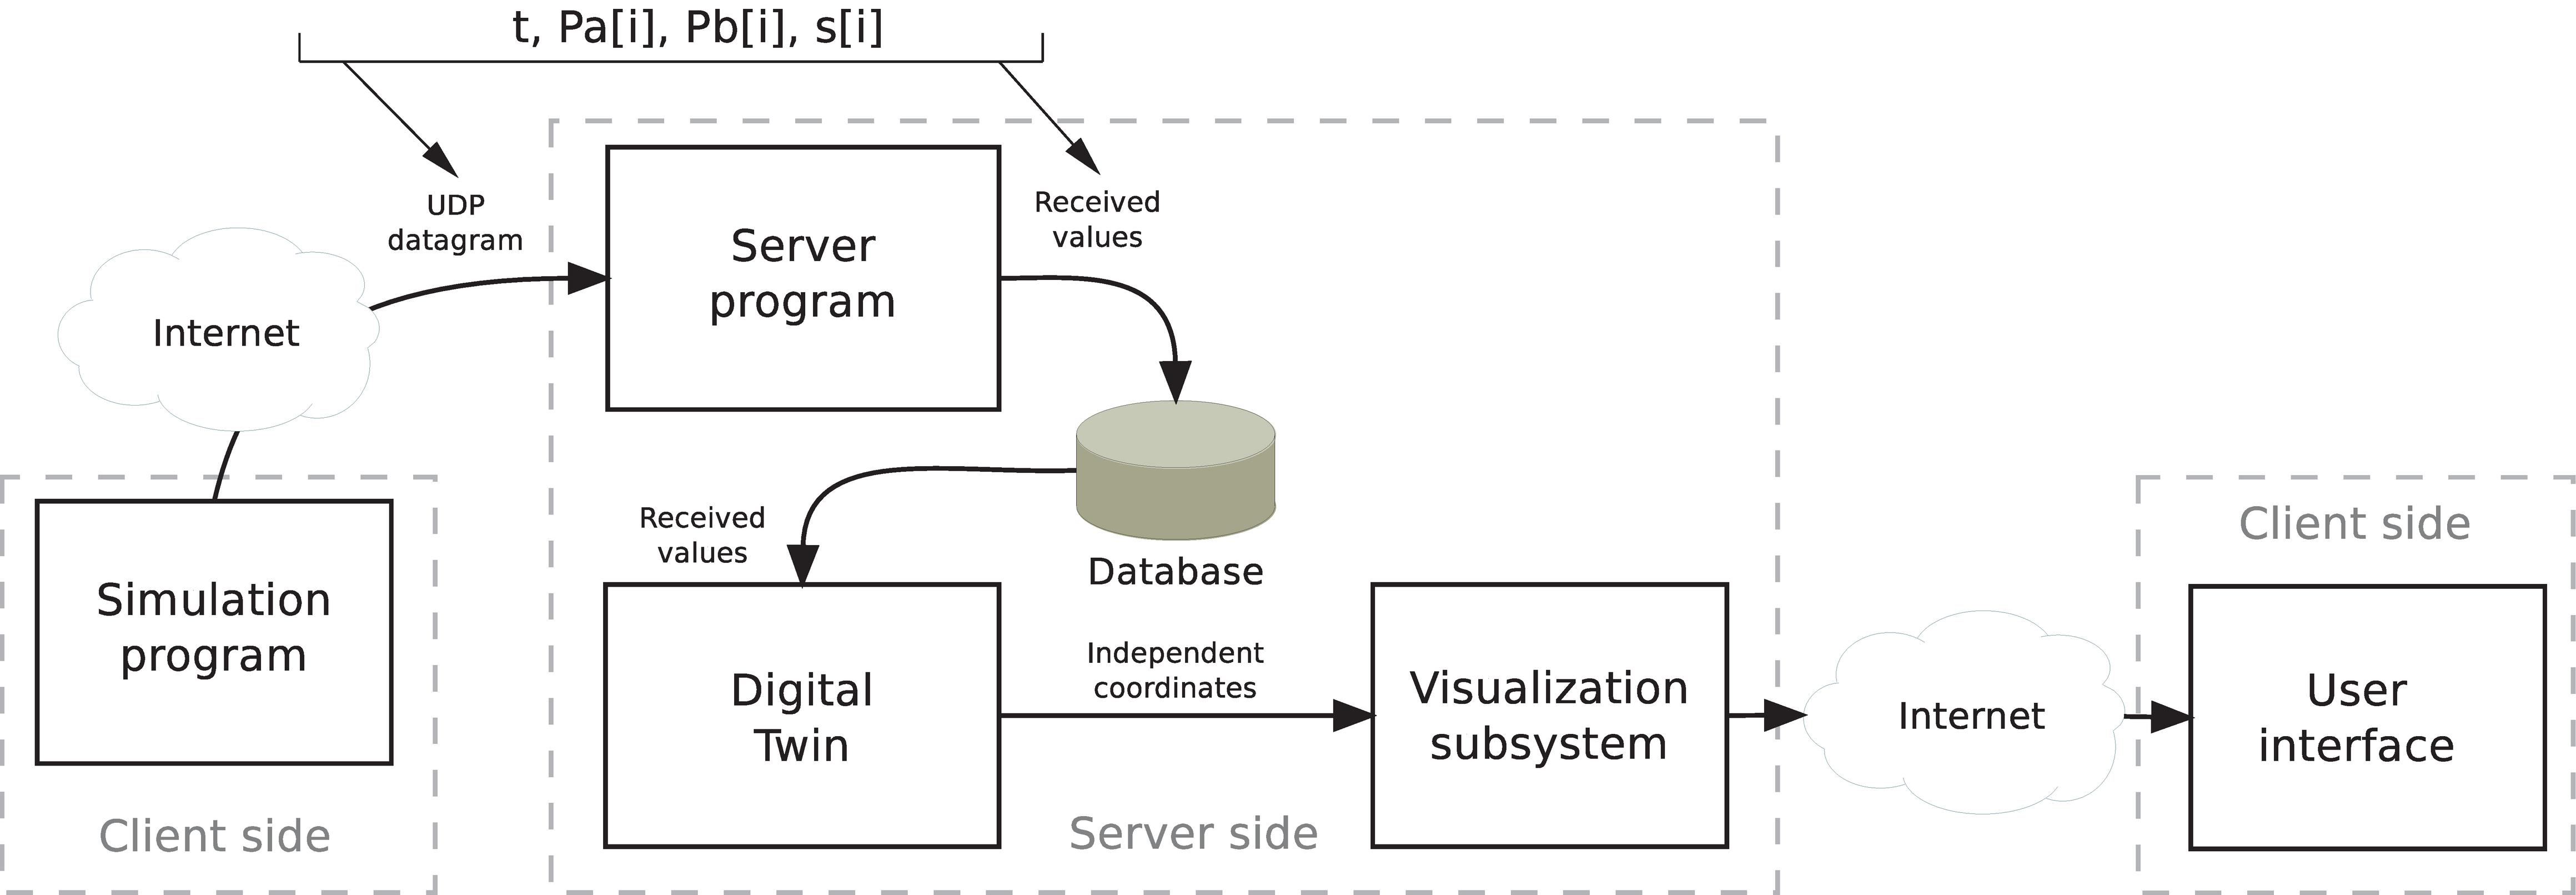
Figure 2 The test environment for the experiments.
The data about the position of hydraulic actuators allow to calculate the position of any point of the machine mechanical structure using its kinematic model. The dynamic model provides accelerations of different parts of the machine and allows to calculate the forces acting in the joints. The data about the position of machine components and the forces acting on them gives more information about the machine operation than just video data from the video surveillance system. The proposed approach was tested in the simulation environment described in the following section.
3 The Simulation Environment Used to Test the Feasibility of the Proposed Method
In order to evaluate the proposed approach, a proof of concept system was implemented using the simulation model of the mobile log crane PATU655 (Figure 1). This work uses the CAD drawings of the crane developed in [19].
The simulated crane consists of the pillar and three booms. The pillar rotates around the vertical axis, the lift boom and the jib boom are actuated by hydraulic cylinders. The extension boom is located inside the jib boom together with hydraulic cylinder that provides extension.
The test environment used in the experiments is shown in Figure 2. The real-time sensor data were generated by the simulation program. It used the dynamic model of the crane augmented with the model of the hydraulic circuit of the crane. The description of the model can be found in [20]. The time step used in dynamic simulation was 10 s.
The simulation program calculated the values of the pressure in the piston side (Pa[i]) and in the blind side (Pb[i]) of each cylinder (indexed by i). It also calculated the position of each cylinder (s[i]) and the value of the torque applied to the pillar. These data together with the timestamp for each data sample were sent by UDP protocol to the server side. The sampling rate used in the experiments was 100 measurements per second. The task of the server program was to receive the data and to save them to the database. The received values were used as input data to the digital twin. This was another simulation program that utilized the same dynamic model to reproduce the movements of the crane. The crane motion calculated by the digital twin was visually presented to the user as animated CAD drawings through the web-interface.
Using INEF, the equations of motion were obtained that could be presented in a matrix form the following way:
| (4) |
In Equation (4) is the vector of independent coordinates: is the angle of rotation of the pillar; is the angle of the lift boom; is the angle of the jib boom; L is the length of the extension boom (see Figure 1). is the vector of torques produced by the hydraulic cylinders.
The control signal causing the movement of the crane was represented by a sequence of input voltage values for the control valves. An example of the control signal is shown in Figure 3, where U_lift, U_jib, and U_slewing are the values of input voltage for the control valves of the cylinders operating the lift boom, the jib boom, and the slewing mechanism accordingly.
The sequence of values of the input voltage depicted in Figure 3 causes the movement of each boom actuated by the corresponding cylinder. Figure 4 shows the calculated position of the lifting cylinder. The dashed line in Figure 4 (denoted as Xc_sim) represents the cylinder position calculated by the digital twin with the use of received data. The solid line (denoted as Xc) is the position calculated by the simulation program on the client side.
The position of each cylinder calculated by the digital twin is the interpolation of the sampled values produced by the simulation model and transmitted over the network. The accuracy of these calculations depends on the discretization error caused by low sampling rate.
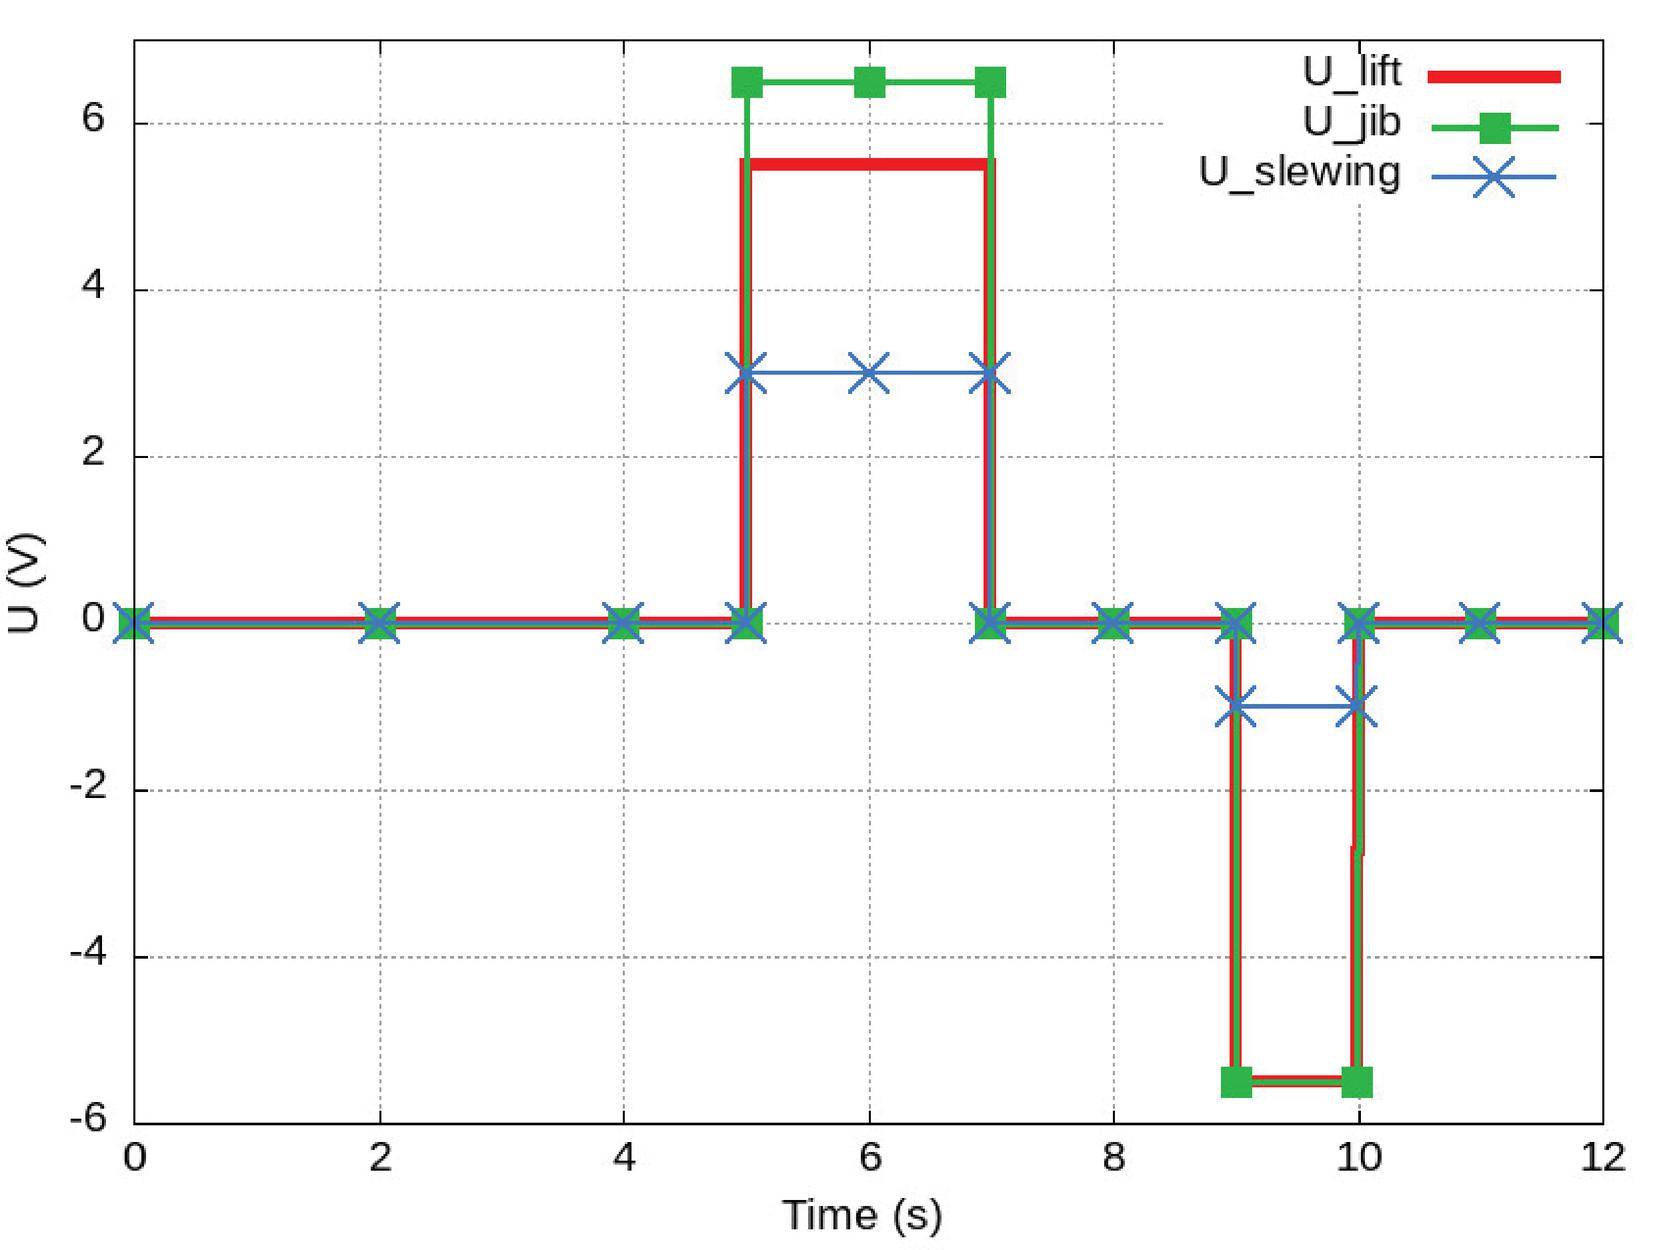
Figure 3 Input voltage of the control valves used in the experiments.
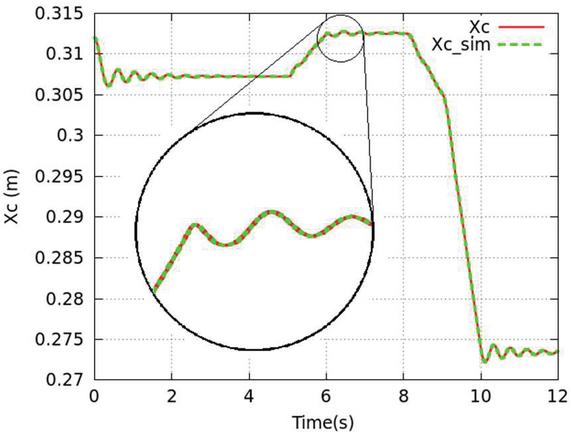
Figure 4 Position of the lifting cylinder as a result of motion produced by the control signal.
The cylinder forces were not transmitted from the client to the server side. They were calculated by the digital twin using the hydraulic model of the crane. The force produced by the lifting cylinder that was calculated by the simulation model at the client side (denoted as Fc_0), and the value of this force obtained by the digital twin (denoted as Fc_sim) are presented in Figure 5.
The cylinder forces depend on the values of pressure and velocity according to Equation (1). The values of pressure were calculated by interpolating the received data. The velocity of the cylinder rod was calculated by numerically differentiating the position data.
The kinematic model of the crane presented in Figure 1 allows calculating the position of any part of the crane in any moment of time using the position of each cylinder. The kinematic model used in the experiments is described in [21]. The sequence of calculated position values forms the position history of the crane components. The forces acting in the crane form the load history of the machine. It can be produced by the dynamic model of the crane using the position data and the values of the forces calculated from the pressure data. The position history and the load history are useful for solving the tasks of remote monitoring.
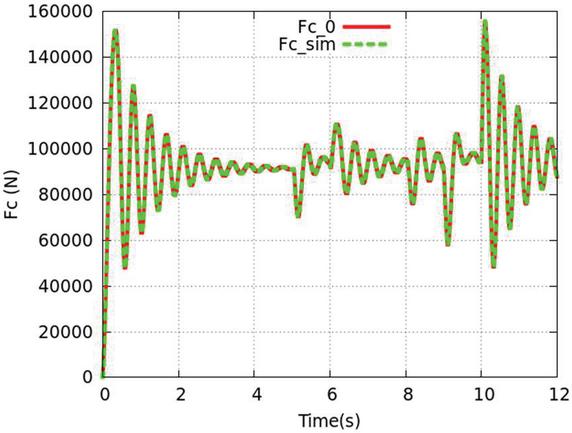
Figure 5 The force produced by the cylinder of the lifting boom.
4 Experimental Results
The accuracy of the results produced by the digital twin depends on the accuracy of the model and on the measurement errors introduced by the sensors. These are the main components of the total error, since the contribution of the analog to digital conversion and data transmission over the network is much less. The influence of the measurement errors on the accuracy of simulation results was tested by adding an artificial error to the input data of the model. This error was represented by the pseudo-random real numbers uniformly distributed in the predefined range. The artificial error was added to the sensor data received on the server side (see Figure 2). Figure 6 shows an example of the sensor data about the position of the lift cylinder with an artificially generated 10% measurement error. In order to minimize the influence of the sensor errors on the simulation results, the input data were smoothed by Savitzky-Golay filter [22].
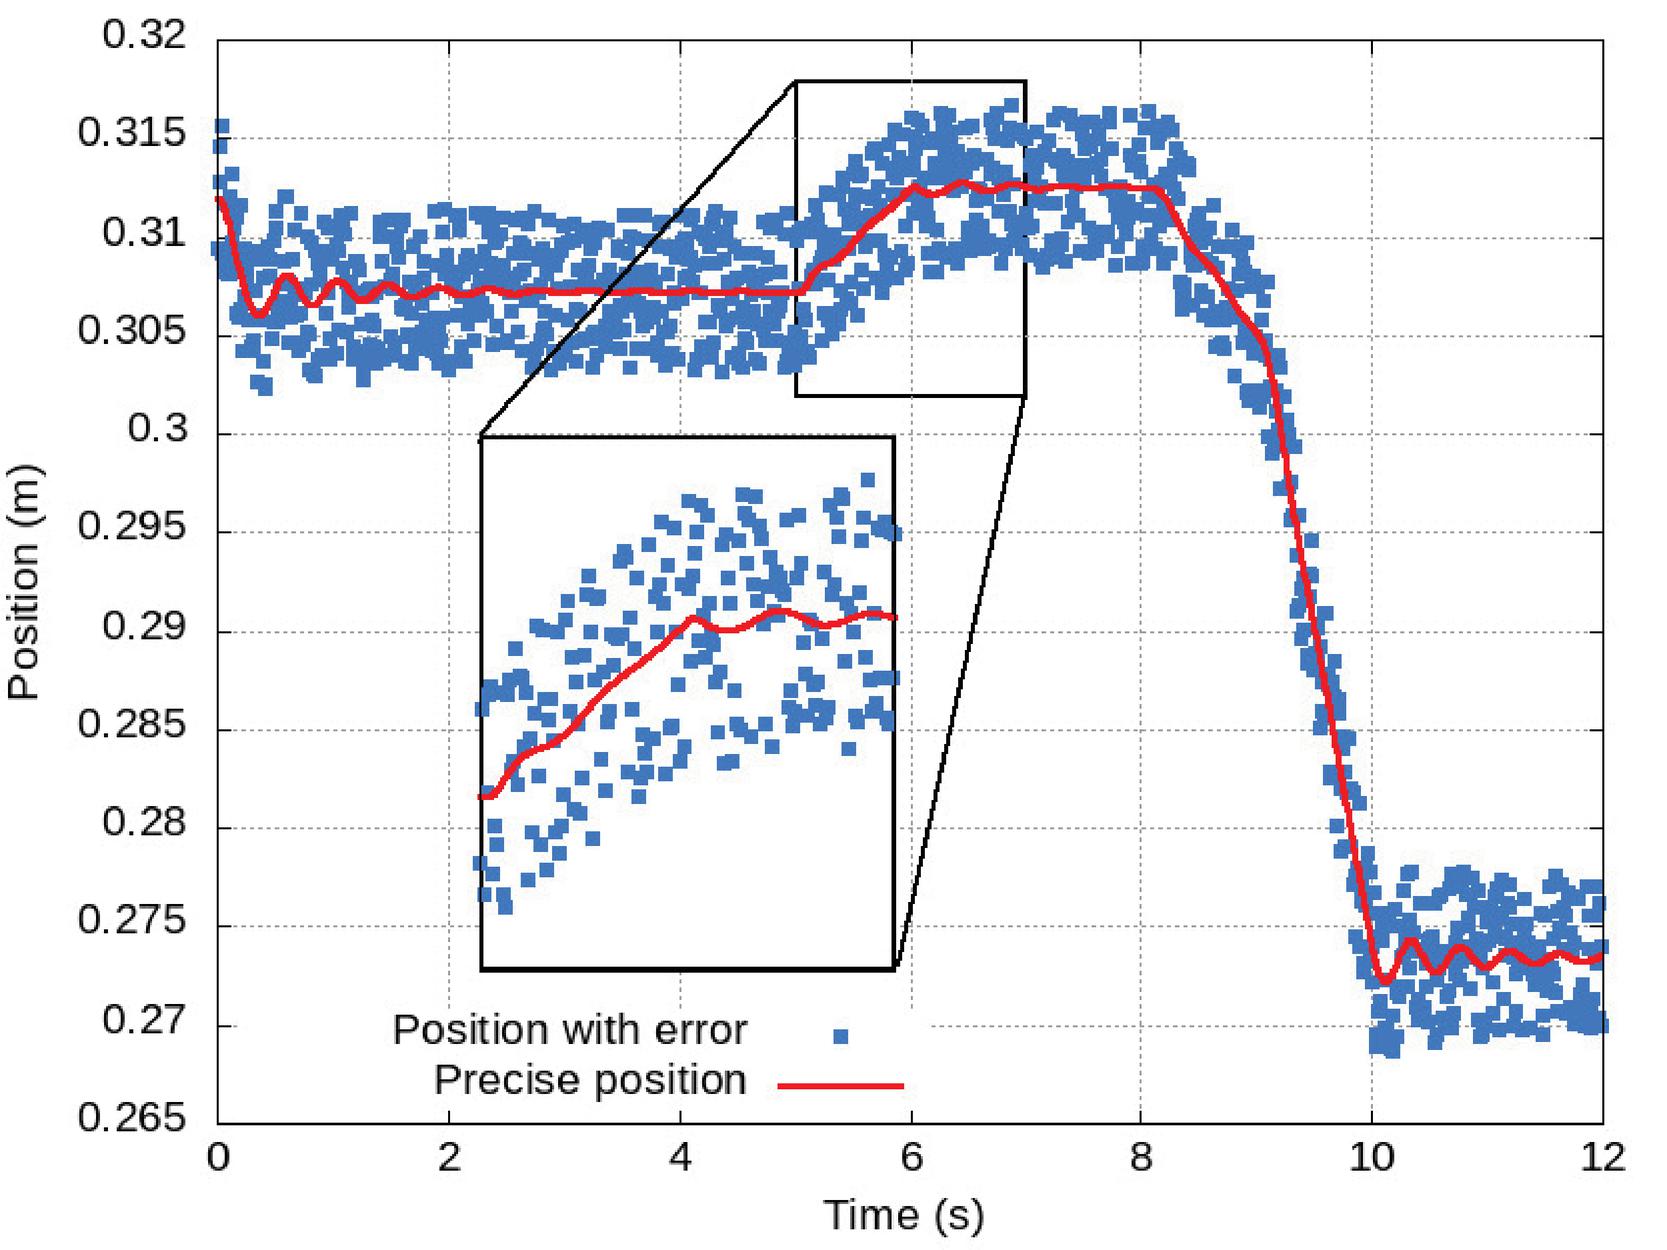
Figure 6 An example of the sensor data with the artificially added measurement errors.
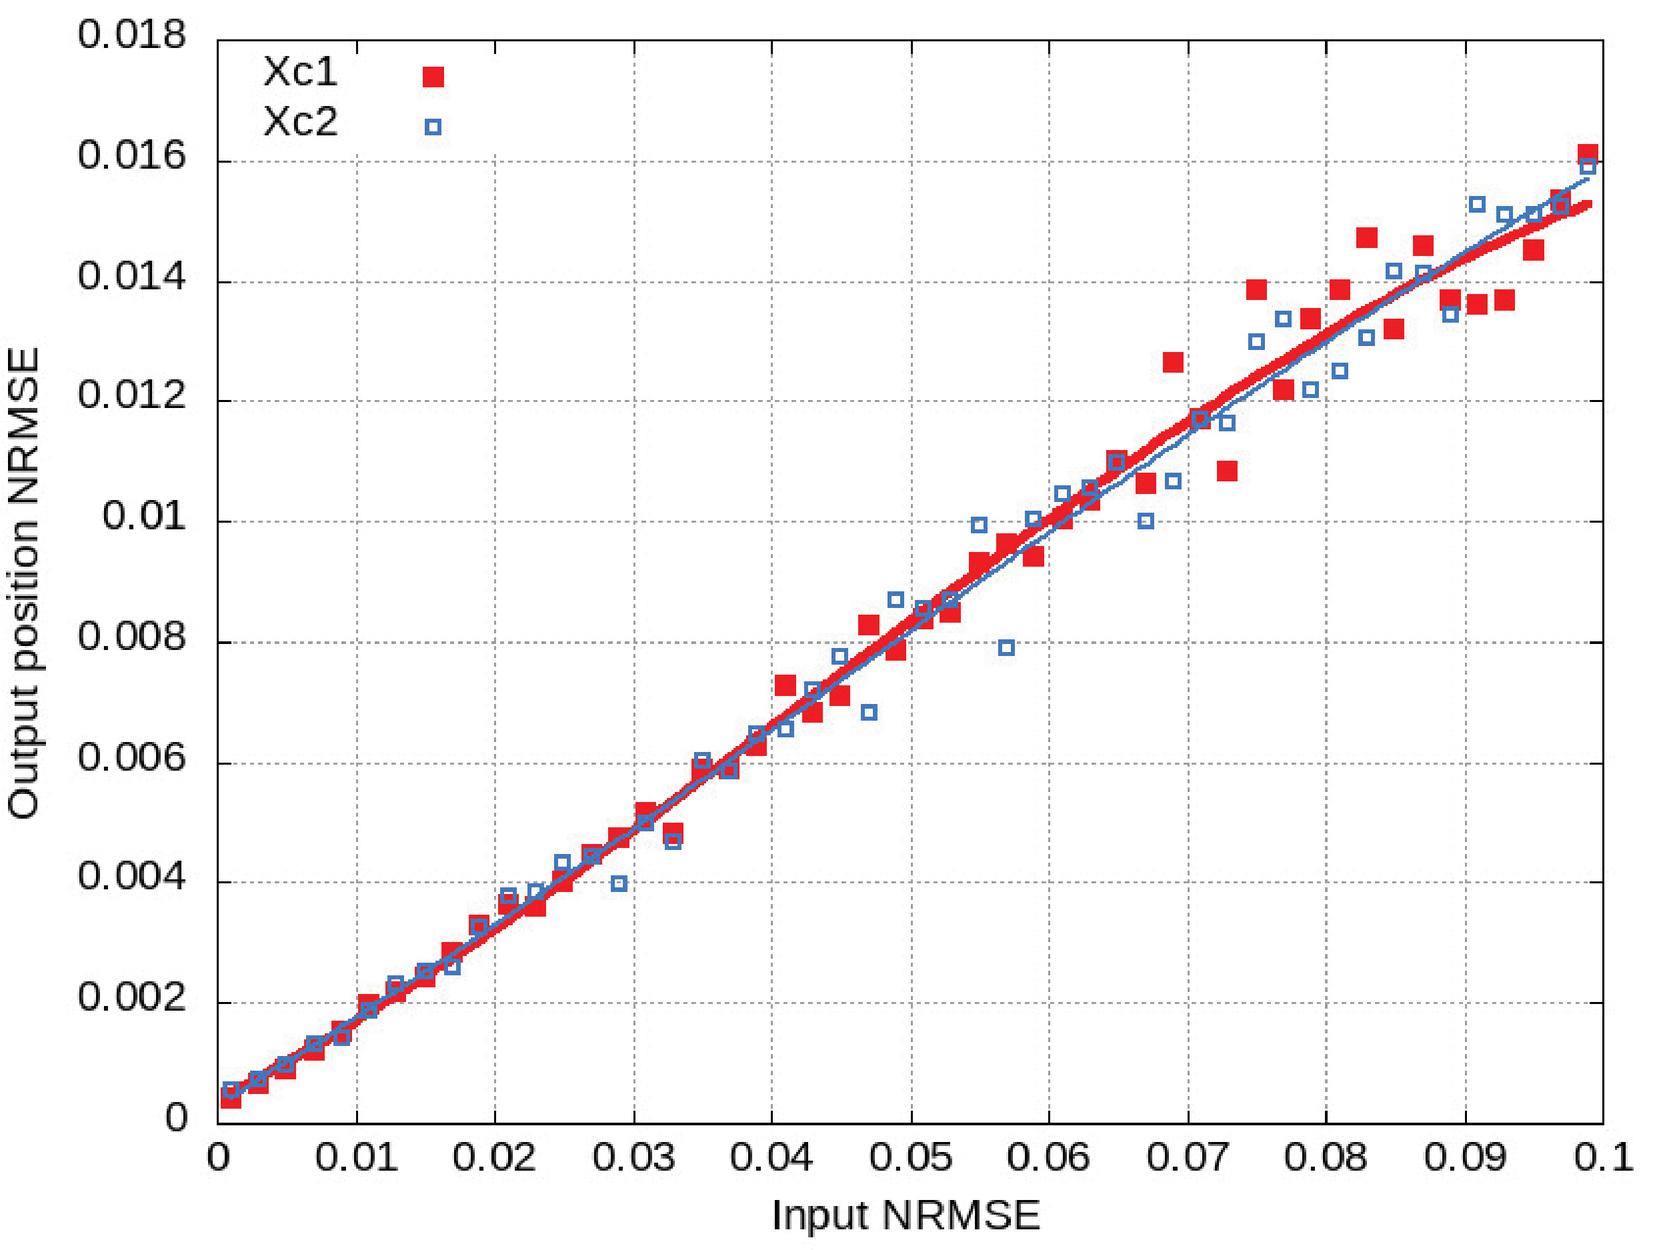
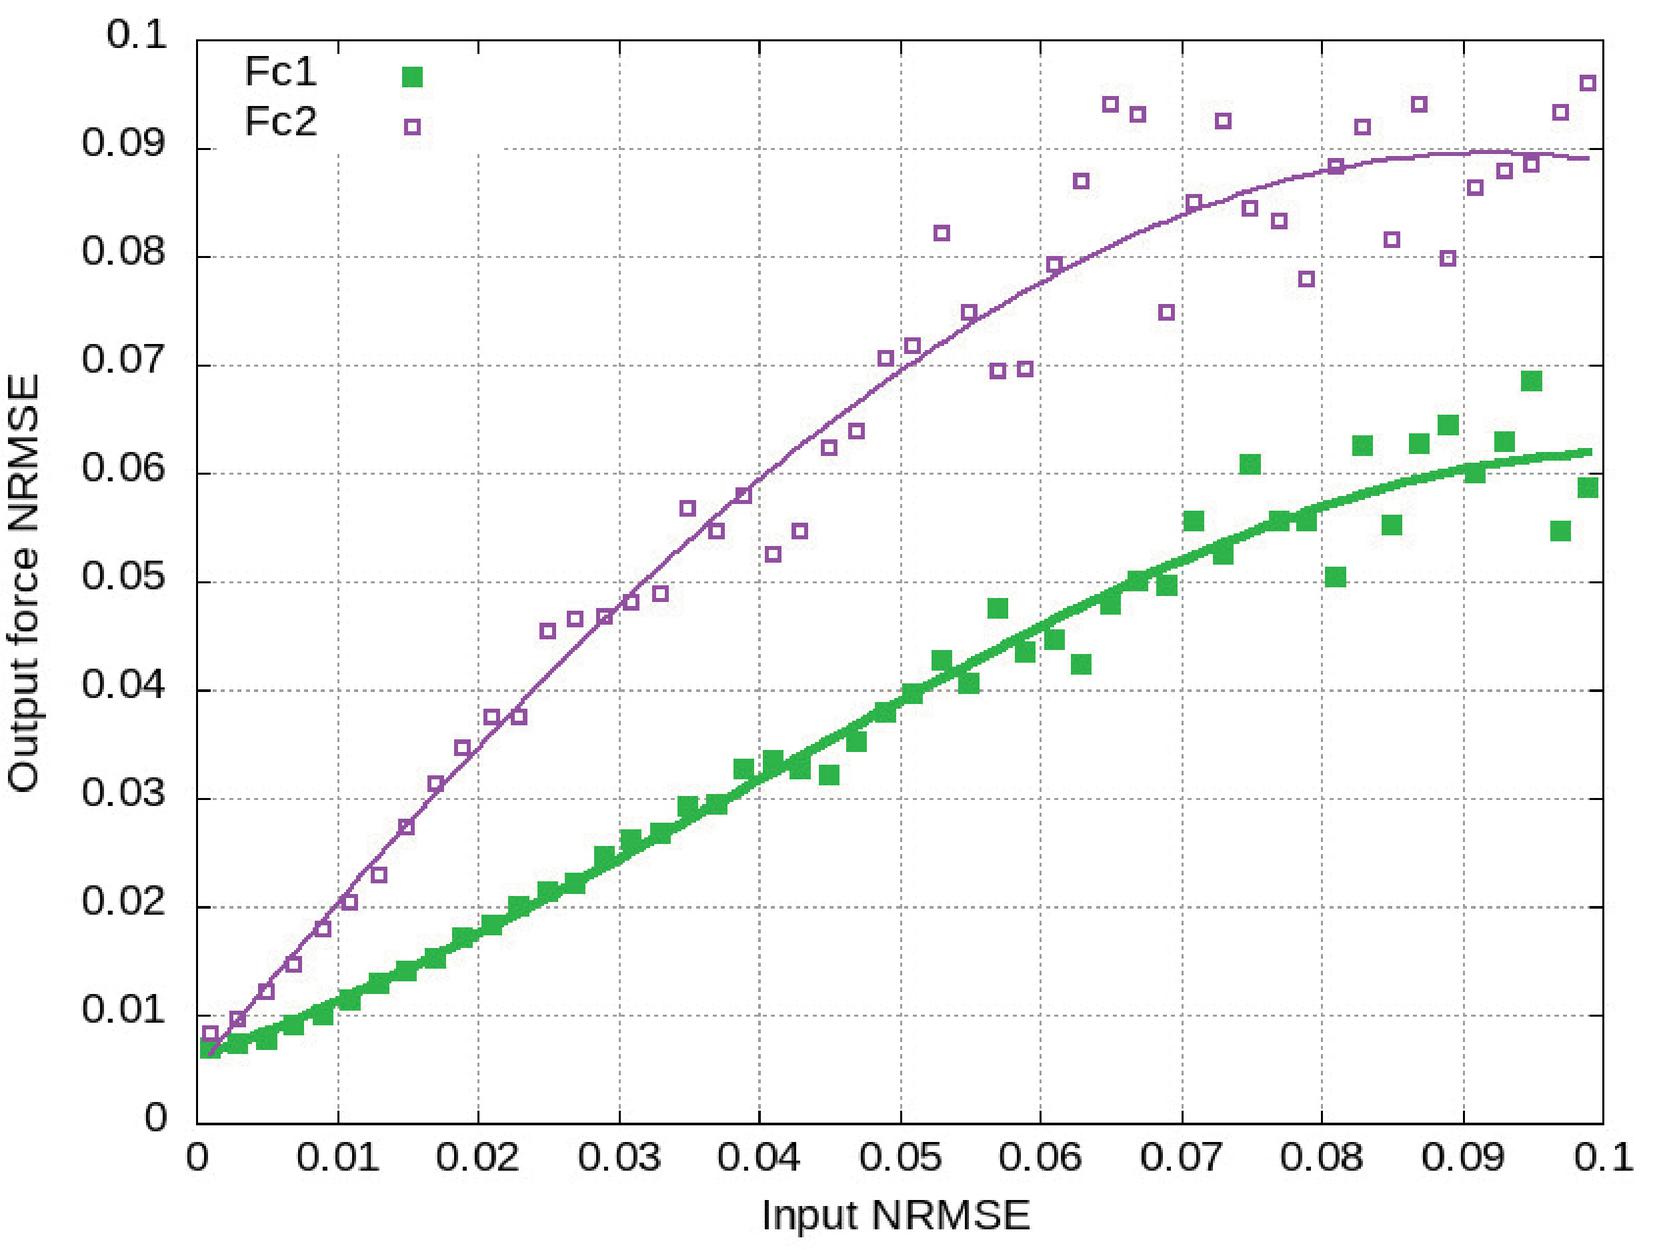
Figure 7 The total error of position and force calculation for each cylinder as a function of the maximum error added to the pressure and position sensor data.
The total error of position and force calculation for each cylinder as a function of the maximum error added to the pressure and position sensor data is presented in Figure 7.
The points in Figure 7(a) denoted as Xc1 and Xc2 present the normalized root mean square error (NRMSE) of calculation of the lift cylinder position and the jib cylinder position accordingly. The points in Figure 7(b) denoted as Fc1 and Fc2 present NRMSE of calculation of the force produced by the lift cylinder and by the jib cylinder accordingly. The solid lines in Figure 7 represent the curves fitting the points with third degree polynomials. The experimental data show a close to linear dependence of the total error of position and force calculation on the maximum measurement error for the range of accuracy common for commercially available sensors (input NRMSE less than 5%). Smoothing the sensor data by Savitzky-Golay filter allowed obtaining the total error of force calculation that did not exceed the error of position and pressure measurement more than twice. Interpolation of the sensor data needed to restore the measured values at each time step within the sampling interval introduces additional error. This error can be seen in Figure 7 at the points with zero input NRMSE. The maximum values of this error did not exceed 1% for the case of forces calculation.
5 Conclusions And Future Research Directions
The paper presented a method of using the physics-based simulation models (digital twins) for the camera-less remote surveillance on heavy equipment. The method provides information about the movements of the machine and about the forces acting in it from position and pressure sensor data obtained remotely from hydraulic actuators. No external cameras or other additional devices are needed to get the comprehension of the work performed by the machine and the loads that it undergoes.
The proof of concept software system was developed to test the feasibility of the approach. The influence of the sensor accuracy on the simulation results was evaluated. The computational experiments show that the proposed method allows to estimate remotely the position of the hydraulic cylinders with the error not exceeding the measurement error of position sensors and to estimate the cylinder forces with the error less than 8% using the commercially available pressure sensors with NRMSE less than 5%.
The influence of the model accuracy was not evaluated in the current work. It is obvious that every real machine differs from other similar machines. Even a very accurate model created for the particular machine can be unsuitable for another machine of the same kind. That is why model validation is an important phase in the implementation of digital twins.
This work used INEF to obtain the dynamic model of the machine. Though being a powerful technique for the mechanisms that have a chain structure, this approach cannot be applied to any machine. Finding the ways of building the parametrized models for different types of machines that are able to suit every real machine by adjusting parameters of the model is another important direction of future research. Experiments with the real machines should be made in order to validate the proposed approach using commercially available sensors, telecommunication networks, computing hardware and IoT platforms.
References
[1] S. Chen, L.K. Keys, “A cost analysis model for heavy equipment,” Computers & Industrial Engineering, vol. 56(4), 2009, pp. 1276–1288.
[2] A. Moradi Afrapoli, “A Hybrid Simulation and Optimization Approach towards Truck Dispatching Problem in Surface Mines,” PhD thesis, University of Alberta, Edmonton, Canada, 2018.
[3] I. Lazakis, K. Dikis, A.L. Michala, G. Theotokatos, “Advanced Ship Systems Condition Monitoring for Enhanced Inspection, Maintenance and Decision Making in Ship Operations,” Transportation Research Procedia, vol. 14, 2016, pp. 1679–1688.
[4] [4] S. Erikstad, “Merging Physics, Big Data Analytics and Simulation for the Next-Generation Digital Twins” in V. Bertram (Ed.), High-Performance Marine Vehicles, Durbanville, South Africa, 2017, pp. 141–151.
[5] [5] W. Kritzinger, “Digital Twin in Manufacturing: : A categorical literature review and classification,” IFAC-PapersOnLine, vol. 51(11), 2018, pp. 1016–1022.
[6] D. Zhong, H. Lv, J. Han, W. Quanrui, “A Practical Application Combining Wireless Sensor Networks and Internet of Things: Safety Management System for Tower Crane Groups,” Sensors, 14, 2014, pp. 13794–13814.
[7] Y. Fang, “Real-time safety assistance to improve operators’ situation awareness in crane lifting operations,” PhD dissertation, Georgia Institute of Technology, 2016.
[8] E. Sanjurjo, D. Dopico, A. Luaces, M.A. Naya, “State and force observers based on multibody models and the indirect Kalman filter,” Mechanical Systems and Signal Processing, vol. 106, pp. 210–228, 2018.
[9] J. Kovanen, “Improving dynamic characteristics of open-loop controlled log crane,” PhD Thesis, Lappeenranta University of Technology, Lappeenranta, Finland, 2003.
[10] J. Gottvald, “The calculation and measurement of the natural frequencies of the bucket wheel excavator SCHRS 1320/4X30,” Transport, vol. 25(3), 2010, pp. 269–277.
[11] M. Galal Rabie, “Fluid power engineering,” New York: McGraw-Hill, 2009.
[12] S. Andersson, A. Söderberg, and S. Björklund, “Friction models for sliding dry, boundary and mixed lubricated contacts,” Tribology int., vol. 40(4), 2007, pp. 580–587.
[13] A. Yousefpour, C. Fung, T. Nguyen, K.P. Kadiyala, F. Jalali, A. Niakanlahiji, J. Kong, and J.P. Jue, “All One Needs to Know about Fog Computing and Related Edge Computing Paradigms: A Complete Survey,” Journal of Systems Architecture - Embedded Systems Design, vol. 98, 2019, pp. 289–330.
[14] A. A. Shabana, “Computational Dynamics,” 3rd Edition, Wiley, UK, 2010.
[15] R. Featherstone and D. Orin, “Robot Dynamics: Equations and Algorithms,” Proceedings 2000 ICRA, Millennium Conference, IEEE International Conference on Robotics and Automation, Symposia Proceedings, San Francisco, CA, USA, 2000, pp. 826–834.
[16] J.Y.S. Luh, M.W. Walker, R.P. Paul, “On-line computational scheme for mechanical manipulators,” Trans. of the ASME J. of Dynamic Syst., Meas., and Control, vol. 102, no. 2, 1980, pp. 69–76.
[17] R. Piche, A. Ellman, “Numerical Integration of Fluid Power Circuit Models Using Two-Stage Semi-Implicit Runge-Kutta Methods,” Proceedings of the Institution of Mechanical Engineers, Part C: Journal of Mechanical Engineering Science, vol. 208, 1994, pp. 167–175.
[18] A. Kovartsev, “Vychislitelnaya matematika” [Computational mathematics], Ofort, Samara, Russia, 2011.
[19] L. Luostarinen, R. Åman, and H. Handroos “Development of control interface for HIL simulation of electro-hydraulic energy converter,” Int. Rev. Modelling and Simulations (IREMOS), vol. 7(4), 2014, p. 653.
[20] I. Malysheva, H. Handroos, V. Zhidchenko, and A. Kovartsev, “Faster than real-time simulation of a hydraulically actuated log crane,” 2018 Global Fluid Power Society PhD Symposium (GFPS).
[21] V. Zhidchenko, I. Malysheva, H. Handroos, and A. Kovartsev, “Faster than real-time simulation of mobile crane dynamics using digital twin concept,” Journal of Physics: Conference Series, vol. 1096, 2018, p. 12071.
[22] A. Savitzky and M. J. E. Golay, “Smoothing and Differentiation of Data by Simplified Least Squares Procedures,” Analytical Chemistry, vol. 36(8), 1964, pp. 1627–1639.
Biographies
Victor Zhidchenko received his D.Sc (Tech.) degree at LUT University (Lappeenranta, Finland) in 2019. He holds a Candidate of Sciences degree from Samara National Research University (Russia). He is currently working as a post-doc researcher at LUT University. His research interests are related to computer simulation, cyber-physical systems, digital twins for heavy equipment, Big Data, cloud computing, and the Internet of Things.

Heikki Handroos received his M.Sc. (Eng.) and D.Sc. (Tech.) degrees from Tampere University of Technology in 1985 and 1991. He has been a professor of Machine Automation at Lappeenranta University of Technology since 1992. He has been a visiting professor at the University of Minnesota, Peter the Great St Petersburg Polytechnic University, and the National Defense Academy (Japan). His research interests range from modeling, design, and control of mechatronic transmissions to robotics and virtual engineering. He has published about 250 international scientific papers and supervised around 20 D.Sc. (Tech.) theses. He has been an Associate Editor of the ASME Journal of Dynamic Systems, Measurement, and Control since 2014. He has led several important domestic and international research projects.
International Journal of Fluid Power, Vol. 23_3, 363–378.
doi: 10.13052/ijfp1439-9776.2335
© 2022 River Publishers