Review of Fault Detection and Diagnosis Methods including Failure Root Causes of Major Components of Hydraulic Pitch System for Wind Turbines Part-II
Mohit Bhola1, Gyan Wrat1,*, Henrik C. Pedersen1, Jesper Liniger2 and Diego M. Chamorro1
1AAU Energy, Mechatronics Section, Aalborg University, Aalborg, Denmark
2AAU Energy, Esbjerg Energy Section, Aalborg University, Esbjerg, Denmark
E-mail: gywr@energy.aau.dk
*Corresponding Author
Received 19 June 2024; Accepted 21 November 2025
Abstract
The hydraulic pitch system is a critical component of modern wind turbines, responsible for both power regulation and safety mechanisms. Ensuring the reliability and availability of this system is essential for optimal turbine performance. This study focuses on the reliability of less active yet essential components within the hydraulic pitch system, including the pump, accumulator, relief valve, hose, and hydraulic oil. The hydraulic oil in the analysis has been treated as a component also. Employing a comprehensive Fault Tree Analysis (FTA), this study identifies the failure modes, effects, and root causes of these components. Key findings indicate that contamination and inadequate maintenance are primary contributors to failures. The study discusses various fault identification and condition monitoring algorithms, including those based on artificial intelligence and machine learning, which are effective in post-processing data for fault detection. Physics-based models, such as observer methods like the Kalman Filter, show potential for real-time implementation. The findings underscore the importance of stringent filtration, regular inspections, and proactive maintenance strategies, including monitoring accumulator pre-charge pressure and using appropriate hydraulic oil. Addressing these root causes can significantly enhance the reliability and longevity of hydraulic pitch systems, thereby improving the overall performance and safety of wind turbines.
Keywords: Hydraulic Pitch System, Wind Turbine, Fault Tree Analysis, Failure Root Causes.
1 Introduction
The pitch system is a very important part of modern wind turbines, where it is part of the power regulating system and the safety system. For this reason, the reliability and availability of the pitch system is crucial. Understanding the failure modes, effects and root causes of the different components is, therefore, an important means to improve the reliability of the system further. The focus of this paper is therefore on the reliability of the components in the pitch system and is an extension of the review paper titled ”Review of Fault Detection and Diagnosis Methods Including Failure Root Causes of Major Components of Hydraulic Pitch System for Wind Turbines-Part-I. [1]” It provides a comprehensive review and Fault Tree Analysis (FTA) extended to its root causes of remaining significant components essential for pitch regulation, such as the pump, accumulator, relief valve, hose, and hydraulic oil. The study of root causes is important for better developing fault identification techniques and correlating the failure field data of these components. Although the focus is on the hydraulic pitch system, the literature discussed herein applies to various hydraulic applications involving these specific components.
The paper is organized as follows: In section 2, the failures in the gear pump are discussed. The focus is on external gear pumps because they are the most common type of pump used in the pitch system. In section 4, failures in the piston accumulators are discussed. In section 3, 5, and 6, the failures in the safety device, i.e., the pressure relief valve, hydraulic oil, and hoses are discussed, respectively.
2 Gear Pump
In the fluid power pitch system, external gear pumps are the most common type of pumps used. These pumps are simple in construction, are easy to assemble/disassemble, and are of fixed displacement type with easy requirements for their service and maintenance. The exploded view of a gear pump has been shown in Figure 1. The subsequent paragraphs explore distinct pump failure modes documented in the literature, as well as recent investigations into fault occurrences and techniques for determining the Remaining Useful Life (RUL) of pumps. Yang et al. [2] systematically summarized methods related to fault diagnosis and health management in hydraulic pumps, addressing the need for a comprehensive analysis of these methods. They observed the potential of data and signal-based approaches, as well as machine learning algorithms, especially deep learning, to play a significant role in the future of hydraulic pump fault diagnosis and health management.
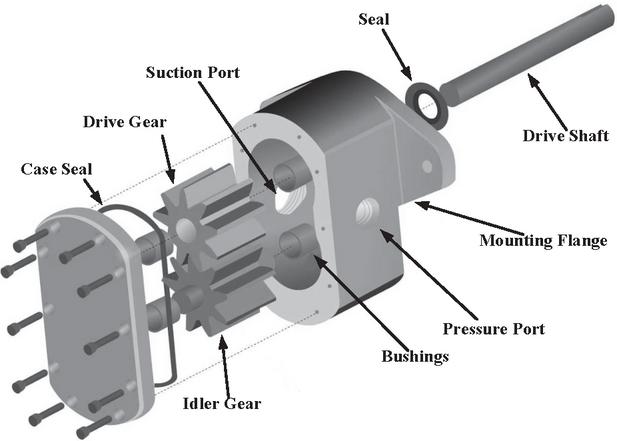
Figure 1 Gear pump exploded view, The image is developed with inspiration from [3].
Shen et al. [4] the addressed contact fatigue in gear pumps, proposing a virtual simulation-based method to predict gear fatigue life. The authors established a modeling approach using Fluent software, which includes turbulent flow simulations and dynamic gear movement modeling. This approach, which couples fluid-solid interactions in ANSYS Workbench for contact stress simulation with simplified flow fields results from Fluent, predicts the fatigue life of the gears using a probabilistic stress-life (PSN) curve for the modified material which was alloy steel denoted as 20Cr2Ni4A. Although added simplifications introduced some deviation which are not quantified due to lack of experimental validation, the research holds significant potential for improving gear pump life and reliability. The study pertains to enhancing the lifespan of gear pumps during the design phase. The study is thus not effective for the pumps working in operating conditions.
In another study by Fabiś-Domagała [5] performed an analysis on a gear pump using the FMEA matrix and an Ishikawa diagram, which is also known as a cause-and-effect diagram or error diagram. The study revealed that qualitative methods can effectively identify the potential defects in gear pumps. The methodology pinpointed the components with the highest likelihood of defects i.e. the components that have the transmitting functions which are the drive shaft, the driving and driven gear wheel [6], as well as the corresponding root causes contributing to these issues . The authors also discovered, according to the literature, that 60% of the failures are associated with the gear wheels. The study done by [5] facilitates timely preventive measures or the formulation of corrective plans. However, this requires domain expertise to propose corrective plans for the different failure modes at the component level. Also, the article published in [7] shows the failure modes in gear wheels and their possible root causes. However, the article is limited to studying failure in gear wheels of gear pumps only.
Lee et al. [8] introduces a method for early wear detection in gear pumps. The mel-frequency cepstral coefficient (MFCC) features were obtained from the vibration signals of the pump. The Failure Mode, Effect and Criticality Analysis (FMECA) was conducted to evaluate the most common failure modes, i.e. causing wear and compelling the pump to operate in this failure condition by conducting accelerated abrasion tests using fine dust particles. The accelerated test was stopped when pressure dropped from 100 bar to 50 bar. The data obtained from the test were post-processed to obtain useful MFCC features. After obtaining various MFCC features, 12 different types of classifiers were used to evaluate the failure detection accuracy. The accuracy of various machine learning algorithms is shown in Table 2. Machine learning algorithms, especially random forests, demonstrated a notable test accuracy of 95.17%. The resulting output enhances the precision of gear pump failure diagnosis and prognostics, underscoring the significance of evaluating failure likelihood, severity, and detection rate. However, the method outlined demands higher computational resources, making it more costly. Also, the features obtained from the vibration signals were obtained in the laboratory-controlled environment at constant load conditions which limits its direct applicability in real working environments. Also, the robustness to vibrations from other equipment must be investigated further.
Hemati and Shooshtari [9] investigated gear pump failures due to bush bearing looseness, emphasizing vibration analysis for diagnosis. Bush-bearing looseness results in changes in internal clearances and gear backlash. Various vibration analysis techniques, including time series signals, velocity and acceleration spectra, envelope velocity, and envelope acceleration, were used to detect issues. The study successfully identified bush bearing failure and adhesive gear wear, highlighting the importance of early detection to prevent further damage. The root cause of gear wheel wear was attributed to the bush bearing’s looseness on the shaft, which leads to metal-to-metal contact between gear teeth. The vibration signals were recorded, which shows the early-stage symptoms, including harmonics of rotating speed, progressing to complete bush bearing looseness and gear teeth failure. The study found the envelope acceleration spectra to be the most effective method for detecting worn gear teeth. However, the authors only show the change in vibration spectrum from the pump due to bearing looseness without the automatic method for detection.
Vuorinen [10] discussed potential failures in positive displacement hydraulic pumps employed in off-road machinery based on the literature survey. The failures stem from various factors and were classified into operation and maintenance, installation, design, and manufacture. The primary contributors, responsible for 70-80% of hydraulic system failures, were issues related to operation and maintenance, including contamination, improper fluid properties, pressure shocks, and low fluid levels were identified. Common failure modes, often induced by contamination or incorrect fluid, primarily manifest as wear, resulting in anomalous vibrations, noise, and alterations in pressure and flow. While essential, diagnosing these faults is a complex task. The multiple signal-based techniques found in literature, utilizing sensors like vibration, pressure, flow, and noise sensors, were discussed. The work concludes that effectively diagnosing concurrent failures remains a challenge, warranting further research to enhance reliability.
Another work done by Liu et al. [11] shows the deployment of vibration sensors for investigating four prevalent faults in pumps i.e. tooth face wear (TFW), cavitation (CA), oil pollution (OP), and wear of the internal surface of the shaft sleeve (WISSS). The four faults were created by grinding the meshing surfaces of the gear and shaft sleeve by loosening the oil pump inlet, and by adding contaminants to the oil. The authors employed Ensemble Empirical Mode Decomposition (EEMD) to decompose vibration signals, utilizing the energy of Intrinsic Mode Functions (IMFs) as distinctive features. These features were integrated to construct Bayesian Networks for fault prediction. To assess the model’s performance, comparisons were made with Artificial Neural Network (ANN) and Support Vector Machines (SVMs). The diagnostic accuracy of these models was evaluated, showing that the Bayesian network achieved 98.5%, outperforming both ANN (94%) and SVM (95%). This suggests the efficacy of the proposed approach in fault prediction based on vibration signal analysis. However, in the paper, the location of the vibration sensor, the number of sensors used, and how the signal changes with the change in location of the sensor are not discussed. Also, the effect of the vibration coming from different sources is not discussed.
Another study was done by Liao et al. [12], who used the vibration signals that interfered with the noise from surrounding noise resulting in a low signal-to-noise ratio problem. Also, the sample count collection was not uniform for different operating conditions. The subject of the investigation was the internal gear pump employed in marine hydraulic systems. Hence, to overcome the above-mentioned issues, the features of the operating state were captured utilizing a vibration sensor that traverses through the complex structures, including the rotor-oil casing. Signal processing techniques such as Wavelet Transformations (WTs) and empirical mode decompositions (EMDs) were applied to denoise the main signals by isolating multiple frequency components or IMFs. These methods were aimed to enhance signal clarity and reduce noise interference in the data. However, these methods are not efficient for unstable and nonlinear industrial data. Hence, to overcome these challenges, the authors worked on the implementation of a Convolutional Auto-Encoder (CAE) and Particle Swarm Optimization-Least Squares Support Vector Machine (PSO-LSSVM) to enhance the feature of the operating state. For the implementation of the latter technique, acceleration lifetime testing (ALT) was conducted for the capturing of the vibration signal, and the different operating conditions were classified. The ALT was performed by running the pump at overspeed, overload, and shock load while adding fine dust (NAS11) in hydraulic oil during these tests. The enhancement of the vibration signal was done by the CAE, which was followed by the Variational Mode Decomposition (VMD) multi-scale permutation entropy (MPE) for reconstructing the fault features, which decompose it into different IMFs using VMD. Furthermore, the calculation of MPE was conducted to generate a feature set. The feature sets were divided into the training set and the test set, which was trained using the PSO-LSSVM. This CAE-VMD-MPE-PSO-LSSVM was compared and found to be more accurate than other approaches as VMD-MPE-PSO-LSSVM and CAE-MPE-PSO-LSSVM to predict the RUL of the internal gear pump obtained by data from the ALT. However, the techniques explained are computationally extensive and were applied to the internal gear pump which is different than the external gear pump used in a fluid power pitch system.
The study conducted by Lakshmanan et al. [13] employed validated Computational Fluid Dynamics (CFD) models for forecasting faults in external gear pumps. Various fault scenarios, including leakage flow due to radial gap degradation, axial gap degradation, an increase in electric motor speed, and changes in operating viscosity and temperature, were simulated using CFD. To streamline the process and avoid repetitive re-simulations in CFD, the authors implemented synthetic data generation techniques like noise perturbation, linear interpolation, and cubic interpolation methods. The data used are pressure, torque, and flow rate from the pump. The resulting high-fidelity experimentally validated data from these CFD simulations were then utilized to train machine learning (ML) algorithms i.e. Multilayer Perceptron (MLP) and SVM. Both ML algorithms were compared, and it was found that MLP outperforms SVM with pressure and flow rate data analysis. However, SVM was found to be superior in torque data analysis and also resistant to outliers in the data. A comparison of linear and cubic interpolation methods for synthetic data generation showed that the cubic method produced lower prediction errors. The developed technique for fault prediction, as mentioned in the study, can be utilized for pumps for single categories and experiencing repeatable loading conditions.
Zheng et al. [14] contributed to the field by focusing on the creation of a fault detection and RUL prediction model designed for internal gear pumps. The approach involved the implementation of the Robust-ResNet. Res-Net is the residual network, a part of the Convolutional Neural Networks (CNN). Robust-ResNet is the optimization model of the Res-Net. The paper notes that approximately 70% of the fault prediction relies on the extensive utilization of vibration signals [15]. However, a challenge associated with vibration signals is the interference they encounter from environmental noise, making real-time monitoring of machine status difficult. Data from the pump, reflecting diverse operating statuses, were collected via ALT, which included the introduction of Air Cleaner Fine Test Dust (NAS11) (ACFTD) to simulate and evaluate the pump’s performance in varied conditions. The article implemented a two-step classifier framework for the fault identification task. The data from four sensors, i.e. pump inlet pressure pulsation, pump outlet pressure, pump inlet side acceleration, and pump outlet side acceleration, were collected. It was found that out of four sensors, the outlet pressure pulsation signal had the strongest ability to characterize the operating status. The authors categorize the faults in three levels, i.e. normal stage, acoustic failure stage, and mechanical failure stage. In the initial stage, the model generated predicted probabilities for normal, acoustic, and mechanical fault status based on the pump outlet pressure pulsation sensor input. Subsequently, in the second step, the samples predicted as acoustic fault status were fed into the Robust-ResNet model for predicting Remaining Useful Life (RUL). The models used different lengths of data for RUL prediction algorithms, and with higher lengths of data, the diagnostic accuracy of models was high. In the second stage, they use the four-channel signals, i.e., the approach leveraged multi-channel pressure pulsation and vibration signals to enhance the overall model performance. However, the technique developed was implemented on an internal gear pump and can be tried out for external gear pumps.
Lee et al. [16] presented an RUL framework based on multi-sensor information fusion, incorporating data from vibration, pressure, and flow rate sensors. Pressure and flow-rate data helped establish health state thresholds during ALTs, while an Extended Kalman Filter (EKF) fused the degradation data. A bidirectional Long Short-Term Memory (BiLSTM) neural network trained the RUL model for future predictions. Various features were extracted from vibration signals, while pressure and flow rate data required no additional feature extraction. The fusion of multiple sensor data using the EKF technique resulted in a robust RUL estimation framework for hydraulic gear pumps, validated with performance metrics. The framework can potentially be applied to other rotary machinery fault prognostics. However, incorporating flow-rate sensor data poses challenges in integrating it into existing systems, given that flow sensors are not presently integrated into the system architecture.
Table 1 shows the gist of the fault identification algorithms, types of pumps, and types of signals for estimating different types of faults used along with their implementation. It has been observed that with the advancement of artificial intelligence and non-linearities in systems like hydraulics, the recent work published in the articles is related to machine learning-based fault identification techniques. This table also compare the implementation, computational complexity and sampling frequency requirements for the algorithms as per the criteria defined in Part-I of this article [1]. Similar tables have are presented for other components discussed in this article i.e. Table 3 for pressure relief valve, Table 5 for accumulator and Table 7 for hydraulic hose. The training process for these algorithms requires a substantial amount of data and computational resources. However, once they undergo training, these algorithms can be deployed and run on real-time devices.
Table 1 Recent fault identification techniques and signals used for hydraulic pumps
| Computational | ||||
| Type of | Type | Fault | Implementation | Complexity |
| Pump | of | Identification | & Test | & Sampling |
| (Signal) | Fault | Algorithms | Conditions | Frequency |
| External Gear (Vibration) | Casing Wear | FE = Mel-Frequency Cepstral Coefficient (MFCC) FDA = Random Forests Classifier |
Stage 1 Lab experiment under controlled environment [8] | High & High |
| External Gear (Vibration) | Bush Bearing Looseness | FE = Envelope Spectrum Acceleration | Online Lab experiment under controlled environment [9] | NM & High |
| Axial Piston Pump (Vibration) | Loose Slipper Fault | FE = Empirical Wavelet Transform (EWT) & Variance Contribution Rate (VCR) | Offline (Post Processing) [17] | High & High |
| External Gear Pump (Vibration) | Wear in different parts, Cavitation & Oil Pollution | FE = EEMD FDA = Bayesian Networks |
Stage 1 Lab experiment under controlled environment [11] | High & High |
| Internal Gear Pump (Vibration) | Volumetric Efficiency (RUL Estimation) | FE = CAE FS = VMD-MPE FDA = PSO-LSSVM |
Stage 1 Lab experiment under controlled environment [12] | High & High |
| External Gear Pump (Validated CFD models i.e. pressure, torque & flow rate) | Leakage | FDA = Multilayer Perceptron (MLP) | Stage 1 Synthetic data generation by high fidelity CFD model [13] | High & High |
| Internal Gear Pump (Pressure & Vibration) | Volumetric Efficiency Test & Roller Bearing Fault (RUL Estimation) | FDA = Robust-ResNet CNN Model | Stage 1 Lab experiment under controlled environment [14] | High & High |
| External Gear Pump (Vibration, Flow-rate & Pressure) | Volumetric Efficiency Test (RUL Estimation) | FE = Various Statistical Features FDA = EKF-BiLSTM |
Stage 2 Lab experiment under controlled environment [16] | High & High |
| External Gear Pump (Vibration) | Wear in Gear Tooth | FE = SEWT FDA = ADLSSVM |
Stage 1 Lab experiment under controlled environment [18] | High & High |
| External Gear Pump (Vibration & Flow) | Volumetric Efficiency Test (RUL Estimation) | FE = VMD FDA = Trainbr-RBFNN |
Stage 1 Lab experiment under controlled environment [19] | Low & High |
| * FE = Feature Extraction, FDA = Fault Detection Algorithm, FS = Feature Selection, NM = Not Mentioned |
In another work done by Lu and Huang [18], they used a hybrid model for Sparsity Empirical Wavelet Transform (SEWT) and Adaptive Dynamic Least Squares (ADLSSVM) for fault identification of the gear pump and compared it with the EWT and ADLSSVM or least squares SVM (LSSVM) alone. The diagnostic accuracy is also shown in the Table 2.
Table 2 Accuracy of the different fault identification techniques for Pumps
| Diagnosis Accuracy | ||
| Diagnosis Method | (Mean Square Error) | Reference |
| Logistic Regression (LR) | 92.50% | [8] |
| k-Nearest Neighbor (K-NN) | 94.67% | |
| Linear SVM (SVM-Lin) | 89.50% | |
| Gaussian-kernel (SVM–RBF) | 89.50% | |
| Gradient Boosting Classifier (GBC) | 94.83% | |
| Decision Tree (DT) | 93.00% | |
| Random Forests (RF) | 95.17% | |
| Mutli-Layer Perceptron (MLP) | 93.33% | |
| naive Bayes Classifier (NBC) | 93.83% | |
| Adaboost Classifier (ABC) | 95.00% | |
| Quadratic Discriminant Analysis (QDA) | 94.67% | |
| Gaussian Process Classifier (GPC) | 92.50% | |
| SEWT-ADLSSVM | 99.00% | [18] |
| EWT-ADLSSVM | 95.00% | |
| EWT-LSSVM | 92.00% | |
| RBFNN | 69.00% | [19] |
| ANFIS | 34.00% | |
| Trainbr-BP | 0.09903% | |
| Trainbr-RBFNN | 0.037843% | |
| ANN | 92.00–98.00% | [11] |
| SVM | 82.00–100% | |
| Bayesian Network | 96.00–100% | |
| CAE-VMD-MPE-PSO-LSSVM | 99.20% | [12] |
| VMD-MPE-PSO-LSSVM | 93.80% | |
| CAE-MPE-PSO-LSSVM | 96.30% | |
| CAE-VMD-MPE-LSSVM | 96.30% | |
| CNN | 98.43% | [14] |
| CNN+Attention | 99.64% | |
| C/D-FUSA | 99.80% | |
| FD-H 1.0 | 99.81% | |
| FD-H 0.1 | 99.96% |
The RUL prediction based upon the Bayesian regularized radial basis function neural network (Trainbr-RBFNN) for an external gear pump is done by Guo et al. [19]. The process of mitigating interference in vibration signals obtained through accelerated test has been successfully accomplished through the application of Variational Mode Decomposition (VMD). Then, the de-noisy colored signals were demodulated using the Hilbert modulation. The modulation was done to remove the negative component of the frequency. Also, the VMD algorithm was compared with EEMD and modified EEMD algorithms and the VMD was found to be superior. The end face wear of the gear pump was found to be the most serious as per the vibration data obtained in three directions. The signals demodulated to obtain the envelope using Hilbert modulation were extracted for analyzing the time domain features of the most effective IMF component. It has also been found that for the whole ALT cycle, peak-to-peak, maximum, and minimum values fluctuate slightly, which does not provide the performance degradation trend of the gear pump. The kurtosis index and root mean square (RMS) are better indicators of the performance degradation of the pump. However, the analysis performed by the VMD and modulation provides the big dimension matrix with torque and speed. Hence, to reduce the dimension reduction, the factor analysis (FA) was performed to feature fusion and dimension reduction. The Trainbr-RBFNN machine learning model was used with the fusion of flow and the degradation index obtained from vibration signals analysis. It has also been compared with the RBFNN, an adaptive network-based fuzzy inference system (ANFIS) algorithm, and Trainback propagation (BP). The Trainbr-RBFNN was found to be the best.
Figure 2, 3 and 4 shows the fault tree analysis of the gear pump. The three main fault categories for pumps are low output pressure from the pump, noise and vibration, and low output flow at high loads. Some of the failure modes of the pump, like low output pressure, are linked with the other component failures, like the relief valve, which is not completely explained in Figure 3. The Fault Tree Analysis (FTA) for the gear pump comprises six levels of investigation. Initiating from the zeroth () level, it explores the initial stage of gear pump malfunction, potentially contributing to the breakdown of the upper-level pitch system. Progressing to the first () level, attention shifts to measurable system parameters that manifest as observable effects when the pump is in an unhealthy state.
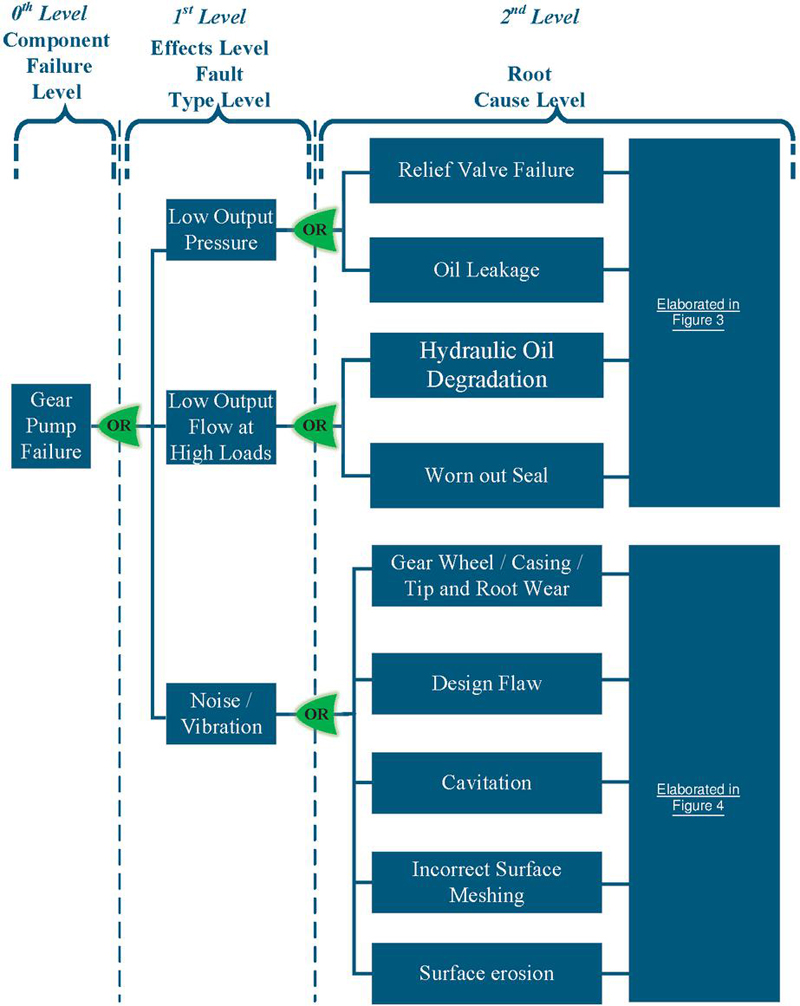
Figure 2 FTA of gear pump.
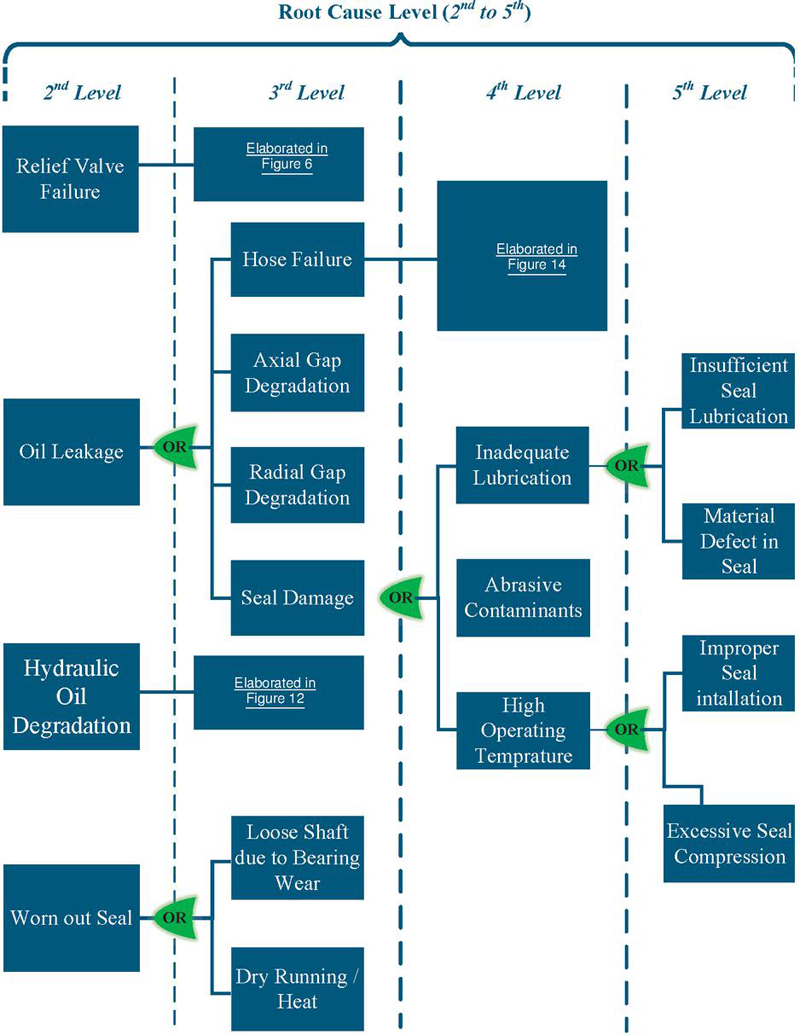
Figure 3 FTA extended from 2nd to 5th level of root causes for low output pressure and low output flow at high loads in gear pump.
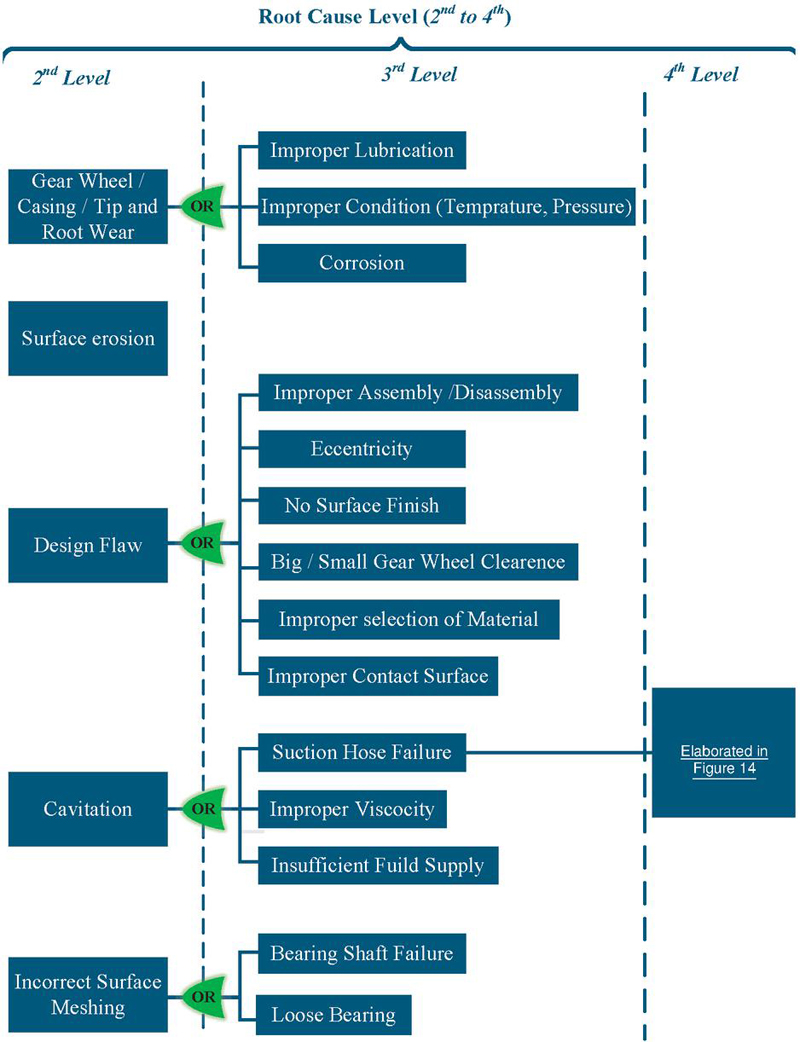
Figure 4 FTA extended from 2nd to 4th level of root causes for noise/vibration in gear pump.
In Section 2, the available literature informs the FTA exploration of deep-rooted causes underlying these effects. This analysis spans from the second () level to the fifth () level, providing a comprehensive understanding of the intricate factors influencing the gear pump’s functionality and, consequently, its impact on the upper-level pitch system failure. Some root causes are halted at the upper level due to reasons that have not been discussed in the literature. Additionally, some effects can be traced back to the failures of other components. For instance, failure effects like low output pressure in the pump are directly linked to root causes such as hose failure and relief valve failure. Out of these two components, the relief valve failure has a direct effect thus added at the () level, whereas the leakage caused due to hose failure has an indirect effect thus added at the () level. A similar kind of level segregation has been done for other effects and causes. Comprehensive explanations of the root causes for these components are elaborated upon in their respective sections. The primary reasons for failures, such as design errors, improper fluid use, and incorrect assembly following maintenance can be entirely preventable through adequate training of technical personnel, a step which the stakeholders engaged in these activities are currently undertaking. The majority of pump failures stem from fluid contamination, elevated fluid temperatures leading to accelerated wear of seal materials, and subsequent bearing failures.
In the realm of gear pump failures and their identification techniques outlined in the existing literature, a predominant focus lies in utilizing vibration signals for fault detection. Several studies have suggested the fusion of various sensor signals to forecast potential failures. In the context of gear pump failures, existing models and techniques often lack comprehensive classification for each specific failure mode. Despite this limitation, a prevalent observation is that most failure modes manifest through performance degradation. While these models may not entirely differentiate between distinct failure modes, they consistently highlight a commonality: a decline in the gear pump’s performance as a predominant indicator of potential issues. This emphasis on performance degradation serves as a key signal prompting further investigation into potential faults within the gear pump system. Also, the algorithms used for the failure mode or remaining useful life prediction require various sensors like vibration, pressure, and flow sensors. This can add a bit of cost to the system. The methods described here rely on the constant operating conditions in the lab environment, whereas for the pitch system, the operations are quite different in terms of fluctuating load demands and varying operating temperature conditions. Hence, the algorithms need to be tested for robustness for varying operating conditions in pitch systems.
3 Relief Valve
A relief valve is a critical safety component of the hydraulic system, and it is generally used in every fluid power application. Relief valves are designed to protect the hydraulic system from over-pressure by opening and releasing hydraulic fluid when the pressure exceeds a certain level [20]. The over-pressure can cause damage to the hydraulic system or can lead to the stall of the prime-mover due to overload. A brief overview of relief valves done by Yasar and Sevil [21] addresses troubleshooting related to relief valves in the hydraulic system and discusses the service related to relief valves.
The paper also provides a monogram for troubleshooting the hydraulic system to address the malfunctioning of the relief valve. A sectional view of a typical relief valve is shown in Figure 5. This is a direct-acting spring-loaded relief valve suitable for most applications at low flow rates, which are used in wind turbine hydraulic pitch applications.
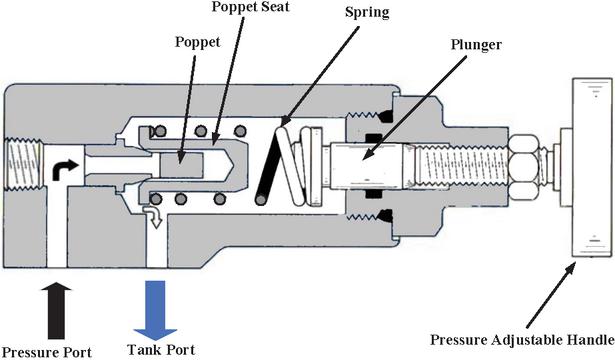
Figure 5 Sectional view of a direct acting spring loaded relief valve with indication of main parts [22].
Yin et al. [23] proposed a novel method for clamping fault diagnosis in pressure relief valves due to oil pollution. This means that the clamping force of the pollutants on the valve core is much greater than the conventional friction force. This can cause damage or displacement to the internal seal of the relief valve. The cause of this phenomenon lies in the irregular surface morphology of the valve spool at the micro level, leading to three-body contact involving the valve body, particles, and valve spool. Mathematical relations was shown explaining the clamping inside the valves. Experimental investigations were carried out using a specialized test setup, wherein a stepper motor ball-screw mechanism regulated the linear movement of the spool. For force measurements, a three-dimensional force sensor was employed. A precision tuning platform was installed directly above the force sensor to mitigate measurement inaccuracies arising from non-coaxial alignment. Two pressure sensors were also deployed for the measurement of upstream and downstream pressure of flow in and out of the relief valve. Three conditions were chosen for the collection of the data, i.e., a valve with no fault, adding iron particles, and adding sand to the valve. For training, 12,000 samples of forces in the x-,y-, and z-direction and two pressure sensors were recorded. The introduction of a fusion approach involving the elastic weight consolidation (EWC) and deep residual shrinkage network (DRSN) algorithms aimed to improve diagnostic accuracy in the multi-task state. However, applying force sensors in the industrial standard relief valves used in hydraulic systems is not yet available and seems commercially unviable. Also, the data needed for predicting the failure requires an additional pressure sensor at the outlet of the relief valve. This makes the technique practically less viable concerning the current design of relief valves.
The signal used and the six different machine learning algorithms that had been chosen for the accuracy comparison are shown in Table 3 and 4.
Table 3 Recent fault identification techniques and signal used for pressure relief valve
| Type of Valve (Signal) | Type of Fault | Fault Identification Algorithms | Implementation & Test Conditions | Computational Complexity & Sampling Frequency |
| Direct Acting Pressure Relief Valve | Clamping of spool by contamination | FDA = Different ML Algorithms [23] | Stage 1 Lab experiment under controlled environment | High & High |
| * FE = Feature Extraction, FDA = Fault Detection Algorithm, FS = Feature Selection, NM = Not Mentioned, Multiple Sensor = Refer at the text of particular reference |
Table 4 Accuracy of the different fault identification techniques for pressure relief valve
| Diagnosis Method | Diagnosis Accuracy | Reference |
| Support Vector Machine (SVM) | 73.45% | [23] |
| k-Nearest Neighbour (KNN) | 88.24% | |
| Random Forests (RF) | 90.64% | |
| ResNet | 94.13% | |
| DRSN | 97.02% | |
| MDRSN | 98.80% |
As far as the relief valve is concerned, very few papers in the literature have been found that show the faults in the valve. This may be because most hydraulic systems contain redundant safety with the main relief valve installed at the pump outlet and the auxiliary relief valve i.e. over-pressure relief valve circuit installed near the actuator end.
However, based upon the study about the faults in relief valves the FTA Figure 6, 7 and 8 gives an overview of the different faults related to the possible root causes. The failure in the relief valve can cause system effects that can be measured and are related to low/no pressure and noise, which are shown in the 1st level. From 2nd to 4th levels, the root causes of the system-level effects related specifically to the relief valve have been shown, with 2nd level focusing mostly on the damage in internal components of the valve with the deep-rooted causes shown from 3rd to 4th level.
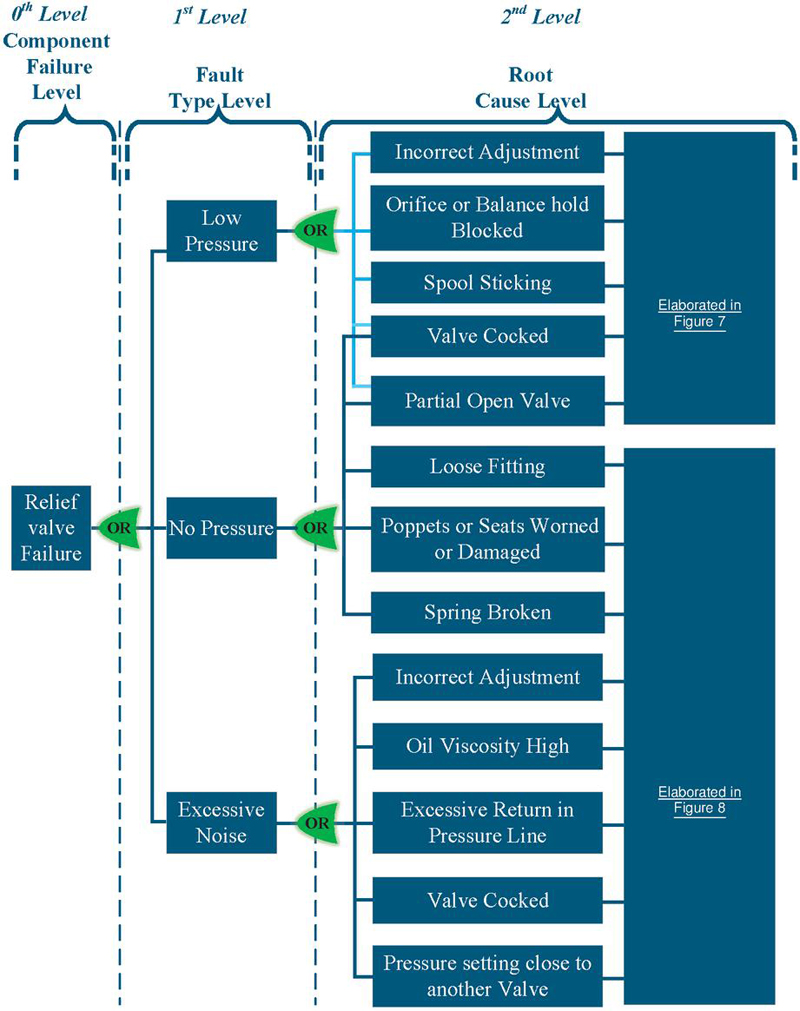
Figure 6 FTA of relief valve.
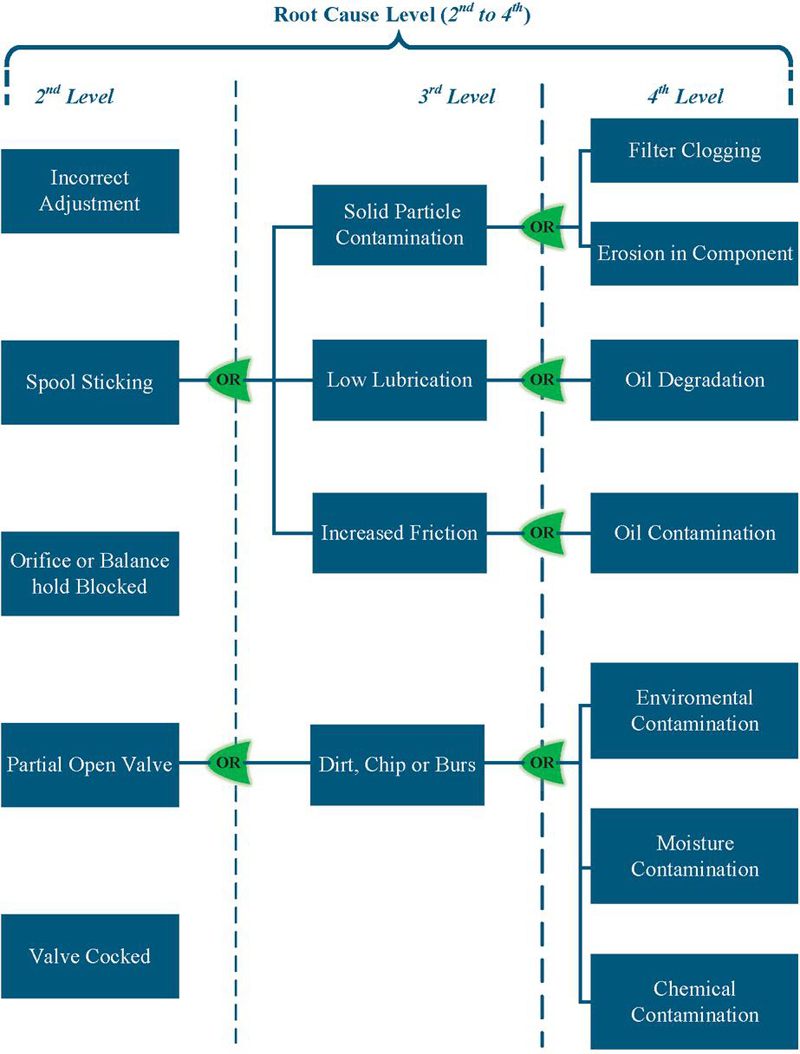
Figure 7 FTA extended from 2nd to 5th level of root causes for low pressure failures in relief valve.
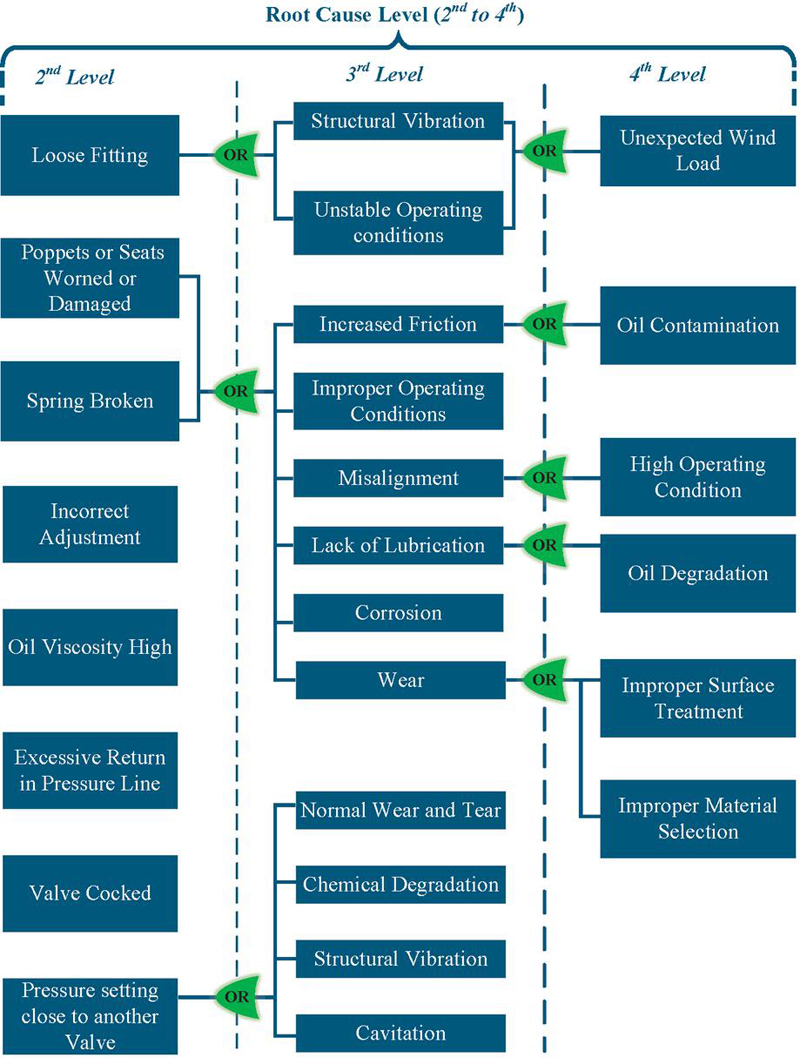
Figure 8 FTA extended from 2nd to 5th level of root causes for no pressure and excessive noise failures in relief valve.
4 Accumulators
Hydraulic accumulators play a crucial role in the hydraulic pitch control system of wind turbines. They are used as auxiliary energy storage devices to control the pitch of the blades, protecting the turbine from dangerous situations such as over-speeding during extreme wind conditions/disconnection of the turbine’s generator with the grid, and emergency shutdown of the turbine by shifting the blades to 90∘ to turbine’s rotor plane, known as aerodynamic braking of the turbine. Additionally, in the event of a power failure, they serve as a source of power to activate the brake calipers and yaw brake systems. Hence, the use of hydraulic accumulators in wind turbines is essential for the overall safety of the system [24, 25]. In wind turbine applications, piston accumulators are preferred over bladder accumulators due to historical events of catastrophic failure of the bladder, less available compression ratio, and less allowable flow rates. In contrast, piston-type accumulators exhibit gradual failure, making them a more suitable choice for safety-critical applications such as wind turbines. Also, the piston accumulator features piston seals with a small cross-sectional area, which reduces the impact of gas permeation to the fluid side. On the other hand, in bladder accumulators, the larger contact surface area of the bladder enables greater gas permeation [26]. Also, in the magazine blog [26], the two fault modes of the piston accumulator had been defined as firstly, when hydraulic fluid leaks through the hydraulic seals through piston rings and raises the pressure of the pre-charge gas and secondly when the gas leaks into the hydraulic fluid or leaks outside the accumulator. The sectional view of the accumulator has been shown in Figure 9.
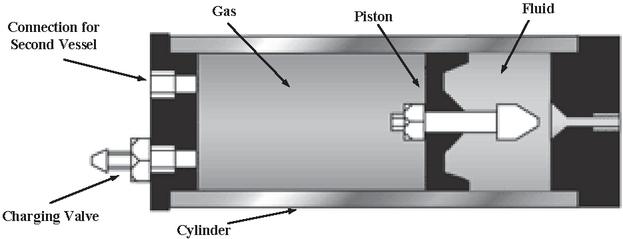
Figure 9 Piston accumulator. the image has been inspired from [27].
Table 5 shows the fault identification algorithms tested for the piston-type accumulators and are relevant for the hydraulic pitch system applications.
Table 5 Recent fault identification techniques and signal used for hydraulic accumulator
| Computational | ||||
| Type of | Type | Fault | Implementation | Complexity |
| Accumulator | of | Identification | & Test | & Sampling |
| (Signal) | Fault | Algorithms | Conditions | Frequency |
| Piston Accumulator (Pressure) | Gas Leakage | FE = Multi-resolution Signal Decomposition (MSD) | Stage 1 Lab experiment with simulated loading conditions from high fidelity simulation [28] | High & NM |
| Piston Accumulator (Pressure, Temperature, Flow) | Gas Leakage | FDA = Extended Kalman Filter (EKF) | Online Lab experiment with simulated loading conditions from high fidelity simulation [29] | Medium & Medium |
| Piston Accumulator (Pressure, Temperature, Position) | Gas Leakage | FDA = State Augmented Extended Kalman Filter (SAEKF) | Online Lab experiments under controlled conditions [30] | Medium & NM |
| Piston Accumulator (Cylinder Position & Accumulator Pressure) | Low Pre-charge Pressure | FDA = Various Sensor Data Processing | Stage 1 Simulation based using high fidelity models [31] | Low & High |
| Bladder Accumulator (Pressure) | Low Pre-charge Pressure | FE = Loading time & Area under loading curve (Image) & Statistical Features FDA = Support Vector Machine(SVM) |
Stage 1 Lab experiments under controlled environment [32] | High & Medium |
| Bladder Accumulator (Pressure) | Low Pre-charge Pressure | FE = Time domain features correlated by Pearson’s correlation coefficient FDA = Support Vector Machine(SVM) | Stage 1 Lab experiments under controlled environment [33] | Low & Medium |
| Bladder Accumulator (Pressure) | Low Pre-charge Pressure | FE = Time and frequency domain & FDA = Different Machine Learning Techniques | Stage 1 Lab experiments under controlled environment [34] | High & Medium |
| * FE = Feature Extraction, FDA = Fault Detection Algorithm, FS = Feature Selection, NM = Not Mentioned, Multiple Sensor = Refer at the text of particular reference |
Various studies have demonstrated that fault detection and diagnosis methods could be applied to detect and diagnose accumulator faults that occur due to gas leakage. A signal-based gas leakage detection method, utilizing multi-resolution signal decomposition based on wavelets on the pressure signal installed close to the accumulator, was proposed by Liniger et al. [28]. Using the characteristics of wavelets, the root mean square of the level 9 detail coefficient as the feature of the pressure signal was found to be robust and the most sensitive indicator for gas leak detection. The simulation outcomes showcased the algorithm’s efficacy in identifying and containing pre-charge pressure variations within a complex setting involving multiple faults, including both fluid and gas leaks occurring simultaneously. The robustness of the method decreased at low ambient temperatures but works fine between 22-60 ∘C. Also, the localized high temperature at the accumulator’s location lowers the algorithm’s robustness at lower temperatures. Experimental validation on a small-scale accumulator operating under wind turbine conditions confirmed the efficacy of the method. A downside of the method is that it needs persistent excitation of the accumulator dynamics. Some accumulators are not used during normal operation. In this case, the method is not usable. Another work done by Liniger et al. [29] designed and applied an Extended Kalman Filter (EKF)-based gas leakage detection method for accumulators in wind turbines, taking into account the change in ambient temperature with the usage of a limited number of measurements which are already available in a turbine. Experimental results in the work showed precise pre-charge pressure estimation using the input flow measurements. However, an unacceptable drift was observed for the pre-charge pressure measurements when using the estimated flow measurements. However, a good estimate of the pre-charge pressure was obtained during the initial start-up of the turbine.
To overcome the drift issue in the previous research Asmussen et al. [30] investigated gas leakage detection by estimating the pre-charge pressure of a hydraulic piston accumulator using a State Augmented Extended Kalman Filter (SAEKF) algorithm. The algorithm utilized temperature measurements on the accumulator surface as inputs, enabling the isolation of gas leakage to a single accumulator within a bank. The SAEKF was model-based, estimating the amount of nitrogen gas and gas temperature moles to determine the pre-charge pressure. Experimental testing under varying load conditions and pre-charge pressures addressed issues reported in previous works, resolving pre-charge pressure drift. Despite estimated offsets, the SAEKF settled to constant values for a given pre-charge pressure, demonstrating its capability to detect changes over time.
Elorza et al. [31] had suggested an algorithm to detect, identify, and quantify four hydraulic pitch system failure modes that were not easily detectable through direct measurement. Using the most accurate model available, the authors conducted five hundred simulations of ten minutes each using a DTU 10 MW turbine using OpenFAST software developed by NREL. The authors showed that failure modes were identifiable from their effects on the relationships between measured variables. The failure inserted was the piston seal leak at blade 1, the pump leak of 6 liters per minute which was less than 10 % of the nominal flow rate supplied by the pumps, the accumulator gas leak at blade 1 which was setting the nitrogen content of one of the accumulators to 50 % of the nominal and the extra friction of 200 kN at blade 3 which was about 25 % of force available per blade. Out of 500 simulations, 100 of it was with nominal pitch conditions, and the remaining ones were with each failure mode. The data from the simulations were then cherry-picked using the pre-designed selection algorithms explained in the article. Despite the high realism of the simulation data, the test bench data process was necessary for further validation. While it had been expected that component failures impacted measurable variables, such as increased accumulator fluid consumption, using data processing algorithms to observe these effects required careful consideration. The goal had not been to replace monitoring algorithms that shut down turbines at critical thresholds but to interpret data to estimate how close the turbine was to pitch system failure. Although feasible, conducting tests where different failures were intentionally caused on an actual turbine would have been costly and complex.
In another work done by Pichler et al. [32], the two faults in the pump-accumulator charging system were identified. The system under investigation used the fixed displacement pump for charging the accumulator working under bang-bang control mode with a relief valve acting as a pressure control device. The two fault modes considered were leakage in the pump and pre-charge pressure loss. Different fault identification approaches were used. Firstly, the time required to load the accumulator was compared with the nominal loading time. However, the time was estimated without considering the temperature. The increase in the loading time signified the leakage in the pump and the decrease in the charging time signified the leak in the accumulator. This was called a naive approach which was not very sophisticated and simple to solve. Other approaches used were first, feature engineering, where the loading curves for different fault states were investigated and machine learning classifiers like support vector machines (SVM) were trained. Secondly, image processing, where the accumulator loading pressure time series was transformed into an image followed by a neural network for fault identification. Thirdly, statistical feature extraction methods on raw data were deployed and SVM was used for fault classification. Thus, machine learning approaches showed better results in multi-fault environments as compared to the naive approach, which shows the robustness of the machine learning-based algorithms. Table 6 shows the diagnosis accuracy of the different machine-learning techniques used in the past for fault identification in hydraulic accumulators.
Table 6 Accuracy of the different fault identification techniques for hydraulic accumulator
| Diagnosis Method | Diagnosis Accuracy | Reference |
| Naive Approach | 71.80% | [32] |
| SVM | 97.90 % | |
| LDA | 54.00 % | [33] |
| ANN | 50.40 % | |
| SVM (Linear) | 51.60 % | |
| SVM (RBF) | 65.7 % | |
| Threshold Averaging Method | – | [34] |
| SVM | 85.71 % | |
| XGBoost | 88.57 % | |
| CNN | 97.14 % | |
| CNN Autoencoder | 72.72 % | |
| LSTM Autoencoder | – |
Helwig et al. [33] developed a method to detect gas leakage of hydraulic systems using multivariate statistics based on multiple signals. The fault-related features were extracted and linear discriminant analysis (LDA) was utilized to classify fault conditions. The proposed method was validated experimentally under both fixed and random working cycles. It effectively distinguished pre-charge pressures of 90, 100, 110, and 115 bar during fixed cycles. Its performance decreased when detecting changes in pre-charge pressure during random working cycles, which are typical for pitch systems. However, the authors discussed that the accuracy of fault classifiers can be enhanced with the increased window size required for the analysis. This holds valid for the slow progression of faults like the gas leakage and leakage of the pump. In Table 6, the system has the accuracy for different classifiers used in this article are shown based on random working cycles for accumulator low pre-charge pressure fault.
In the work done by Park et al. [34], the bladder accumulator used in marine engines has been investigated for its failure until breakage using a digital pressure sensor. The accumulator installed on the marine engines operates the fuel injection and exhaust systems and works under extreme vibration and pressure conditions. In the experimental scenario, the accumulator is charged/discharged between 200 and 400 bar with a 0.4s on/off cyclic operation of the pneumatically actuated valve to emulate the engine operation. Based upon the experimental data obtained till failure, the pressure signals showed an anomaly 2.7 h before the breakage of the accumulator using the threshold averaging method. The anomaly shows the rise in the amplitude of the pressure signal which was recorded as 1.002 times the maximum average threshold and 0.998 times the minimum average threshold. The anomaly detection algorithm was developed in this study to detect the failure in advance. Six different algorithms were tested, and their accuracies are shown in Table 6. Based upon the work, it had been shown that machine learning techniques such as SVM, XGBoost, CNN, and CNN/LSTM auto-encoders showed a good prediction for the failures based upon the analysis in the measured signal. For CNN and auto-encoder algorithms, the difference between the images of pressure pulsations was used for anomaly detection. However, the algorithm was implemented on repeated loading cycles, which may hold for engine applications rather than wind turbine pitch applications. Also, the algorithm was implemented on the bladder accumulator, which is not used for wind pitch applications.
In conclusion, the accumulators, which are safety-critical equipment of the wind turbines, show the significance of the study of its faults. The researchers in the past worked on wavelets, and Kalman Filters to estimate the fault identification parameters using the available sensors on the turbine’s pitch system. Also, data-driven detection methods based on machine-learning techniques have been used for applications that are quite different from the wind turbine loading conditions. These algorithms can be explored for wind turbines. However, the unknown loading condition in wind turbines makes it challenging for the machine learning algorithms with a lack of available data on all working scenarios. However, the linking of physics behind the working of an accumulator and machine learning techniques can make fault detection methods more robust.
The FTA of the piston accumulator has been described in Figure 10 and 11. Starting from the level it shows the different system-level effects concerning the failure in the accumulator. From to level, the causes for these effects are shown at three levels to understand better the deep-rooted reasons for faults at the accumulator level. In the first level of FTA, the low active time means due to a fluid leak in the gas side of the accumulator, there is less available time of oil to move the load.
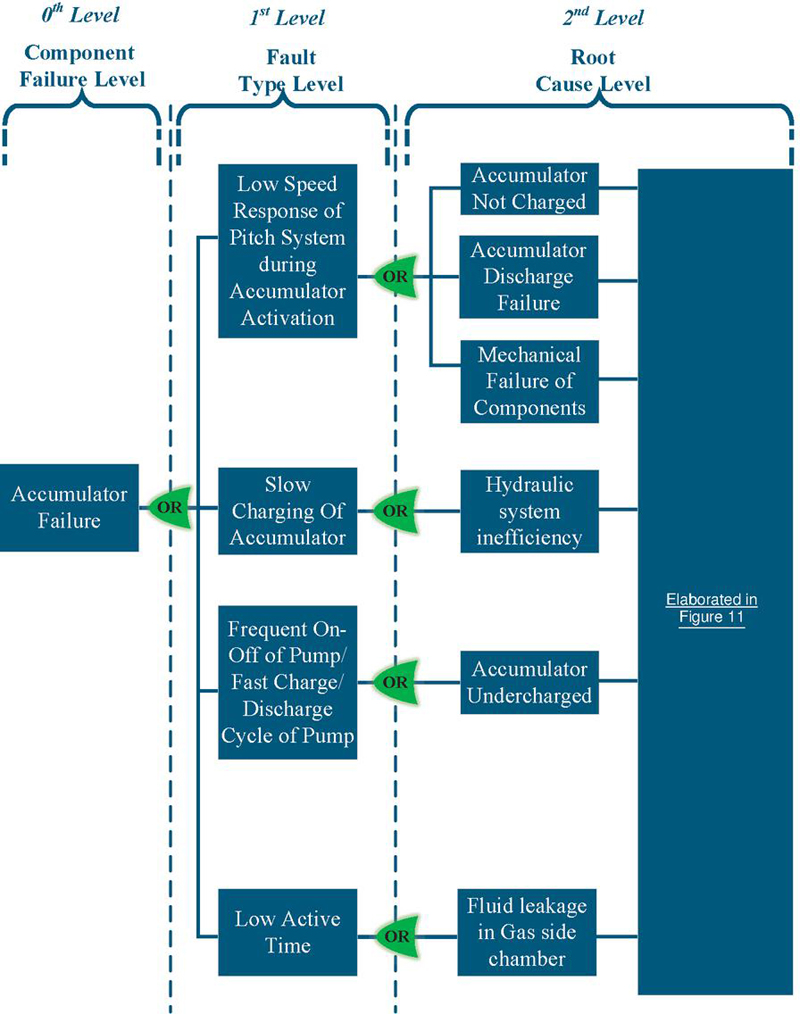
Figure 10 FTA of piston accumulator used in hydraulic pitch system.
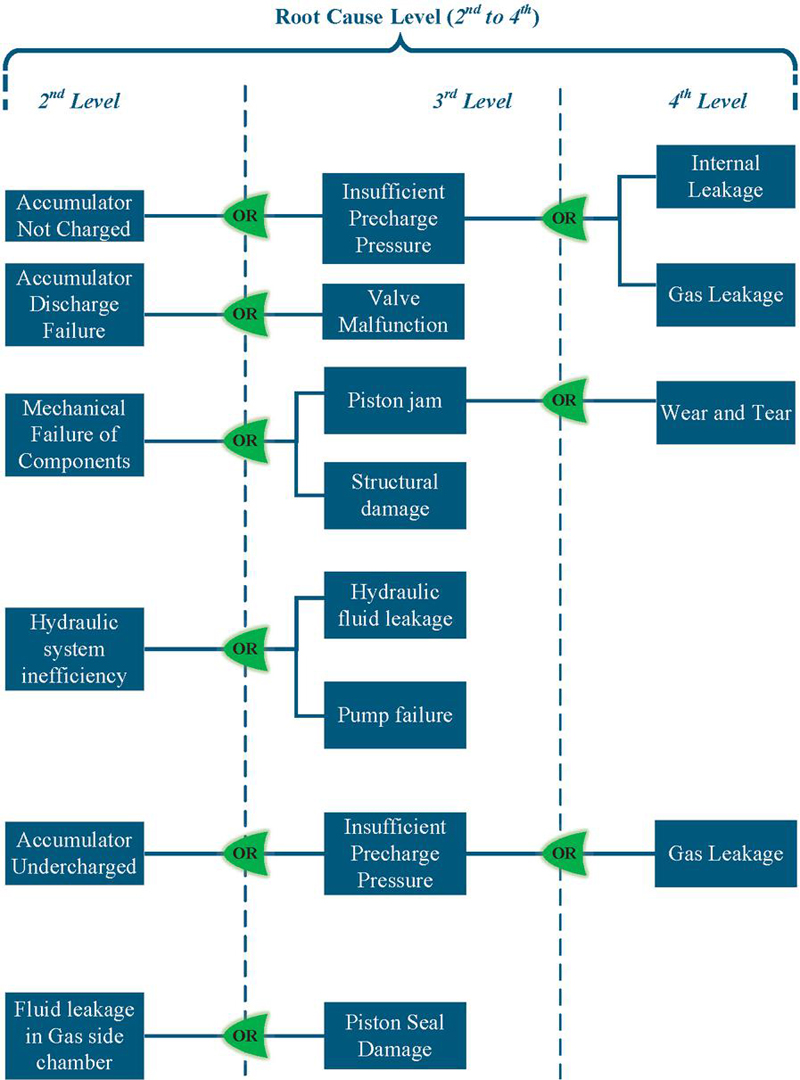
Figure 11 FTA for piston accumulator from 2nd to 4th level.
5 Hydraulic Oil
The most common causes of hydraulic oil faults include contamination, temperature problems which can cause the breakdown of the additives, fluid levels, and quality. Contamination results from air, water, or particulate matter, leading to poor hydraulic performance and oil degradation. Temperature problems, such as high fluid temperature, could cause abnormal noise, slow operation, and accelerated oil aging. Maintaining proper fluid levels and quality and using the specified fluid types is crucial to prevent hydraulic system problems.
As hydraulic technology has advanced, hydraulic oil has faced increasing performance demands. Lu et al. [35] established a bench test to assess the low-temperature cold start performance of hydraulic oil, providing crucial insights for military equipment oil requirements. The focus extended to physicochemical properties, anti-wear, and oxidation performance. The anti-wear evaluation had been extensively studied, especially in the Vickers 104C vane pump, Komatsu HPV35+35, and T6H20C hybrid pump tests. Reliable cold-start capability at low temperatures is essential for military equipment but has been insufficiently studied. The study showed that the change in the oil properties can significantly lower the performance of well-engineered hydraulic equipment.
Zhou et al. [36] introduced a reliability optimization design approach for hydraulic systems with a focus on oil contamination. The method established an oil contamination control model, quantifying contamination in different system parts. It integrated a global reliability model, linking oil contamination status with real-time reliability. Four key factors — system structure, cost, performance, and reliability — formed a multi-objective optimization model, with cost minimization as the objective. The assumptions in the contamination control model were that the number of contaminated particles follows a normal distribution. Hence, any new particles entering the oil system differ from the contaminated particles between upstream and downstream oil and follow the constant normal distribution [37]. Secondly, it was assumed that the number of wear particles from hydraulic components is stable and follows a constant normal distribution. Thirdly, the settlement of wear particles in components was assumed to be zero, and settlement ratios of filters with different sizes are different constants at the filters. It was found from the sensitivity analysis that the optimization results were more sensitive to the filter’s filtering ratio and settlement ratio. Hence, this approach can be useful while estimating the reliability of the hydraulic system including oil contamination in the modeling process. The oil contamination model is shown in Equation 1.
| (1) |
In Equation (1), are the number of contaminated particles with sizes greater than at point k, X refers to currently contaminated particles in the system, Y refers to original contaminated particles, Q refers to particles due to external exposure into the system, S is naturally occurring contaminated particles into the system and L means the contaminated particles that are filtered from the system. When applied to the oil supply of a heavy CNC horizontal lathe, sensitivity analysis highlighted the filter’s ratios. The obtained results confirmed the validity and practicality of the proposed reliability optimization design model for hydraulic systems considering oil contamination.
Marinescu et al. [38] examined the effect of solid contaminant particles on two hydraulic gear pumps using a Laser CM Parker analyzer and Brookfield viscometer. It was found that using the Laser CM Parker analyzer, for the pump, particles with diameters d (4, 6, 14, 21) µm showed increased pump wear, while larger particles had minimal impact. Similarly, for the pump, particles with diameters d(4, 6) µm had affected pump wear, while larger particles had minimal impact.Furthermore, the Brookfield CAP2000+ viscometer showed an increase in the apparent viscosity of used oil in both pumps due to higher contaminant particle counts post-run-in. The rheological models chosen for both pump oil samples were the power law model for the pump and the Newtonian model for the pump. Key parameters for evaluating pump contamination were the consistency index and flow rate, while dynamic viscosity was crucial for assessing the pump contamination. However, the detailed difference in the pumps has not been mentioned in the paper, but the technique explained can be used for failure analysis of the pump by monitoring the particles in the oil.
A novel impedance sensor was proposed by Shi et al. [39] for the comprehensive detection of multiple contaminants in hydraulic oil. It employed inductance-resistance and capacitance modes to differentiate metal debris, water droplets, and air bubbles. Silicon steel strips enhanced magnetic field strength, thus improving detection sensitivity. The obtained results showed higher sensitivity for iron debris with inductance and for copper debris with resistance. The detection floor level for copper debris had been reduced, enhancing detection of non-ferromagnetic metal debris. The sensor had distinguished contaminants 28 m iron debris, 70 m copper debris, 160 m air bubbles, and 95 m water droplets. Offering a simple, cost-effective solution, it has the potential for fault diagnosis in offshore hydraulic machinery.
Zeng et al. [40] introduced a micro inductive sensor based on the inductive Coulter principle for monitoring non-ferrous wear debris in hydraulic oil. The sensor was comprised of a straight micro-channel and a 3-D solenoid coil wound on the micro-channel. Instead of detecting inductance changes, the sensor detected equivalent resistance changes for monitoring copper particles. Simulation results showed the resistance change rate caused by copper particles that surpassed the inductance change rate. The obtained experimental results using copper particles ranging from 48 µm to 150 µm validated the simulation findings. Compared to the inductance method’s 70 µm detection limit, the equivalent resistance method achieved a 48 µm detection limit, and improving both sensitivity and signal-to-noise ratio (SNR) significantly. The introduced method enhanced micro inductive sensor accuracy, facilitating rapid detection of non-ferrous wear debris in hydraulic oil.
The FTA of the hydraulic oil has been described in Figure 12 and 13. The level shows the system level faults that occur due to the hydraulic oil failure if it’s treated as a component and at and level the reasons for the level faults focusing on the hydraulic oil.
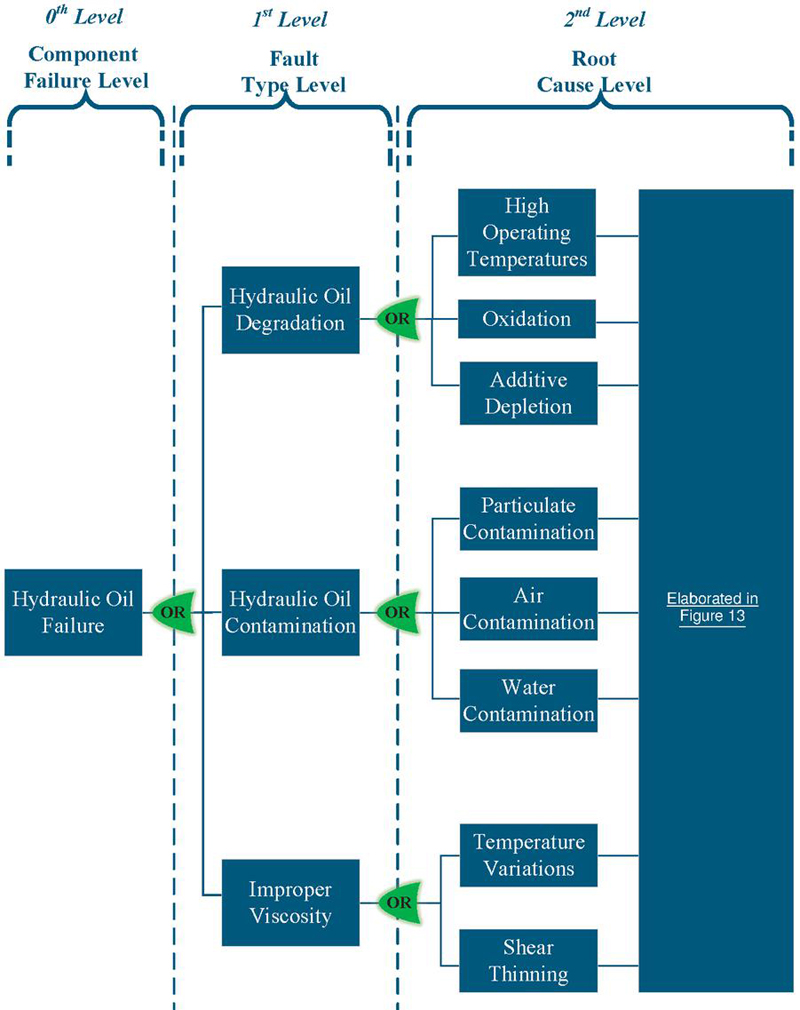
Figure 12 FTA of hydraulic oil used in hydraulic pitch system.
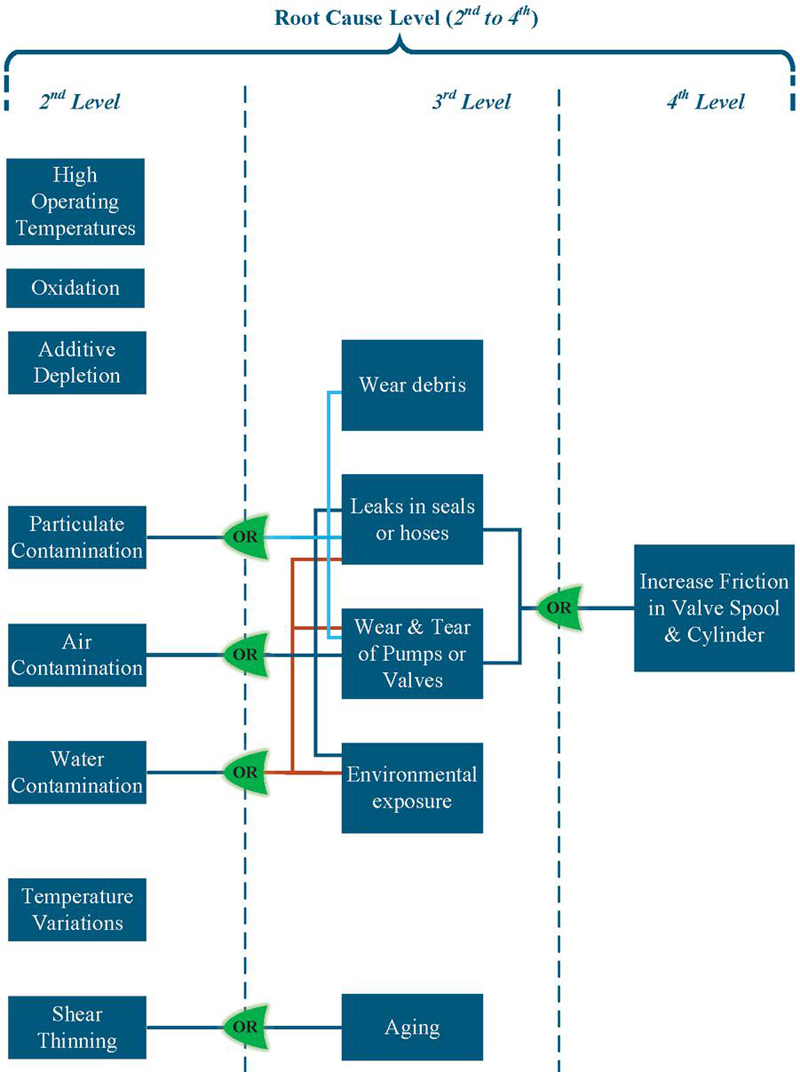
Figure 13 FTA for hydraulic oil from 2nd to 4th level.
6 Hydraulic Hose
The common causes of hydraulic hose failure include abrasion, poor routing, high temperatures, tube erosion, bent hoses near fittings, fluid incompatibility, improper assembly, overheating, poor depth of insertion, and kinking at or near the fittings [41, 42, 43, 44]. These factors can lead to serious consequences such as machine shutdown, expensive repairs, financial losses, and potential physical injury to employees. It is important to address these causes to prevent hydraulic hose failures and ensure the smooth operation of equipment and systems.
Hyvärinen et al. [45] studied the dynamic behavior of a hydraulic hose, utilizing a numerical modeling approach with a boundary element method for fluid-elastic analysis, validated by experimental modal analysis. The investigation revealed complex coupling of pure structural bending modes under internal flow, becoming more sensitive to excitation with increased flow rates. A parametric study highlighted the significant impact of hose end-support stiffness, showcasing static instability with a soft support. Pre-tension stabilized hose dynamics, and changes in internal pressure had limited influence within the investigated pressure range. Smaller diameter hoses were found more sensitive and provided sufficient pre-tension for static stability across the entire flow rate range. Li et al. [46] experienced oil leakage and bulging during a low-temperature static test of a specific model in the hydraulic system hose. Macroscopic, anatomical, scanning electron microscope, and infrared spectrum analyses were conducted on the failed high-pressure hose. The investigation revealed that the inner rubber cracking caused high-pressure oil leakage, and the outer CPE material locally bulged. The inner rubber cracking was attributed to uneven inner steel wire winding and low elongation with poor deformation ability.
Ying et al. [47] proposed an automated YOLOv5-based (You Only Look Once) method for detecting surface defects in high-pressure steel wire braided hoses. The YOLO algorithm enables high-speed detection and recognition of multiple object classes, improving prediction scales for detecting small targets like miniature cameras, and achieving real-time crack detection. Key improvements include optimizing anchor boxes with K-means++, using Focal loss to balance samples, modifying prediction heads for ultra-small defect detection, and incorporating an Efficient Channel Attention (ECA) mechanism. The modified YOLOv5s model achieved 92.20 % accuracy and 23 FPS (Frames Per Second), significantly outperforming manual inspection.
Klarecki and Rabsztyn [48] developed a model and conducted experimental studies on the influence of a hydraulic hose with a minimess-mounted pressure transducer where the signals from the pressure transducer were analyzed during high dynamics of hydrostatic drives and controls. Two types of hoses were considered: DN2 (Internal Diameter 2 mm) and DN4 (Internal Diameter 4 mm), with lengths of 0.4 m, 0.8 m, and 1.5 m. The average pressures considered were 50 bar, 100 bar, and 150 bar. The cut-off frequencies for each length for DN2 were 0.2 Hz, 0.05 Hz, and 0.01 Hz respectively, and 15 Hz, 4 Hz, and 1 Hz for the DN4 hose . Model test results indicated that measuring hoses could function as hardware low-pass filters during digital pressure waveform recordings, although the model’s cut-off frequency values had been significantly lower than those observed experimentally. The experimental results showed that measuring hoses was only reliable for average pressure measurements and that the hose length should be carefully chosen for pressure waveform measurements due to the non-linear relationship between hose length and cut-off frequency. Numerical simulations had partially confirmed the expectation that measuring hoses acted as low-pass filters, but the unexpectedly low cut-off frequencies for the DN2 hoses suggested possible issues with the mathematical model. The effect of hydraulic hoses acting as low-pass filters can be kept in mind while developing the digital twins of the hydraulic system for fault identification in general.
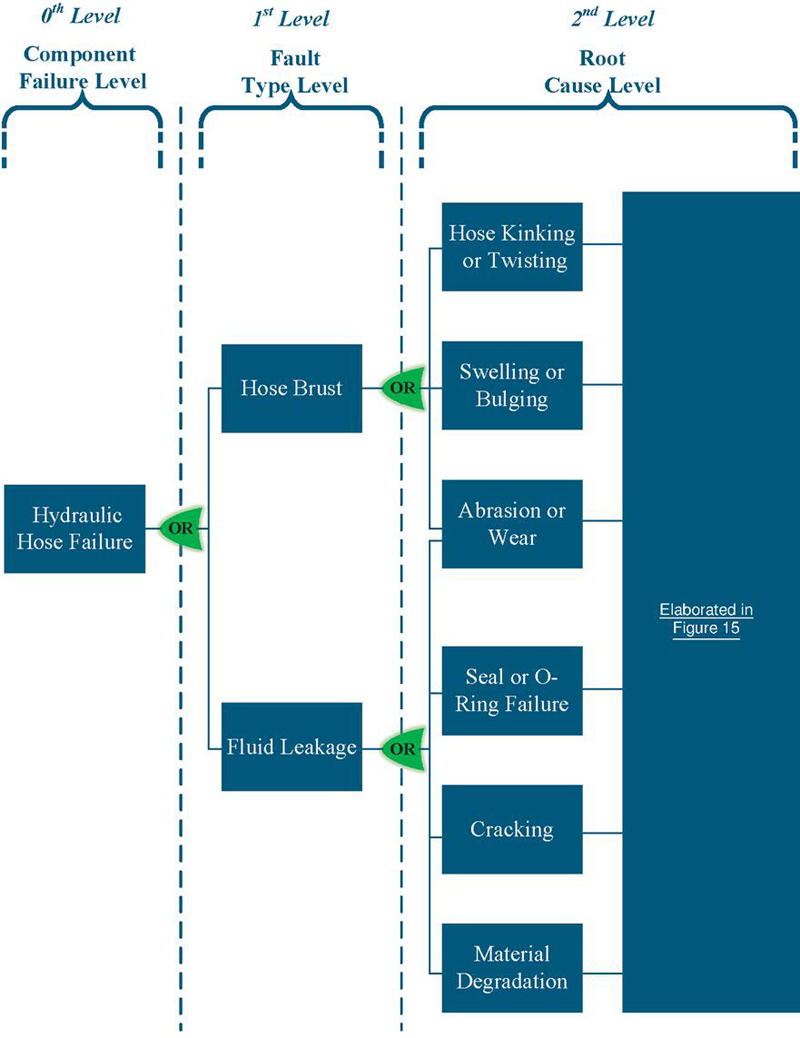
Figure 14 FTA of hydraulic hoses used in hydraulic pitch system.
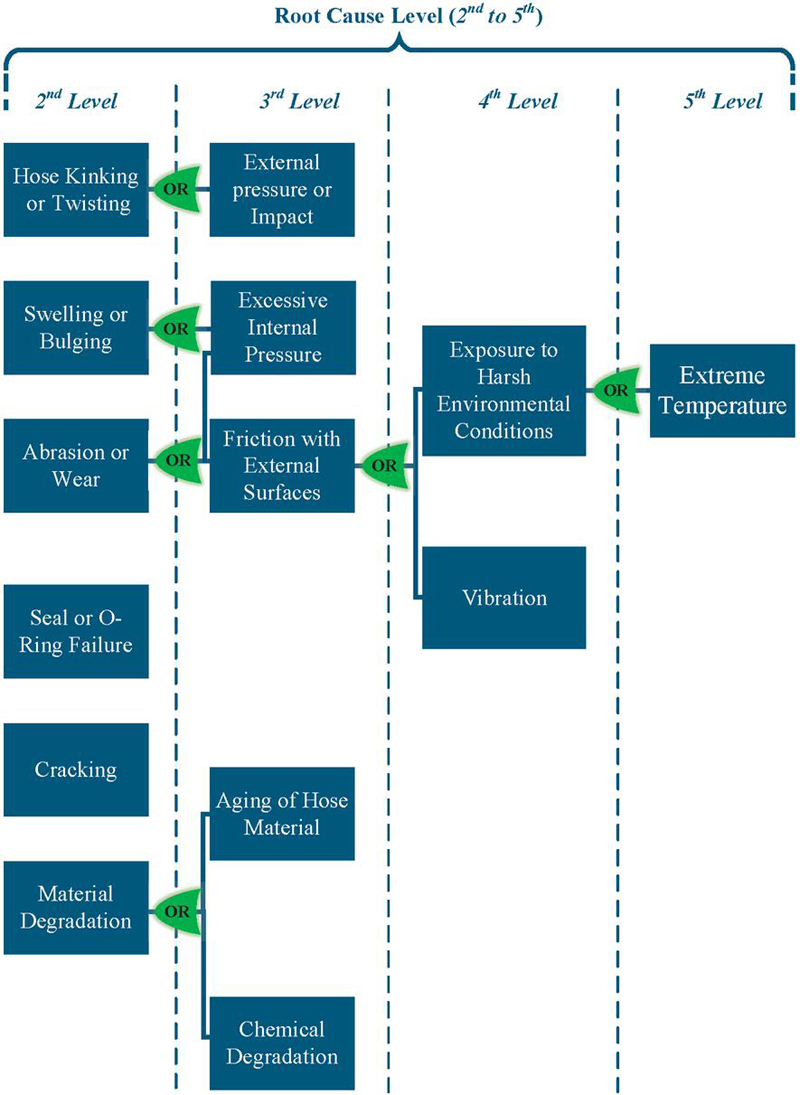
Figure 15 FTA for hydraulic hoses from 2nd to 5th level.
The FTA for hydraulic hose failure is provided in Figure 14 and 15 as the detailed hierarchical breakdown of potential failure modes, organized into multiple levels. The level shows the fault effects due to hose failure. From the level, the root causes of the faults of the hose have been discussed. One of the significant categories is fluid leakage, which can result from slow failure of the hose, causing physical damage to the hose. A hose burst might also occur due to excessive internal pressure exceeding the hose’s capacity which can be catastrophic. Other factors include hose kinking or twisting from improper installation or handling, continuous vibration leading to fatigue, and exposure to harsh environmental conditions such as extreme temperatures, chemical degradation, or natural aging of the hose material. Constant friction with external surfaces can also cause wear and tear. Another major category is seal failure. Cracking can develop in seals, leading to leakage, while material degradation can result from continuous abrasion or wear. Seals may swell or bulge due to chemical exposure or pressure, and excessive internal pressure can further compromise their integrity. Tables 7 and 8 show the fault identification and the accuracy of the hydraulic hose, respectively.
Table 7 Recent fault identification techniques and signals used for hydraulic hose
| Type of Hose (Signal) | Type of Fault | Fault Identification Algorithms | Implementation & Test Conditions | Computational Complexity & Sampling Frequency |
| Wire Braided Hose (Image) | Wire Defect (Missed, Stacked, Loosened) | Modified-YOLOv5s | Offline (Post Processing) [47] | Possible |
Table 8 Accuracy of different fault identification techniques for hydraulic hose
| Diagnosis Method | Diagnosis Accuracy | Reference |
| YOLOv5s | 88.70% | [47] |
| Faster R-CNN | 76.50% | |
| SSD | 84.00% | |
| Modified-YOLOv5s | 92.20% |
7 Conclusions
This paper focused on the reliability and failure analysis of the hydraulic pitch system in wind turbines, which is essential for optimizing blade angle and control. It is the second part of the “Review of Fault Detection and Diagnosis Methods Including Failure Root Causes of Major Components of Hydraulic Pitch System for Wind Turbines Part-I [1].” This study explored Fault Tree Analysis (FTA) to investigate the potential failures in key hydraulic components considering: hydraulic gear pump, relief valve, accumulators, hydraulic oil, and hydraulic hoses. Other major components of the hydraulic pitch system, such as hydraulic cylinders, on-off solenoid valves, proportional valves, and sensors, were discussed in Part I [1]. Table 9 has been provided to discuss the algorithms for the online implementation. The detailed discussion behind this table has been already discussed in the Part-I [1] of this article.
Table 9 Algorithms and recommendations for online implementation
| Big O Notation | |||
| Algorithm | Why It Is Suitable | (Complexity)[49] | Recommendation |
| Gear Pump | |||
| FE = Mel frequency spectral coefficients (MFCC); RF ;k-NN; SVM | Transparent (white-box), fast, interpretable; Reduces overfitting, robust, high accuracy; Captures nonlinearities [8] | FE = O(n) Training = O() Inference = O(n) | Not robust alone due to overfitting; Best accuracy but computationally expensive |
| FE = Sparsity EWT FDA = EWT-ADLSSVM |
Adaptive feature extraction; Handles non-stationary signals; Reduces local minima issues[18] | FDA Training = O() Inference = O(n) | Depends heavily on Fourier segmentation; adaptiveness ; high accuracy |
| FE = Factor Analysis (FA) FDA = VMD-Hilbert ; RBFNN |
Compratively better noise reduction ; failure time effectively predicted [19] | FDA Training = O() | Strongly recommended for preprocessing vibration signals; RUL prediction and degradation assessment |
| FE = EEMD FDA = Bayesian Network |
Multi-source information fusion; naked eyes inspection and maintenance records to identify the fault [11] | FDA Training = O() | Effective and Efficient based on vibration signals |
| FE = CAE FDA = LSSVM |
Moderate – learns features unsupervised, denoises and enhances relevant states; clarifies embedded fault features;robust to outliers and noise [12] | FE = O(n) Training = O() Inference = O(n) | For harsh/noisy environments; for imbalanced/small-sample fault pattern classification |
| FE = CNN FDA = ResNet |
Excellent hierarchical feature extraction, fast inference, real-time deployment possible; Supports ultra-deep networks, better gradient flow, improved generalization [14] | FE = O(n) Training = O(n) Inference = O(n) | limited in noisy/fault-sparse or dynamic scenarios;consider noise mitigation strategies |
| Algorithm | Why It Is Suitable | (Complexity)[49] | Recommendation |
| Pressure Relief Valve | |||
| FDA = SVM; KNN; RF; ResNet; DRSN; MDRSN | Small/clean data; Quick prototyping; Moderate noise; Pattern-rich, larger/complex datasets; overlapped classes, signal-driven diagnostics [23] | FDA Training = O() | Good for deep learners; Sensitive to distance metric; Ensembling provides stability; challenging industrial diagnosis |
| Accumulators | |||
| FE = SVM | Interpretable; discriminates border cases; scalable [32] | FDA Training = O() | Quick screening; Detailed fault diagnosis; larger datasets |
| Classification = LDA; ANN; SVM (linear); SVM (RBF) | minimizes cross-sensitivity; effective with time/freq features; Captures non-linear faults; Robust for small–medium data; Identifies fault-specific features [33] | FDA Inference = O(n) Training = O() | Efficient; interpretable; scalable; Use with larger datasets; Best for slow-degrading faults; robust and fast |
| FDA = SVM; XGBoost; CNN; CNN Autoencoder; LSTM Autoencoder | Very simple and fast; suitable for real-time anomaly alerts; Handles non-linear data well; robust with image-based features; effective for pulsation patterns [34] | FDA Detection = O(1) Inference = O(n) Training = O() | Good as a baseline method; Good balance of accuracy and efficiency; suitable for real-time; Best for image-transformed datasets |
| Hydraulic Hose | |||
| FDA = YOLOv5s | High Accuracy; Recognition Efficiency; Better performance in all defect classes [47] | FDA Training = O() | one-stage detection algorithm; detection task as an end-to-end regression; flexible and productive; smaller and faster |
The FTA method was used to identify failure modes and construct fault trees for each component. For the hydraulic gear pump, potential failures include wear and tear, contamination, cavitation, and thermal degradation, primarily caused by inadequate lubrication, foreign particles, improper maintenance, and excessive load. The relief valve’s potential failures include blockage, improper pressure settings, and mechanical wear, with are caused by factors such as contaminated oil, incorrect installation, and high-pressure operation. When considering piston-type accumulators, the faults relate to leakage, piston seal damage, and pre-charge pressure loss due to material fatigue, incorrect pre-charge pressure, and excessive cycling. When it comes to hydraulic oil, the faults include risks of degradation, contamination, and improper viscosity, often due to inadequate filtration, high operating temperatures, and improper selection. Hydraulic hoses are prone to cracking, abrasion, and leakage, primarily from environmental exposure, improper routing, and mechanical damage.
The fault identification and condition monitoring algorithms, including remaining useful life estimation, have been discussed for the gear pump and piston-type accumulator. Some artificial intelligence or machine learning-based algorithms require high computational power for real-time implementation but can be effective for post-processing data to identify faults. Additionally, physics-based models, such as observer methods like the Kalman Filter, have been tested on the piston-type accumulator and show potential for real-time implementation. However, these methods require accurate models to produce robust results. For auxiliary components like relief valves, hydraulic oil, and hydraulic hoses, fault identification has seen limited research due to the routine replacement of these components during preventive maintenance. Oil contamination, however, is a significant source of many hydraulic problems and can cause cascading failures. Monitoring oil conditions could be a solution, but it is necessary to evaluate the economic viability of installing sensors and replacing the oil during regular turbine maintenance schedules.
The FTA revealed that contamination and inadequate maintenance are significant failure factors. Recommendations include stringent filtration, regular inspections, monitoring accumulator pre-charge pressure, using appropriate hydraulic oil, and protecting hoses from damage. The study concludes that FTA provides a detailed understanding of hydraulic pitch system failures in wind turbines. Addressing these root causes can significantly improve reliability and longevity, enhancing overall performance and safety. Proactive maintenance and monitoring are emphasized as critical strategies in managing hydraulic systems effectively.
Abbreviations
The following abbreviations are used in this manuscript:
| ABC | Adaboost classifier |
| ADLSSVM | Adaptive Dynamic Least Squares SVM |
| ALT | Acceleration Lifetime Testing |
| ANFIS | Adaptive Network-Based Fuzzy Inference System |
| ANN | Artificial Neural Network |
| BiLSTM | Bidirectional Long Short-Term Memory |
| BP | Backpropagation |
| CAE | Convolutional Auto-Encoder |
| CNN | Convolutional Neural Networks |
| DRSN | Deep Residual Shrinkage Network |
| DT | Decision Tree |
| ECA | Efficient Channel Attention |
| EKF | Extended Kalman Filter |
| EMD | Empirical Mode decompositions |
| EWC | Elastic Weight Consolidation |
| EWT | Empirical Wavelet Transform |
| FPS | Frames per seconds |
| FTA | Fault Tree Analysis |
| GBC | Gradient Boosting Classifier |
| GPC | Gaussian Process Classifier |
| K-NN | K-Nearest Neighbour |
| LDA | Linear Discriminant Analysis |
| LR | Logistic Regression |
| LSSVM | Least squares SVM |
| MLP | Multi-layer Perceptron |
| NBC | Naïve Bayes Classifier |
| QDA | Quadratic Discriminant Analysis |
| RBFNN | Radial Basis Function Neural Network |
| RF | Random Forest |
| RUL | Remaining Useful Life |
| SAEKF | State Augmented Extended Kalman Filter |
| SEWT | Sparsity Empirical Wavelet Transform |
| SVM | support vector Machine |
| SVM-Lin | Linear SVM |
| SVM–RBF | Radial-Basis Function SVM |
| VMD | Variational Mode Decomposition |
| WT | Wavelet Transformations |
| YOLO | You Only Look Once |
Funding
This research was funded by the Danish Energiteknologisk Udviklings- og DemonstrationsProgram (EUDP) grant number 64022-1058. The authors gratefully acknowledge the funding, which made this work possible.
References
[1] Wrat et al. [2025] Gyan Wrat, Mohit Bhola, Diego M. Chamorro, Jesper Liniger, and Henrik C. Pedersen. Review of fault detection and diagnosis methods including failure root causes of major components of hydraulic pitch system for wind turbines-part-i. International Journal of Fluid Power, 2025. ISSN 2332-1180.
[2] Yang et al. [2022] Yanfang Yang, Lei Ding, Jinhua Xiao, Guinan Fang, and Jia Li. Current status and applications for hydraulic pump fault diagnosis: A review. Sensors, 22(24):9714, 2022.
[3] Hydraulic Pumps: Types, Principles and Applications — iqsdirectory.com. https://www.iqsdirectory.com/articles/hydraulic-pump.html.
[4] Shen et al. [2018] Haidong Shen, Zhiqiang Li, Lele Qi, and Liang Qiao. A method for gear fatigue life prediction considering the internal flow field of the gear pump. Mechanical Systems and Signal Processing, 99:921–929, 2018.
[5] Fabiś-Domagała [2017] Joanna Fabiś-Domagała. Analysis of defects and failures of hydraulic gear pumps with the use of selected qualitative methods. Tribologia, 272(2):33–38, 2017.
[6] Li and Limmer [2000] C James Li and JD Limmer. Model-based condition index for tracking gear wear and fatigue damage. Wear, 241(1):26–32, 2000.
[7] Wellman and Torres [2023] Chris Wellman and Ivan Torres. Lubrication and its role in gear failure analysis. Gear Solutions Magazine, November 2023. URL https://gearsolutions.com/features/lubrication-and-its-role-in-gear-failure-analysis/
[8] Lee et al. [2021] Geon-Hui Lee, Ugochukwu Ejike Akpudo, and Jang-Wook Hur. Fmeca and mfcc-based early wear detection in gear pumps in cost-aware monitoring systems. Electronics, 10(23):2939, 2021.
[9] Hemati and Shooshtari [2020] Ali Hemati and Alireza Shooshtari. Gear pump root cause failure analysis using vibrations analysis and signal processing. Journal of Failure Analysis and Prevention, 20:1815–1818, 2020.
[10] Vuorinen [2021] Elina Vuorinen. Failure analysis of hydraulic pumps. B.S. thesis, Tampere University, Finland, 2021.
[11] Liu et al. [2015] Zengkai Liu, Yonghong Liu, Hongkai Shan, Baoping Cai, and Qing Huang. A fault diagnosis methodology for gear pump based on eemd and bayesian network. PLOS ONE, 10(5):1–15, 05 2015. URL https://doi.org/10.1371/journal.pone.0125703.
[12] Liao et al. [2022] Jian Liao, Jianbo Zheng, and Zongbin Chen. Research on the fault diagnosis method of an internal gear pump based on a convolutional auto-encoder and pso-lssvm. Sensors, 22(24):9841, 2022.
[13] Lakshmanan et al. [2023] Kayal Lakshmanan, Fabrizio Tessicini, Antonio J Gil, and Ferdinando Auricchio. A fault prognosis strategy for an external gear pump using machine learning algorithms and synthetic data generation methods. Applied Mathematical Modelling, 123:348–372, 2023.
[14] Zheng et al. [2023] Jianbo Zheng, Jian Liao, and Yaqin Zhu. Two-stage multi-channel fault detection and remaining useful life prediction model of internal gear pumps based on robust-resnet. Sensors, 23(5):2395, 2023.
[15] Randal [2011] RB Randal. Vibration-based condition monitoring industrial, aerospace and automotive applications. John Wiley & Sons, 2(11), 2011.
[16] Lee et al. [2022] Myeong-Seok Lee, Tanvir Alam Shifat, and Jang-Wook Hur. Kalman filter assisted deep feature learning for rul prediction of hydraulic gear pump. IEEE Sensors Journal, 22(11):11088–11097, 2022.
[17] Yu et al. [2019] He Yu, Hongru Li, Yaolong Li, and Yifan Li. A novel improved full vector spectrum algorithm and its application in multi-sensor data fusion for hydraulic pumps. Measurement, 133:145–161, 2019.
[18] Lu and Huang [2020] Yan Lu and Zhiping Huang. A new hybrid model of sparsity empirical wavelet transform and adaptive dynamic least squares support vector machine for fault diagnosis of gear pump. Advances in mechanical engineering, 12(5):1687814020922047, 2020.
[19] Guo et al. [2020] Rui Guo, Yongtao Li, Lijiang Zhao, Jingyi Zhao, and Dianrong Gao. Remaining useful life prediction based on the bayesian regularized radial basis function neural network for an external gear pump. IEEE Access, 8:107498–107509, 2020.
[20] Engineering et al. [1979] Boeing Engineering, Construction Company, Lewis Research Center, and United States. Department of Energy. Distributed Solar Technology Division. MOD-2 wind turbine systems concept and preliminary design report, volume 2. Department of Energy, Distributed Solar Technology Division, 1979.
[21] Yasar and Sevil [2012] Pancar Yasar and Ergur H. Sevil. Troubleshooting for relief valves used in hydraulic systems. Scientific Proceedings IX International Congress ”Machines, Technologies, Materials”, 2012. ISSN 1310-3946.
[22] What Is a Pressure Relief Valve — finotek.com. https://www.finotek.com/what-is-a-pressure-relief-valve/.
[23] Yin et al. [2024] Hao Yin, He Xu, Weiwang Fan, and Feng Sun. Fault diagnosis of pressure relief valve based on improved deep residual shrinking network. Measurement, 224:113752, 2024.
[24] Irizar and Andreasen [2017] Victor Irizar and Casper Schousboe Andreasen. Hydraulic pitch control system for wind turbines: Advanced modeling and verification of an hydraulic accumulator. Simulation Modelling Practice and Theory, 79:1–22, 2017.
[25] Pelin et al. [2018] R I Pelin, P D Bârsănescu, and I Tiţa. Hydraulic systems used for pitch control of wind turbines: a literature overview. In IOP Conference Series: Materials Science and Engineering, volume 444, page 042013. IOP Publishing, 2018.
[26] Ulery and Sage [2020] Tom Ulery and Jeff Sage. Improve wind turbine safety with a piston accumulator retrofit, 2020. URL https://www.powermag.com/improve-wind-turbine-safety-with-a-piston-accumulator-retrofit/. Accessed: May 13, 2024.
[27] Casey [n.d.] Brendan Casey. Advice for maintaining hydraulic accumulators. https://www.machinerylubrication.com/Read/2305/hydraulic-accumulators, n.d. Accessed: 2025-09-11.
[28] Liniger et al. [2017a] Jesper Liniger, Nariman Sepehri, Mohsen Soltani, and Henrik C Pedersen. Signal-based gas leakage detection for fluid power accumulators in wind turbines. Energies, 10(3):331, 2017a.
[29] Liniger et al. [2017b] Jesper Liniger, Henrik C Pedersen, and Mohsen Soltani. Model-based estimation of gas leakage for fluid power accumulators in wind turbines. In Fluid Power Systems Technology, volume 58332, page V001T01A024. American Society of Mechanical Engineers, 2017b.
[30] Asmussen et al. [2022] Magnus F Asmussen, Jesper Liniger, Nariman Sepehri, and Henrik C Pedersen. Pre-charge pressure estimation of a hydraulic accumulator using surface temperature measurements. Wind, 2(4):784–800, 2022.
[31] Elorza et al. [2021] Iker Elorza, Iker Arrizabalaga, Aritz Zubizarreta, Héctor Martín-Aguilar, Aron Pujana-Arrese, and Carlos Calleja. A sensor data processing algorithm for wind turbine hydraulic pitch system diagnosis. Energies, 15(1):33, 2021.
[32] Pichler et al. [2020] Kurt Pichler, Rainer Haas, Christian Kastl, Andreas Plöckinger, and Paul Foschum. Comparison of fault detection methods for a hydraulic accumulator loading circuit. In 2020 IEEE Conference on Industrial Cyberphysical Systems (ICPS), volume 1, pages 117–122. IEEE, 2020.
[33] Helwig et al. [2015] Nikolai Helwig, Eliseo Pignanelli, and Andreas Schütze. Condition monitoring of a complex hydraulic system using multivariate statistics. In 2015 IEEE International Instrumentation and Measurement Technology Conference (I2MTC) Proceedings, pages 210–215. IEEE, 2015.
[34] Park et al. [2022] Min-Ho Park, Sabyasachi Chakraborty, Quang Dao Vuong, Dong-Hyeon Noh, Ji-Woong Lee, Jae-Ung Lee, Jae-Hyuk Choi, and Won-Ju Lee. Anomaly detection based on time series data of hydraulic accumulator. Sensors, 22(23):9428, 2022.
[35] Lu et al. [2021] Changbo Lu, Hua Li, Bin Zhang, Mengyi Wang, and Chunhua Xiong. Research status of hydraulic oil evaluation technology. In Journal of Physics: Conference Series, volume 1983, page 012035. IOP Publishing, 2021.
[36] Zhou et al. [2020] Xinda Zhou, Zhaojun Yang, Hailong Tian, Chuanhai Chen, Liding Wang, Yongfu Zhu, and Jia Liu. Reliability optimization design of hydraulic system considering oil contamination. Journal of Mechanical Science and Technology, 34:5041–5051, 2020.
[37] Chen et al. [2019] Chuanhai Chen, Junqi Long, Hailong Tian, Zhaojun Yang, Shizheng Li, Xinda Zhou, and DaChuan Wang. Reliability modeling for hydraulic components of heavy duty machine tools based on degradation path for oil contamination. In 2019 4th International Conference on System Reliability and Safety (ICSRS), pages 584–589. IEEE, 2019.
[38] Marinescu et al. [2021] Alexandru Daniel Marinescu, Alexandru Valentin Radulescu, and Irina Radulescu. Researches concerning the hydraulic oil degradation process in gear pumps. Journal of Research & Innovation for Sustainable Society (JRISS), (2), 2021.
[39] Shi et al. [2021] Haotian Shi, Dian Huo, Hongpeng Zhang, Wei Li, Yuqing Sun, Guobin Li, and Haiquan Chen. An impedance sensor for distinguishing multi-contaminants in hydraulic oil of offshore machinery. Micromachines, 12(11):1407, 2021.
[40] Zeng et al. [2018] Lin Zeng, Hongpeng Zhang, Qiang Wang, and Xingming Zhang. Monitoring of non-ferrous wear debris in hydraulic oil by detecting the equivalent resistance of inductive sensors. Micromachines, 9(3):117, 2018.
[41] MAC Hydraulics [2023] MAC Hydraulics. Common causes of hydraulic hose failure. https://mac-hyd.com/blog/common-causes-of-hydraulic-hose-failure/, 2023.
[42] Corporation [Accessed November 21, 2023] Parker Hannifin Corporation. Top 8 reasons hydraulic hoses fail. https://blog.parker.com/site/usa/details-home-page/top-8-reasons-hydraulic-hoses-fail-us, Accessed November 21, 2023.
[43] A guide to recognizing the causes of hose failure. https://www.powermotiontech.com/hydraulics/hose-tubing/article/21884482/parker-hannifin-corp-hose-products-div-a-guide-to-recognizing-the-causes-of-hose-failure. Accessed: November 21, 2023.
[44] new [2023] 13 causes of hose failure. https://www.new-line.com/information/causes-of-hose-failure, 2023. Accessed on November 21, 2023.
[45] Hyvärinen et al. [2020] Jari Hyvärinen, Matts Karlsson, and Lin Zhou. Study of concept for hydraulic hose dynamics investigations to enable understanding of the hose fluid–structure interaction behavior. Advances in Mechanical Engineering, 12(4):1687814020916110, 2020.
[46] Li et al. [2023] Yue Li, Yan Bai, Xiaolin Li, Peishuo Liu, and Changwei Shi. Failure analysis of high pressure hose in hydraulic loading system. In Journal of Physics: Conference Series, volume 2468, page 012109. IOP Publishing, 2023.
[47] Ying et al. [2022] Zhiping Ying, Zhongtao Lin, Zhenyu Wu, Kuan Liang, and XuDong Hu. A modified-yolov5s model for detection of wire braided hose defects. Measurement, 190:110683, 2022.
[48] Klarecki and Rabsztyn [2023] Klaudiusz Klarecki and Dominik Rabsztyn. Hydraulic measuring hoses as pressure signal distortion—mathematical model and results of experimental tests. Sensors, 23(16):7056, 2023.
[49] Ngu [2021] Alexander Ngu. Dimensional complexity and algorithmic efficiency. arXiv preprint arXiv:2201.05050, 2021.
Biographies

Mohit Bhola is currently working as a Post Doctoral Researcher at the Mechatronics Section, Energy Department at Aalborg University located in Aalborg, Denmark. He holds a PhD degree in Mechatronics from the Indian Institute of Technology (Indian School of Mines), Dhanbad, India. His current research interests are Fault Tolerant Control of Hydraulic Pitch Systems for Wind Turbines, Digital Hydraulics, Hybrid Hydrostatic Transmission Systems, System Modeling, Control, Hardware in Loop (HIL) Simulations, and Automation.

Gyan Wrat is a Post Doctoral Researcher at Aalborg University in the Energy Department, currently researching wind turbine technology. He holds a PhD and a Master’s degree in Mechatronics from the Indian Institute of Technology, India. His research interests lie in the field of Fluid Power Fault and Control.

Henrik C. Pedersen is an Associate Professor and Head of Section for Mechatronic Systems at the Department of Energy at Aalborg University, Denmark. His field of work is in the analysis, design, optimization, and control of mechatronic systems in general and fluid power systems and components in particular. Special focus is on efficiency, reliability, condition monitoring, fault detection and diagnostics, and control of fluid power systems and components. Author of 170 publications within these areas and project leader (P.I.) for several research projects within this and related areas.

Jesper Liniger is an Associate Professor at Department of Energy, Aalborg University, Denmark. His research interest includes fault analysis and fault detection in fluid power and perception and navigation in subsea robotics.

Diego M. Chamorro is working as a Research Assistant at the Mechatronics Systems section at AAU Energy, investigating accelerated testing methodologies in fluid power systems. He holds a Master’s degree in Mechanical Engineering focusing on tribology from the TRIBOS Consortium. His research interests are Mechatronics systems, Tribology, and Fluid power systems.
International Journal of Fluid Power, Vol. 26_4, 625–672
doi: 10.13052/ijfp1439-9776.2644
© 2025 River Publishers