Low-Cost and low-Redundancy Fault Diagnosis in Complex Pneumatic Systems: Case Study of a Pick-and-Place System
Lingchao Yu1, Zhiwen Wang1,*, Chunpu Zhang1, Zheng Zhao2, Duo Li1, Rupp Carriveau3, David S.-K. Ting3 and Wei Xiong1
1Department of Mechanical Engineering, Dalian Maritime University, Dalian 116026, Liaoning, China
2College of Artificial Intelligence, Dalian Maritime University, Dalian 116026, Liaoning, China
3Turbulence and Energy Laboratory, Ed Lumley Centre for Engineering Innovation, University of Windsor, Windsor N9B 3P4, Ontario, Canada
E-mail: wzw@dlmu.edu.cn
*Corresponding Author
Received 14 March 2025; Accepted 26 November 2025
Abstract
Low-cost fault diagnosis of pneumatic systems has been highly demanded by the industrial community in recent years. In this study, the feasibility of low-cost and low-redundancy fault diagnosis in complex pneumatic systems is investigated by using a minimal number of mature flow and pressure sensors. A pick-and-place demonstration system with 17 pneumatic actuators is taken as the experimental platform. Only one pressure sensor and one flow sensor are utilized to diagnose 132 leakage faults with the help of a one-dimensional convolutional neural network (1D CNN). The average accuracies of leakage fault diagnosis with pressure, flow rate, and exergy data are 89.5%, 96.8%, and 98.9%, respectively. The results are interpreted with Class Activation Mapping (CAM) and Occlusion Sensitivity Analysis (OSA). Overall, it reveals that it is feasible to diagnose multiple faults in complex pneumatic systems with a minimal number of commonly used sensors.
Keywords: Pneumatic systems, fault diagnosis, low redundancy, machine learning.
1 Introduction
Pneumatic systems are widely used in industrial sectors due to the metrics of low hardware cost, high reliability, simple structure, easy maintenance, and cleanliness. Digitalization, networking and intelligence are the development trends of pneumatic transmission and control technology. Health management, including fault diagnosis, is an important part of intelligence. At present, the fault diagnosis of complex industrial pneumatic systems is facing the problems of low intelligence, high cost, and poor generality. Except for several component-level products, there are still no effective and low-cost commercial fault diagnosis products from the perspective of system level. In terms of fault diagnosis of complex industrial pneumatic systems, it is generally accepted that more sensors are inevitable [1–3]. That means much higher investment costs are necessary, which is unacceptable from the standpoints of users. The significant reason why pneumatic transmission can be widely used is that it possesses the advantage of low investment cost. Therefore, the engineering practical industrial pneumatic fault diagnosis technology should have the characteristics of low cost, especially under the trend of low-cost electrification. One possible solution for low-cost fault diagnosis of complex industrial pneumatic systems is to diagnose with a minimal number of commonly used sensors. The redundancy and the cost are the lowest when only one sensor is used in a whole complex pneumatic system. Thus, the aim of this study is to investigate the feasibility of low-cost and low-redundancy fault diagnosis in complex pneumatic systems.
In general, fault diagnosis in pneumatic systems can be classified into four categories: experience-based, model-based, signal-based, and AI-based approaches [1, 4]. Experience-based fault diagnosis methods are the earliest developed and are currently the most widely used in manufacturing workshops. It possesses the advantages of simple and economical to implement. However, it is highly dependent on the experience which is generally scarce for workers. Besides, pneumatic systems are generally custom-designed. That means a same pneumatic component could perform differently in various systems. Thus, the accuracy, timeliness and effectiveness of experience-based methods are quite limited. It is definitely not a solution for intelligent fault diagnosis of pneumatic systems. Model-based fault diagnosis methods identify faults by establishing mathematical models and comparing differences between model outputs and real-world signals. However, constructing precise mathematical models for complex pneumatic systems is highly challenging, especially due to the nonlinearity caused by compressed air. Therefore, there are almost no established model-based fault diagnosis cases in terms of complex pneumatic systems except several cases on pneumatic components and small test benches [5, 6]. Signal-based fault diagnosis methods have been extensively developed and deployed prior to the advent of AI-based methods. These methods analyse physical signals (e.g., vibration, pressure, current, temperature, velocity, displacement, time duration) collected during equipment operation to support condition monitoring and fault identification. The core of this approach focuses on artificial feature engineering: applying domain knowledge to define and extract key signal features characterizing equipment health status (e.g., time-domain statistics, frequency-domain features, time-frequency features). A key advantage is that successfully extracted features typically have clear physical interpretability, enabling diagnostic results to be directly traced to specific physical fault mechanisms and thereby enhancing the credibility of results. However, signal-based methods have critical limitations: (1) heavy reliance on artificial feature engineering results in poor generalization ability; (2) inherent challenges in accurately diagnosing multiple faults in complex systems; (3) heavy reliance on manually designed decision logic during fault diagnosis. These factors restrict their further development and deployment. For example, similar schemes are proposed by Gauchel et al. [7] and Boyko and Weber [8]; both studies rely on limit switch signals and achieve fault diagnosis by analysing deviations between the actuator’s movement time and a predefined threshold. No additional sensors are necessary in their studies, thereby reducing fault diagnosis costs. However, these schemes still require manual setting of decision logic and face challenges in achieving accurate diagnoses in complex systems. In recent years, AI-based fault diagnosis methods have emerged as cutting-edge approaches. Many machine learning methods have been applied to fault diagnosis of pneumatic systems. With machine learning, feature extraction can be performed automatically, eliminating the need for manual feature engineering and thereby improving generalization ability across various application contexts. Demetgul et al. evaluated the fault diagnosis performance of a combination of eight sensors and ANNs (Artificial Neural Networks) on a didactic modular production system [2]. The 25 features of signals were calculated for identifying 11 faults. Ertel et al. successfully identified the faulty state of a simple pneumatic test system using one-class-learning algorithm nearest neighbour-data-description [9]. Kovacs and Ko identified the fault states of pneumatic cylinders based on real data from a factory using various unsupervised machine learning methods [10]. Ding et al. proposed a low-cost micro-leakage measurement system based on deep learning [11]. Tiboni and Remino proposed a state monitoring method for pneumatic drive systems based on a feedforward backpropagation neural network [12]. Experimental results showed that even with low-cost sensors, this method could effectively monitor pneumatic system states with high accuracy. Shi et al. proposed a leakage localization scheme for pneumatic systems based on thermal imaging technology and an advanced image recognition deep learning framework [13]. The study showed that this method can efficiently and accurately detect leakage locations. Experimental results indicated an average detection accuracy close to 99.5%.
Although the pneumatic systems are widely used in industrial sectors, its defects of low energy efficiency, high energy cost, and high carbon emission are more and more prominent in the background of net-zero emission and green manufacturing, especially when compared with booming electric drive. Currently, energy consumption issue has become a significant constraint on the further development and adoption of pneumatic technology. Gas leakage is one of the primary causes of reduced energy efficiency in pneumatic systems and is also one of the most common faults in these systems. Generally, the leakages account for approximately 10% to 40% of energy loss in industrial pneumatic systems. Additionally, leakage can also exacerbate equipment wear, shorten its lifespan, and increase maintenance frequency and costs. Leakage detection is always a significant concern in pneumatic systems [14, 15]. Thus, in this study, taking the common leakage faults in pneumatic systems as an example, the feasibility of low-redundancy fault diagnosis in complex pneumatic systems with the help of machine learning is investigated. That is, the effective diagnosis of as many as possible leakage faults in a pneumatic system can be achieved with a minimal number of commonly used low-cost sensors.
The structure of this paper is organized as follows. Section 1 provides the research background and aims of this study. Section 2 presents the experimental setup of a complex pneumatic system. Section 3 details the data collection and pre-processing, the 1D CNN deep learning model, and leakage fault diagnosis process. Section 4 analyses and discusses the fault diagnosis results using confusion matrices, Class Activation Mapping (CAM), and Occlusion Sensitivity Analysis (OSA). Finally, conclusions are drawn in Section 5.
2 Experiment Setup
A pick-and-place demonstration system (model 6185-07CN) produced by SMC Corporation is used as the experimental setup, as shown in Figure 1. This demonstration system simulates a typical industrial application scenario by integrating pneumatic, electric, and vacuum handling technologies. It demonstrates various functions via synergies of 7 workstations, mainly including handling, precise positioning, gripping, transfer, vacuum suction, flipping, measurement, and counting of workpieces. Hereinto, there are 5 pneumatic workstations equipped with 17 actuators in total. Figure 2 shows the detailed configurations of 5 pneumatic workstations. Table 1 presents the specific models and functions of 17 pneumatic actuators in the SMC pick-and-place system.
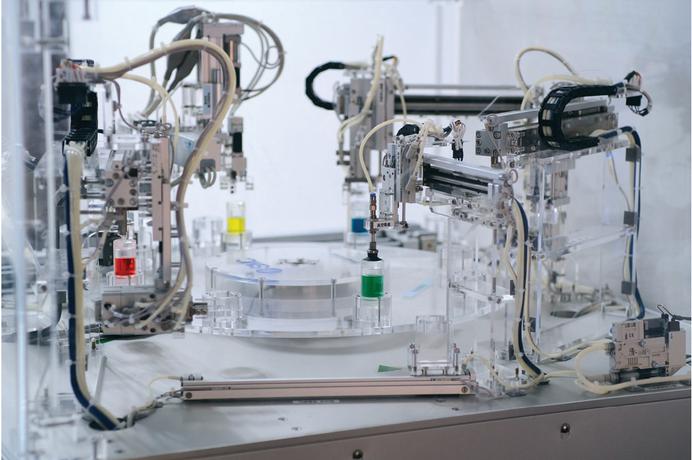
Figure 1 SMC pick-and-place demonstration system.
As shown in Figure 2, the experimental system consists of pneumatic components, sensors, data acquisition devices, and a computer. The compressed air is provided by an air compressor and stored in a storage tank with near-constant pressure characteristics. A pressure-reducing valve is installed downstream of the storage tank to regulate the operating pressure required for the experiment. In this experiment, the set value of the pressure-reducing valve is set to 0.45 MPa. The actions of pneumatic actuators are controlled by two-position five-way solenoid valves, and the overall system operation logic is controlled by PLC. After the pressure-reducing valve, a single measuring point with one flow sensor and one pressure sensor is set in the manifold. The flow sensor is SFAB-600U-HQ10-2SV-M12 (FESTO Corporation) with a range of 6–600 L/min, and the pressure sensor is ISE40A-C6-R-M (SMC Corporation) with a range of 0.1–1.0 MPa. Data acquisition is performed with the Advantech PCI-1710U data acquisition card and a LabVIEW program in the computer. The flow rate and pressure data is collected in real time with a data acquisition frequency of 100 Hz.
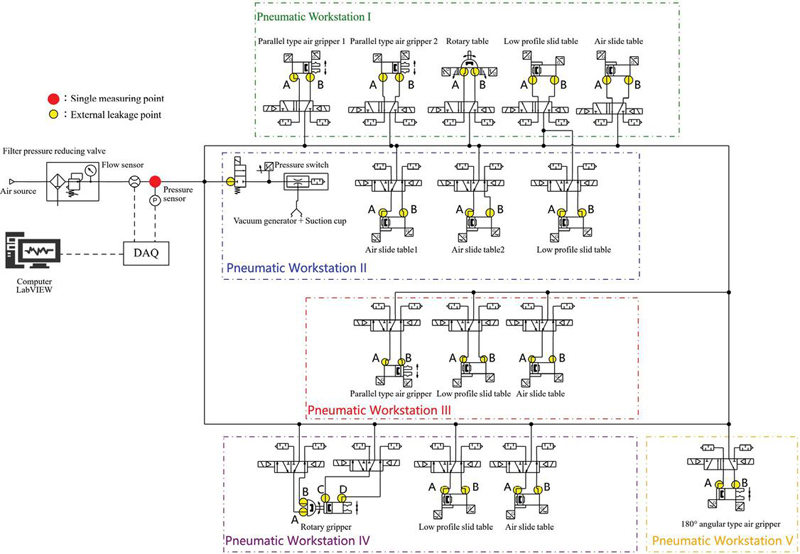
Figure 2 Schematic diagram of the experimental system.
In this study, as shown in Figure 2, the external leakages at 33 positions are simulated. At each position, four levels of leakage are simulated, including 0.5 L/min, 1 L/min, 5 L/min, and 10 L/min. That is, a total number of 132 (334) leakage faults in total are simulated. It should be noted that only one leakage fault is simulated in each experiment. The different levels of external leakages are simulated via regulating a flow control valve. Figure 3(a) shows a case of how the external leakages are simulated and calibrated. Leakage flow rate is simulated by adjusting the opening of the flow control valve (model AS3000) and measured using a flow sensor (PFM710S-01-E-M; range: 0.2–10 L/min). Figure 3(b) shows a flow rate data of 0.5 L/min leakage. The black curve in the figure represents the real-time leakage flow data collected by the flow sensor, while the green solid line indicates the average value. The fluctuations are mainly caused by the inherent measurement error of flow sensor and do not affect the overall evaluation of the calibration.
Table 1 Pneumatic actuators of the SMC pick-and-place system
| Workstations | Pneumatic Components | Quantity | Function | Model |
| I | Parallel type air gripper | 2 | Component gripping | MHZL2-16D |
| Low profile slid table | 1 | Lifting and lowering | MXF12-50 | |
| Air slide table | 1 | Horizontal transport | MXY12-200-A90 | |
| Rotary table | 1 | Component flipping | MSQB3AE | |
| II | Suction cup | 1 | Component adsorption | ZPT25UNJ10-B5-10 |
| Low profile slid table | 1 | Lifting and lowering | MXF12-50 | |
| Air slide table 1 | 1 | Horizontal transport | MXY12-200-A90 | |
| Vacuum generator | 1 | Provide positive and negative pressure | ZK2A07K5KW-06 | |
| Air slide table 2 | 1 | Horizontal transport | MXY8-250 | |
| III | Parallel type air gripper | 1 | Component gripping | MHZL2-16D |
| Low profile slide table | 1 | Lifting and lowering | MXF12-50 | |
| Air slide table | 1 | Horizontal transport | MXY12-200-A90 | |
| IV | Rotary gripper | 1 | Component clamping and flipping | MRHQ16D-180S-N |
| Low profile slid table | 1 | Lifting and lowering | MXF12-50 | |
| Air slide table | 1 | Horizontal transport | MXY12-200-A90 | |
| V | 180∘ angular type air gripper | 1 | Clamping and positioning | MHW2-32D1 |
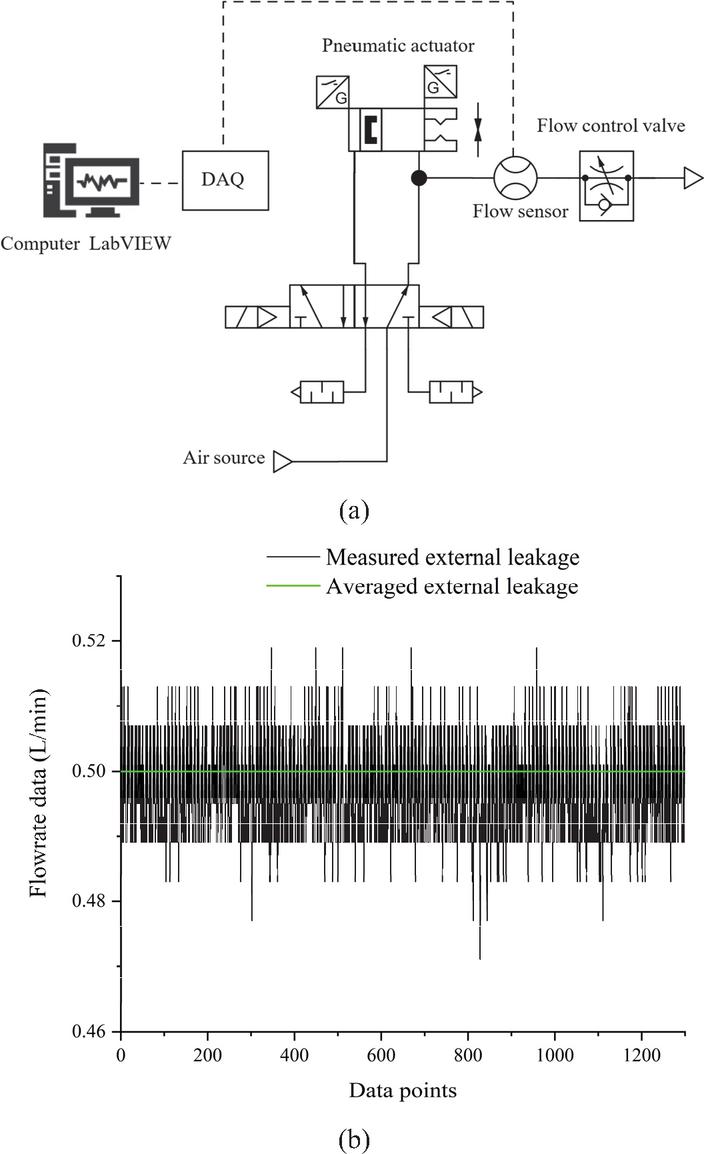
Figure 3 Simulation and calibration of external leakage.
3 Methodology
Figure 4 shows the whole process of fault diagnosis designed in this study. It can be divided into two sections, data acquisition and pre-processing, and fault diagnosis model. In this study, the one-dimensional convolutional neural network (1D CNN) method is used for establishing the fault diagnosis model.
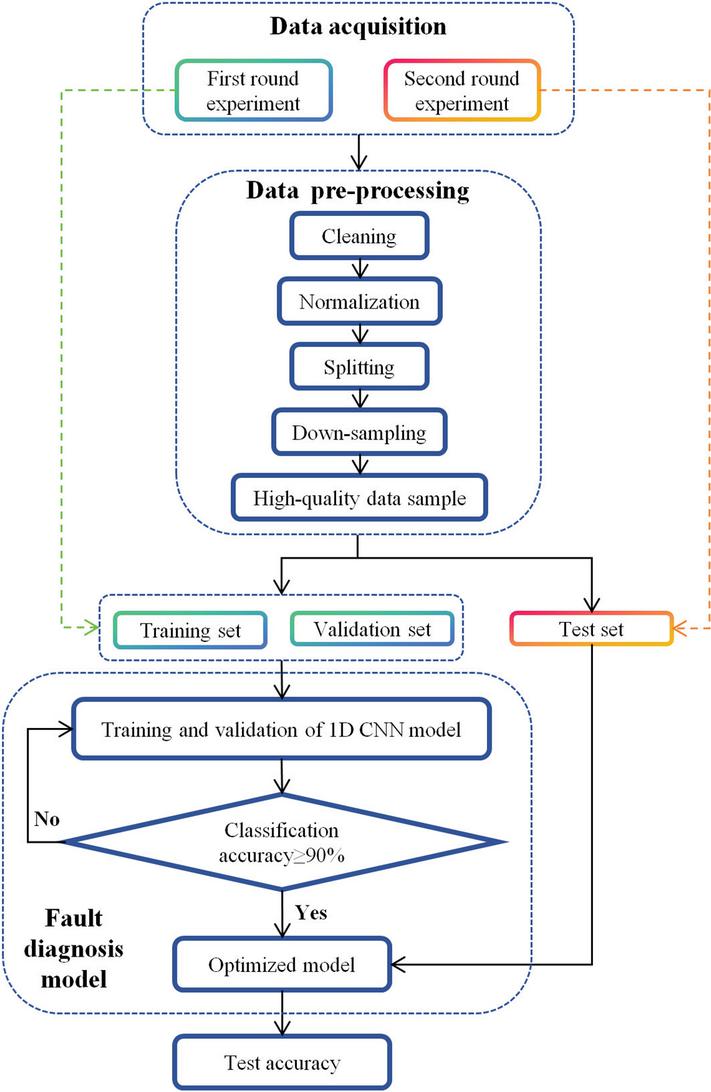
Figure 4 The whole process of leakage fault diagnosis designed in this study.
3.1 Data Acquisition and Pre-processing
As illustrated in Figure 2 and Figure 4, the flow rate data and pressure data are directly acquired from flow sensor and pressure sensor in the single measuring point. In pneumatic systems, extremely obvious nonlinearity is general due to the strong compressibility, and interactions between flow rate, pressure, and temperature of compressed gases. That is also a dominating reason why it is difficult to achieve effective fault diagnosis of complex pneumatic systems. From the perspective of first principle, it is the energy which is controlled in pneumatic systems. Therefore, it is possible to understand and monitoring the conditions of pneumatic systems by acquiring energy data of compressed air. In terms of fault diagnosis of pneumatic systems, the advantages of energy data over flow and pressure data have been preliminarily proven by our previous studies [4, 16]. In this study, the exergy, based on the second law of thermodynamics, is used to quantify the available energy of compressed air. This has been widely accepted for evaluating the energy performance of pneumatic systems in recent years [17]. In most industrial pneumatic systems, the temperature fluctuations in both environment and system are negligible. Therefore, the exergy can be calculated with
where is the exergy flowrate of compressed air with unit kJ/s, is the mass flowrate of compressed air with unit kg/s, is the gas constant with unit J/kg/K, and is the absolute pressure of compressed air with unit Pa. and are the reference temperature and reference pressure, respectively. In this study, the pressure and temperature of atmospheric are used for the reference state and set as 101325 Pa and 25∘C, respectively. Thus, the exergy data can be directly calculated in LabVIEW program using the collected flow data and pressure data.
In this study, as shown in Figure 4, the first round experiment is conducted for collecting data of training and validation sets. A total of 132 types of leakage faults and 1 normal operating condition are simulated. The training set for each leakage fault consists of 30 data samples and the validation set for each leakage fault includes 6 data samples. After that, the independent second round experiment is conducted for collecting data of test sets. The test set for each leakage fault comprises 5 data samples.
In experiments, due to sensors and other experimental factors, the raw data often contains noise, outliers, and missing values, making it unsuitable for direct use in training neural network models. In deep learning, data pre-processing is a critical step in improving data quality, directly influencing model performance and accuracy. Furthermore, proper data pre-processing can not only accelerate model training but also mitigate overfitting, improve generalization, and enhance the model’s stability and reliability. By conducting data cleaning and normalization, data pre-processing can effectively reduce noise, fill missing values, and improve data distribution, thereby enhancing the model’s ability to capture significant patterns. In this study, data cleaning is first performed using ‘isnull’ function, ‘duplicated’ function, and ‘boxplot’ method in Python to remove missing values, duplicates, and outliers. Subsequently, the data is normalized by scaling each data sample to the range of [0, 1] with Equation (2), thereby meeting the input requirements of the neural network model and avoiding negative impacts from feature scale differences on model training. After that, data splitting is applied to divide the raw data into individual samples, providing high-quality sample sets for model training. Figure 5 shows part of raw data of flow rate in an experiment. It is evident that there are regular periodic characteristics. Therefore, one cycle of system operation is regarded as a data sample as shown in Figure 5. Because data points of each raw data cycle are not exactly 1300, down-sampling is utilized for keeping the dimensions of each data sample exactly 1300. Each data sample contains 1300 data points, that is, 13 seconds. Figure 6 shows the cases of pre-processed high-quality data samples of flow rate, pressure, and exergy. These pre-processing steps significantly improved the data’s suitability and accuracy, laying a solid foundation for subsequent neural network model training.
where represents the maximum value of the sample data, represents the minimum value, and is the range.
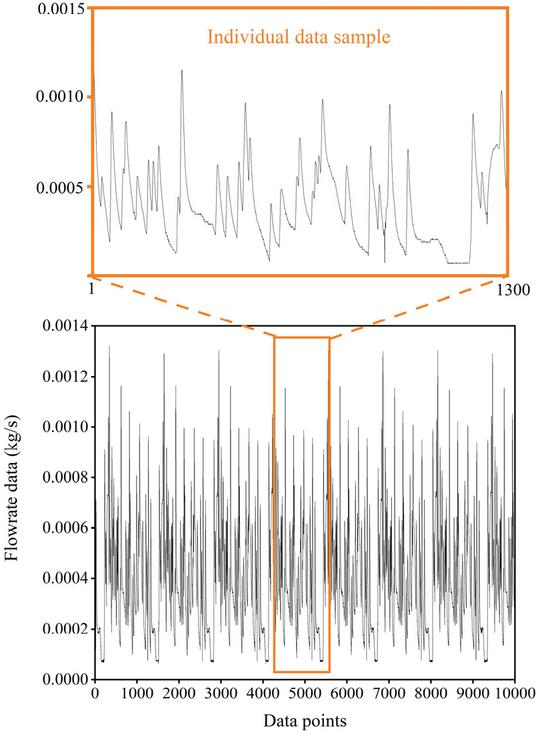
Figure 5 Raw flow data and individual flow data sample.
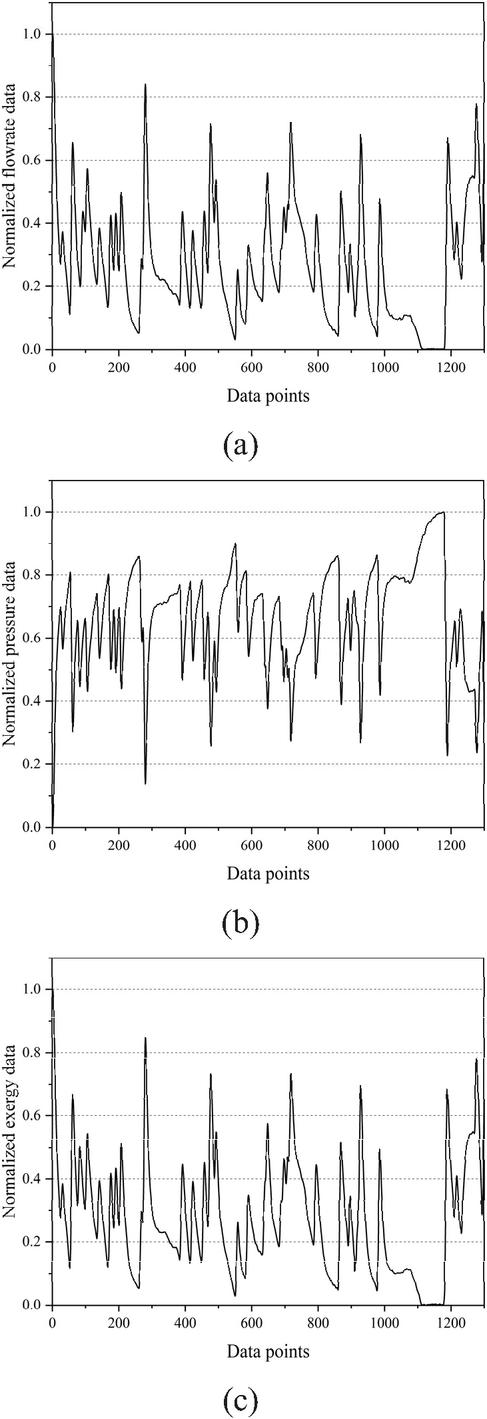
Figure 6 Pre-processed data sample, (a) Normalized flow rate data, (b) Normalized pressure data, (c) Normalized exergy data.
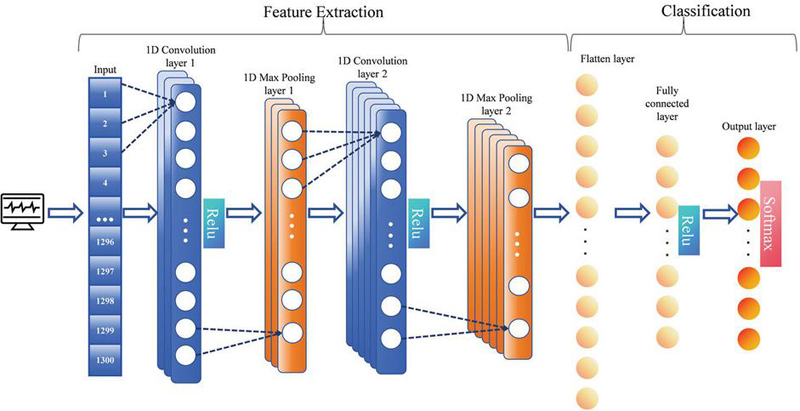
Figure 7 Structure of 1D CNN model.
3.2 1D CNN Model
Convolutional Neural Networks (CNNs) are widely used in fields such as image recognition and speech recognition [18]. A typical CNN structure consists of multiple layers, including the input layer, convolutional layers, pooling layers, fully connected layers, and the output layer. In this study, a 1D Convolutional Neural Network (CNN) model is developed for feature extraction and classification of external leakage fault signals in pneumatic systems. The structure of the designed 1D CNN model is shown in Figure 7. The first convolutional layer consists of 32 filters, each with a kernel size of 3, which are used to extract local features from the input data. This layer adapts ‘same’ padding, ensuring that the output length matches the input length and preserving boundary information. To enhance the model’s ability to express nonlinearity, a Rectified Linear Unit (ReLU) activation function is introduced. Next, the first pooling layer applies a 22 pooling kernel with a stride of 2 for max pooling. This operation reduces the feature dimensions, decreases computational complexity, and enhances the model’s robustness to changes of position. The second convolutional layer consists of 64 filters, each with a kernel size of 3, with the same parameter settings as the first convolutional layer. The second pooling layer is configured the same as the first pooling layer, further reducing the size of the feature map. After the convolution and pooling operations, the flattening layer transforms the multidimensional feature map into a one-dimensional vector, making it suitable for processing by the fully connected layer. The fully connected layer contains 256 neurons, which fully connect to the flattened features and apply the ReLU activation function again to capture the deep nonlinear relationships in the data. Finally, the output layer uses the Softmax activation function to convert the network’s output into a probability distribution, enabling multiclass decision-making. The design of this CNN model aims to efficiently extract features from the input data by progressively reducing the feature dimensions through successive convolution and pooling operations and preventing overfitting. The introduction of activation functions enhances the model’s ability to express nonlinearity, while the fully connected layer and Softmax output layer ensure the model’s classification performance.
To validate the rationale and effectiveness of the 1D CNN model designed in this study, Figure 8 presents the loss function curves for the flow, exergy, and pressure data. After 100 training epochs, the loss curves for both the training and validation sets stabilize and eventually converge to values close to zero. This indicates that the 1D CNN model effectively converges during the training process without overfitting.
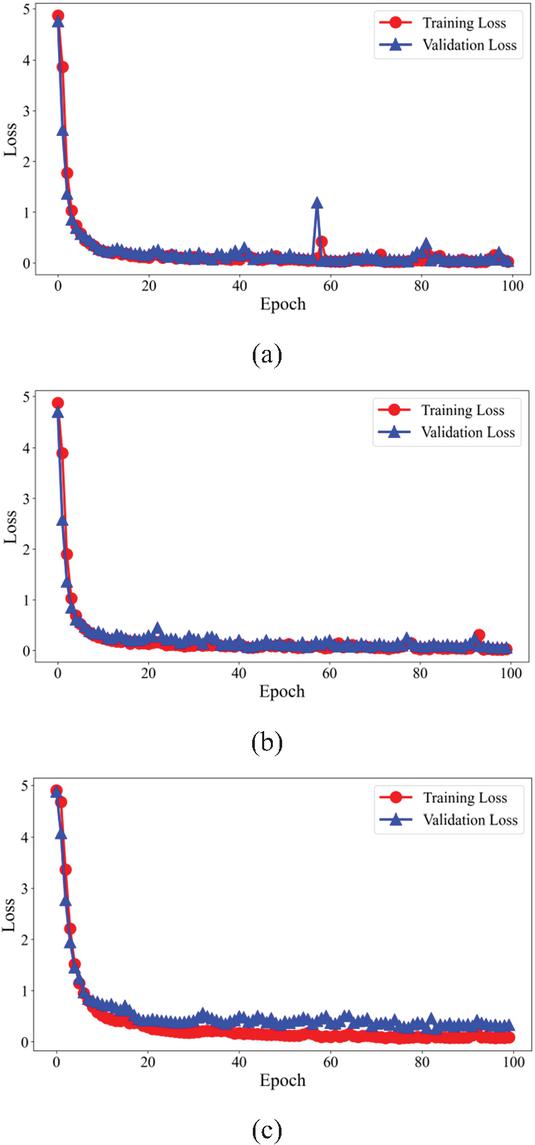
Figure 8 Loss function curves of different data, (a) Loss function curves of flowrate data, (b) Loss function curves of exergy data, (c) Loss function curves of pressure data.
4 Results and Discussions
This section presents the fault diagnosis results based on flow, pressure, and exergy data, and provides an in-depth discussion of the diagnostic outcomes using various analytical methods, including confusion matrices, Class Activation Mapping (CAM), and Occlusion Sensitivity Analysis (OSA). Table 2 presents the classification accuracies based on flow, pressure, and exergy data. Based on five independent tests, the average accuracies for flow data, pressure data, and exergy data are 96.84%, 89.47%, and 98.95%, respectively. As a fusion feature of flow and pressure data, exergy demonstrated higher classification accuracy in this study, surpassing the performance of individual flow and pressure data. This indicates that exergy can more comprehensively represent the overall operating state of the system, thereby offering greater potential and practical value in fault diagnosis.
Table 2 Classification accuracies based on flow, pressure, and exergy data
| Accuracy | |||
| Test Number | Flowrate | Pressure | Exergy |
| 1 | 97.50% | 90.00% | 99.50% |
| 2 | 96.00% | 88.50% | 98.50% |
| 3 | 97.00% | 89.80% | 99.00% |
| 4 | 96.50% | 90.00% | 98.75% |
| 5 | 97.20% | 89.05% | 99.00% |
| Average accuracy | 96.84% | 89.47% | 98.95% |
4.1 Confusion Matrix Diagram Analysis
The confusion matrix, as a key performance evaluation tool, is widely used in the performance analysis of classification models. It visually displays the classification results of the model across different categories in matrix form, providing an effective means for evaluating the model’s accuracy and reliability. In this study, the confusion matrix is used to analyze and reveal the classification ambiguities among different fault types. Figures 9(a), 9(b), and 9(c) show the confusion matrix results based on exergy, flow, and pressure data from the fifth test. It should be noted that the figure only shows the fault types where classification ambiguities occurred, making it easier to visualize the model’s performance across different categories. The correctly classified data samples are not presented. Figure 9 explains the results shown in Table 2. Classification based on exergy data yields the best results with only a few fault types showing ambiguity. Classification based on pressure data performs the worst with more fault types being confused. Classification based on flow data shows moderate ambiguity.
For example, in Figure 9(a), five samples labeled as 72 are misclassified as samples labeled as 71, and two samples labeled as 122 are misclassified as fault samples labeled as 37. Similarly, the confusion matrixes based on flow data (Figure 9(b)) and pressure data (Figure 9(c)) follow the same analysis process as in Figure 9(a). Table 3 presents the detailed meaning of all labels in Figure 9. It should be noted that most confusion occurs between 0.5 L/min and 1 L/min leakage faults at the same location with contiguous labels, such as label 71 and label 72, label 13 and label 14, label 121 and label 122, etc. This is due to the small difference in leakage rates between the two faults, resulting in similar or overlapping features that affect the model’s classification accuracy between these two types of fault.
The result further indicates that, despite some classification ambiguities, the overall classification performance is acceptable. In the next section, CAM and OSA techniques are used to further analyse the causes of the classification ambiguities.
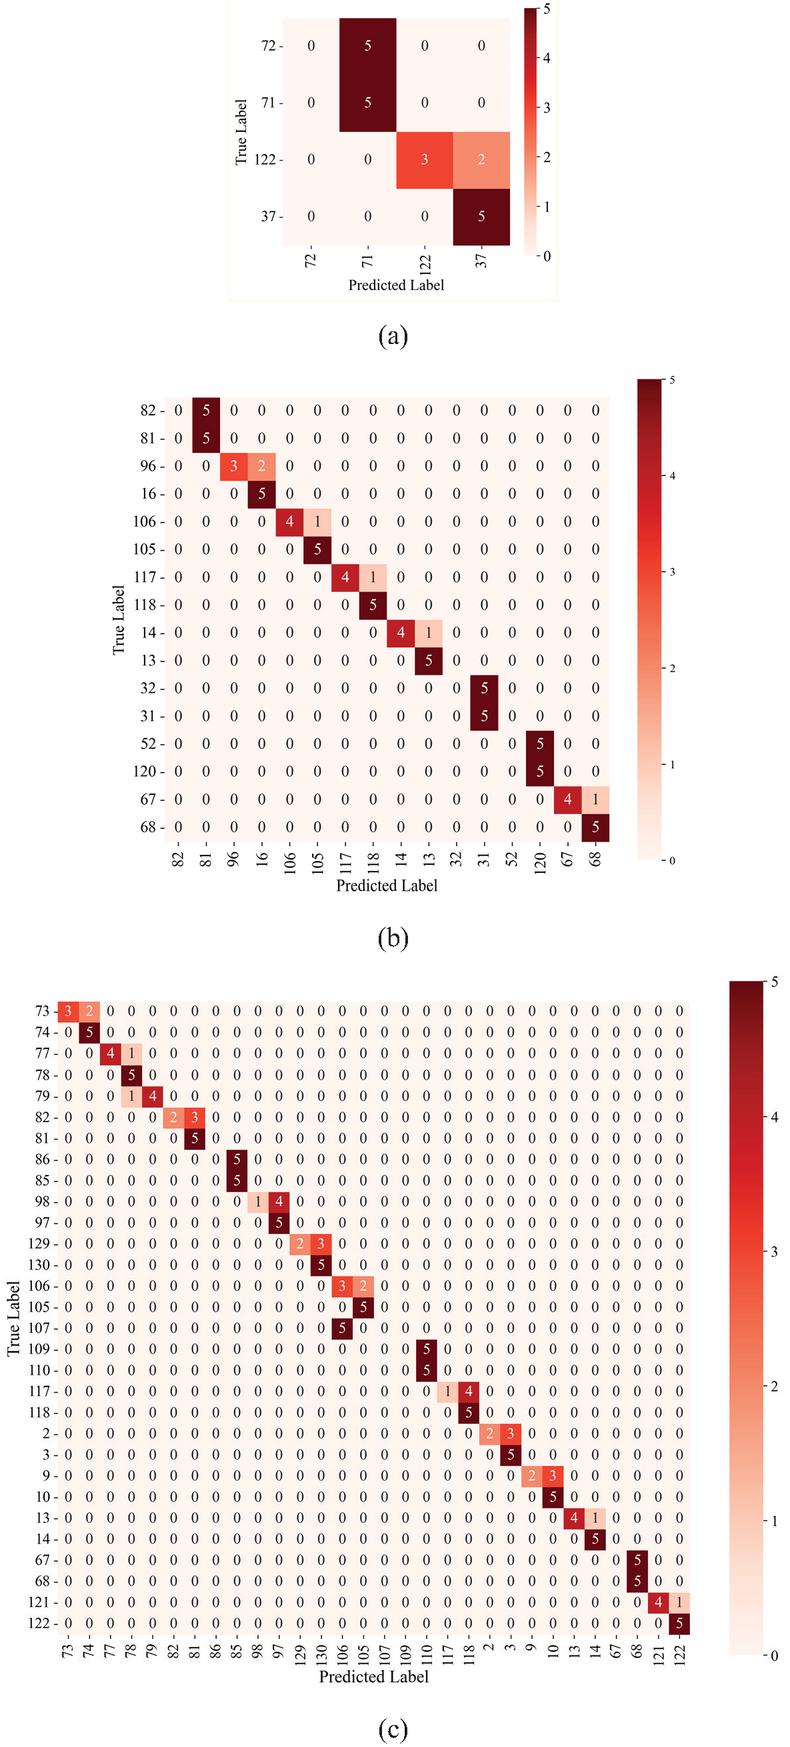
Figure 9 Confusion matrix for poorly classified labels, (a) Exergy, (b) Flowrate, (c) Pressure.
Table 3 Detailed meaning of labels in Figure 9
| Label | Leakage Location | Leakage Rate |
| 2 | Pneumatic workstation III, Low-profile slide table, Port A | 1 L/min |
| 3 | Pneumatic workstation III, Low-profile slide table, Port A | 5 L/min |
| 9 | Pneumatic workstation III, Air slide table, Port B | 0.5 L/min |
| 10 | Pneumatic workstation III, Air slide table, Port B | 1 L/min |
| 13 | Pneumatic workstation IV, Low-profile slide table, Port A | 0.5 L/min |
| 14 | Pneumatic workstation IV, Low-profile slide table, Port A | 1 L/min |
| 16 | Pneumatic workstation IV, Low-profile slide table, Port A | 10 L/min |
| 31 | Pneumatic workstation IV, Air slide table, Port A | 5 L/min |
| 32 | Pneumatic workstation IV, Air slide table, Port A | 10 L/min |
| 37 | Pneumatic workstation IV, Rotary gripper, Port B | 1 L/min |
| 52 | Pneumatic workstation IV, Rotary gripper, Port C | 10 L/min |
| 67 | Pneumatic workstation II, Vacuum generator | 5 L/min |
| 68 | Pneumatic workstation II, Vacuum generator | 10 L/min |
| 71 | Pneumatic workstation I, Rotary table, Port A | 5 L/min |
| 72 | Pneumatic workstation I, Rotary table, Port A | 10 L/min |
| 73 | Pneumatic workstation I, Rotary table, Port B | 0.5 L/min |
| 74 | Pneumatic workstation I, Rotary table, Port B | 1 L/min |
| 77 | Pneumatic workstation I, Parallel type air gripper 1, Port A | 0.5 L/min |
| 78 | Pneumatic workstation I, Parallel type air gripper 1, Port A | 1 L/min |
| 79 | Pneumatic workstation I, Parallel type air gripper 1, Port A | 5 L/min |
| 81 | Pneumatic workstation I, Parallel type air gripper 1, Port B | 0.5 L/min |
| 82 | Pneumatic workstation I, Parallel type air gripper 1, Port B | 1 L/min |
| 85 | Pneumatic workstation I, Parallel type air gripper 2, Port B | 0.5 L/min |
| 86 | Pneumatic workstation I, Parallel type air gripper 2, Port B | 1 L/min |
| 96 | Pneumatic workstation I, Low profile slid table, Port A | 10 L/min |
| 97 | Pneumatic workstation I, Low profile slid table, Port B | 0.5 L/min |
| 98 | Pneumatic workstation I, Low profile slid table, Port B | 1 L/min |
| 105 | Pneumatic workstation V, 180∘ angular type air gripper, Port B | 0.5 L/min |
| 106 | Pneumatic workstation V, 180∘ angular type air gripper, Port B | 1 L/min |
| 107 | Pneumatic workstation V, 180∘ angular type air gripper, Port B | 5 L/min |
| 109 | Pneumatic workstation V, 180∘ angular type air gripper, Port A | 0.5 L/min |
| 110 | Pneumatic workstation V, 180∘ angular type air gripper, Port A | 1 L/min |
| 117 | Pneumatic workstation III, Parallel type air gripper, Port A | 0.5 L/min |
| 118 | Pneumatic workstation III, Parallel type air gripper, Port A | 1 L/min |
| 120 | Pneumatic workstation III, Parallel type air gripper, Port A | 10 L/min |
| 121 | Pneumatic workstation IV, Air slide table, Port B | 0.5 L/min |
| 122 | Pneumatic workstation IV, Air slide table, Port B | 1 L/min |
| 129 | Pneumatic workstation II, Air slide table, Port B | 0.5 L/min |
| 130 | Pneumatic workstation II, Air slide table, Port B | 1 L/min |
4.2 CAM Analysis
Class Activation Mapping (CAM) is a critical technique for visualizing internal features of convolutional neural network (CNN) models, and is widely used in image classification and object detection tasks. The primary purpose of CAM is to highlight the regions of an image that the model focuses on, providing insights into which areas have the greatest influence on the model’s predictions. In this study, CAM is applied to visualize important features in one-dimensional time-series data, revealing the decision-making mechanism and key feature identification process of the 1D CNN during fault diagnosis. CAM visualizations are conducted based on exergy, flow, and pressure data to identify the causes of classification ambiguities in the designed 1D CNN model.
(1) CAM analysis based on exergy data Figure 10 shows a case of class activation mapping of exergy data with label 71 and 72. Figure 10(a) illustrates a sample correctly classified as label 71, while Figure 10(b) shows a sample incorrectly classified as label 71, with its true label being 72. Figure 10(c) presents a sample correctly classified as label 72. The regions with deeper red are of more significance in decision-making processes. Figure 10(d) displays the raw data curves for these three samples, revealing a high degree of similarity among them. Additionally, the CAM-identified regions of feature importance for samples with labels 71 and 72 are highly similar, leading to misclassification between these two fault types. Nevertheless, there are still small differences between class activation mapping of data with label 71 and 72. From the perspective of vision of our naked eyes, the differences between data labeled 71 and 72 are located at the down curve regions with low values. However, the 1D CNN model pays more attention on the up curve regions with high values. This is the main reason why the sample labeled 72 is confused with the sample labeled 71. This counterintuitive phenomenon may be attributed to the fact that a global optimum considering all 133 types of data, instead of a local optimum considering only 2 types of data, is achieved in the 1D CNN model. Overall, the CAM method offers a valuable interpretive framework for understanding the neural network’s decision-making process, guiding model optimization and performance improvement.
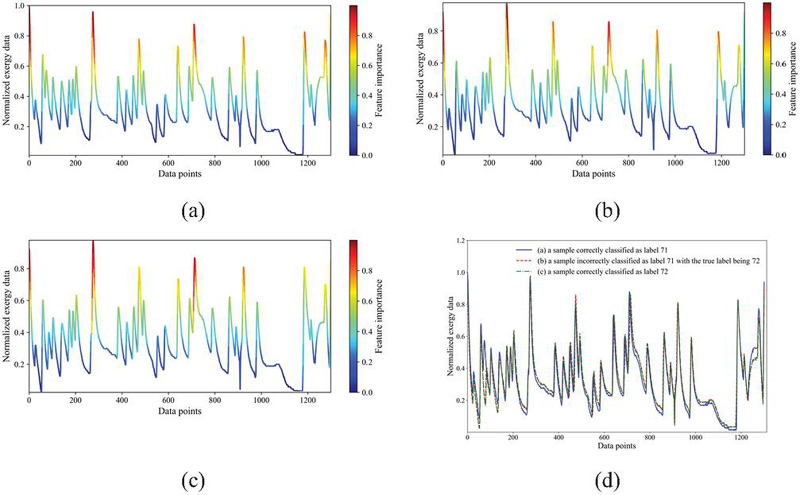
Figure 10 Class-activated mapping of exergy data for label 71 and label 72.
(2) CAM analysis based on flow data Figure 11 illustrates the CAM visualization analysis based on flow data. Figure 11(a) shows a sample correctly classified as label 16, while Figure 11(b) shows a sample incorrectly classified as label 16 with the true label being 96. Figure 11(c) shows a sample correctly classified as label 96. Figure 11(d) displays the raw data curves for these three samples, which are strikingly similar. Furthermore, the CAM representation of feature importance for both label 16 and label 96 samples is highly similar, leading to the classification confusion between these two fault types.
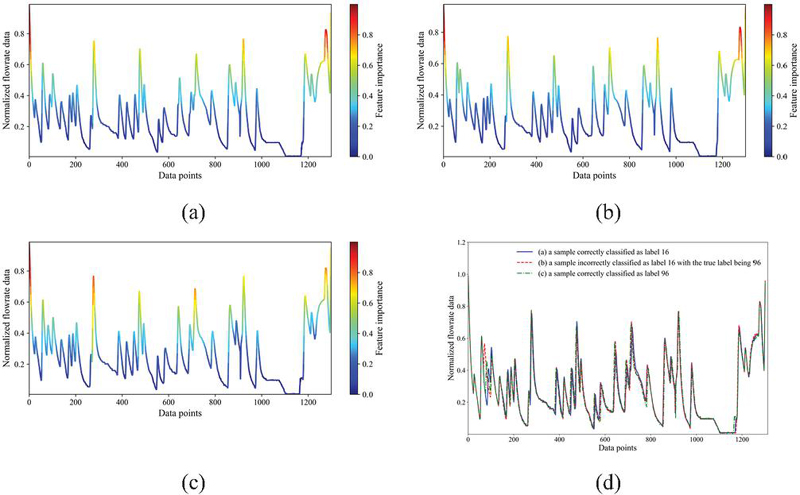
Figure 11 Class-activated mapping of flow data for label 16 and label 96.
(3) CAM analysis based on pressure data Figure 12 presents the CAM visualization analysis based on pressure data. Figure 12(a) shows a sample correctly classified as label 74, while Figure 12(b) shows a sample incorrectly classified as label 74, with the true label being 73. Figure 12(c) shows a sample correctly classified as label 73. Figure 12(d) displays the raw data curves for these three samples, which are almost identical. Moreover, the CAM feature importance areas for the label 74 and label 73 samples are highly similar, which led to confusion between these two types of fault during classification.
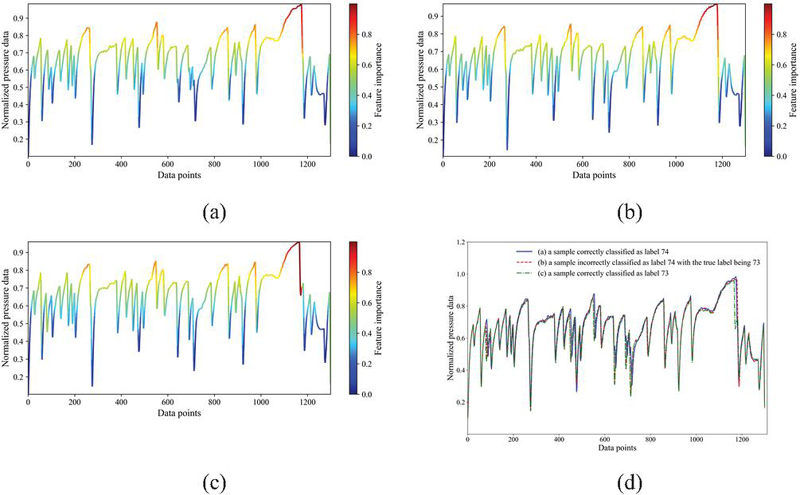
Figure 12 Class-activated mapping of pressure data for label 73 and label 74.
4.3 Occlusion Sensitivity Analysis
Occlusion Sensitivity Analysis (OSA) is an interpretability method used to assess a deep learning model’s sensitivity to the importance of different parts of the input data. It is widely applied in model interpretation, feature importance analysis, and performance evaluation. This method systematically occludes local regions of the input data and analyzes the extent to which the model’s output changes due to the occlusion, revealing the key regions or features on which the model’s decision depends. This technique is a crucial tool in the research of explainability and reliability in deep learning models. In this study, we apply OSA to explain the classification decision-making mechanism of one-dimensional time-series data. Unlike CAM, which focuses on reflecting the feature regions attended to by the model during internal decision-making, OSA analyzes the influence of each feature on the final decision from the perspective of the input data.
(1) OSA based on exergy data Figure 13 presents the results of the OSA visualization analysis based on exergy data. Figure 13(a) shows a sample correctly classified as label 37, Figure 13(b) shows a sample incorrectly classified as label 37, with the true label being 122, and Figure 13(c) shows a sample correctly classified as label 122. Figure 13(d) shows the original data curves of these three samples. It is evident that they are nearly identical, and the data importance regions represented by OSA for the label 37 and label 12 samples are highly similar, leading to confusion between these two fault types during classification.
It is evident that there are notable differences between OSA and CAM visualizations. These differences arise from the distinct underlying principles of these two methods. CAM provides a global perspective by visualizing the regions of the input that the model attends to overall, whereas OSA adopts a localized approach, assessing the model’s reliance on specific input regions by systematically occluding them. Consequently, the visualized outcomes of the two methods exhibit unique and contrasting characteristics.
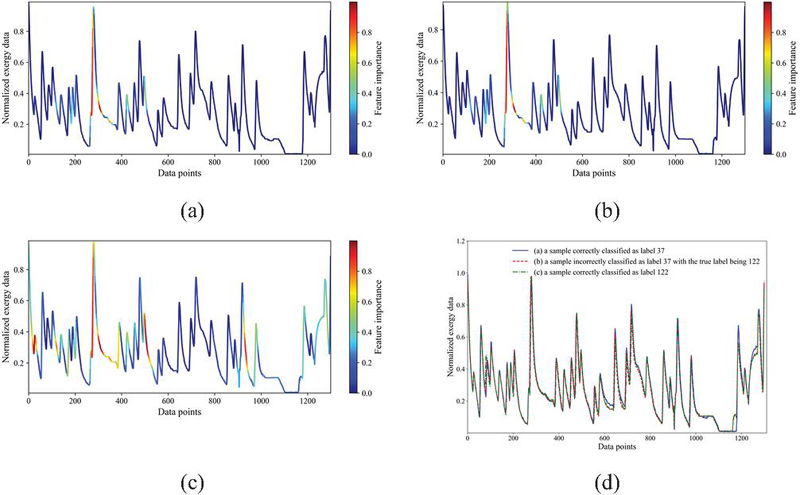
Figure 13 Occlusion sensitivity map of exergy data for label 37 and label 122.
(2) OSA based on flowrate data Figure 14 presents the results of the OSA visualization analysis based on flow signal data. Figure 14(a) shows a sample correctly classified as label 105, Figure 14(b) shows a sample incorrectly classified as label 105, with the true label being 106, and Figure 14(c) shows a sample correctly classified as label 106. Figure 14(d) shows the original data curves of these three samples. It is also evident that they are nearly identical, and the data importance regions represented by OSA for the label 105 and label 106 samples are highly similar, leading to confusion between these two fault types during classification.
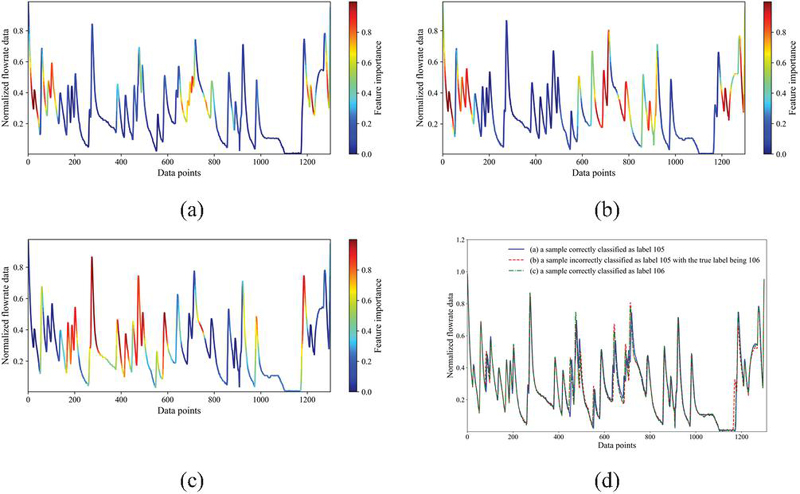
Figure 14 Occlusion sensitivity map of flowrate data for label 105 and label 106.
(3) OSA based on pressure data Figure 15 presents the results of the OSA visualization analysis based on pressure signal data. Figure 15(a) shows a sample correctly classified as label 85, Figure 15(b) shows a sample incorrectly classified as label 85, with the true label being 86, and Figure 15(c) shows a sample correctly classified as label 86. Figure 15(d) shows the original data curves of these three samples. It is also evident that they are nearly identical, and the data importance regions represented by OSA for the label 85 and label 86 samples are highly similar, leading to confusion between these two fault types during classification.
Analysis of the OSA images reveals that highly sensitive data regions are primarily concentrated in visually distinguishable key areas. This indicates that, in most cases, the model effectively captures critical data information that plays a significant role in distinguishing operating conditions during classification. However, the primary cause of misclassification is the model incorrectly treating non-critical data regions unrelated to the current operating condition as key classification information, leading to errors. For instance, as shown in Figure 15(a) and 15(b), the samples from two different operating conditions exhibit highly similar sensitivity maps, and the model fails to fully focus on the truly critical features describing the operating conditions. This phenomenon may indicate that the model has certain biases in feature selection, failing to entirely focus on the truly critical information describing the operating conditions.
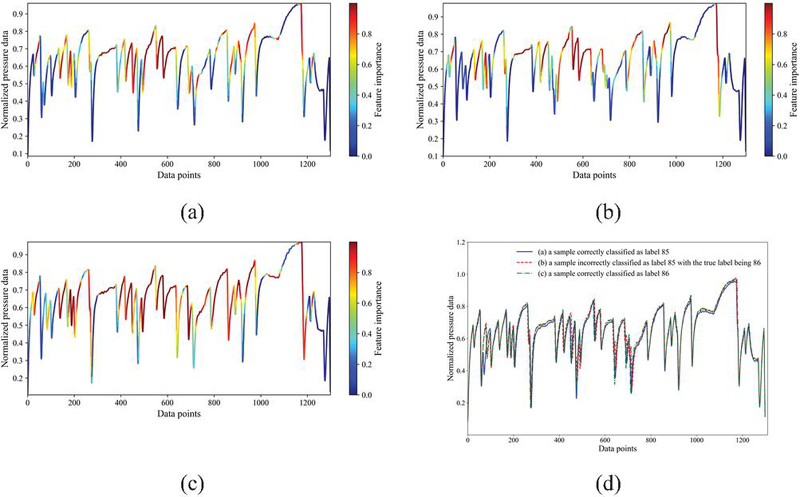
Figure 15 Occlusion sensitivity map of pressure data for label 85 and label 86.
5 Conclusions
Generally, it is regarded that fault diagnosis of pneumatic system is more difficult than hydraulic and mechanical counterparts due to the additional nonlinearity and coupling caused by compressed air. And it has been proven it is almost impossible to achieve low-cost fault diagnosis of complex pneumatic system with a minimal number of sensors and traditional signal-based methods. However, in this study, we challenge and overturn this judgment. With only one flow sensor and one pressure sensor, the leakage faults of a pick-and-place demonstration system with 17 pneumatic actuators are successfully diagnosed with very high accuracy with the help of a one-dimensional convolutional neural network. The main conclusions are drawn as follows.
• Low-cost faults diagnosis of complex pneumatic system is possible using a minimal number of commonly used sensors. In this study, only the leakage faults are taken as examples. Actually, this can be extrapolated to other faults, such as abnormal movement of actuators, disconnection of pipelines, and failure of control valves, etc., because all kinds of faults share a common first principle. That is, any anomalies and faults could change the profiles of energy flow (mainly reflected by flow rate and pressure of compressed air) in pneumatic systems.
• Machine learning methods show greater potential than traditional experience-based, model-based, and signal-based methods for intelligent fault diagnosis in complex pneumatic systems. With CNN, the critical feature extraction process can be completed automatically, and the sophisticated and in-deep understand and analysis on diverse and complex data can be avoided, which makes machine learning methods more universal and transferable.
• Fault diagnosis with exergy data performs better than those with sole pressure data and sole flow data, because the exergy data can be regarded as a fusion between pressure data and flow data. In this case study, the average accuracies of leakage fault diagnosis with pressure, flow rate, and exergy data are 89.5%, 96.8%, and 98.9%, respectively.
• Confusion matrix analysis shows that most confusion occurs between 0.5 L/min and 1 L/min leakage faults at the same location with contiguous labels. This is due to the small difference in leakage rates between the two faults, resulting in similar or overlapping features that affect the model’s classification accuracy between these two types of fault. Class Activation Mapping (CAM) and Occlusion Sensitivity Analysis (OSA) provide valuable insights from different perspective for explaining, optimizing, and understanding machine learning models.
The main aim of this study is to investigate the feasibility of low-redundancy and low-cost fault diagnosis in complex pneumatic systems with a minimal number of sensors. The methodology proposed in this study can be easily transferred and utilized in other pneumatic systems. There is no doubt that there is still a big gap between this experimental study and practical industrial applications. Several challenges remain to be addressed and refined in the near future. First, expanding the diagnostic scope beyond leakage faults to include other critical failure modes (e.g., friction variations, bearing wear, seal degradation) is essential for broader practical applications. Second, acquiring sufficient high-quality labelled fault data for all potential failure types across diverse machinery in real-world industrial environments presents substantial challenges and is often impractical.
Acknowledgements
This work was supported by the National Natural Science Foundation of China under Grant [number 51905066].
References
[1] M. Borg, P. Refalo, and E. Francalanza. Failure Detection Techniques on the Demand Side of Smart and Sustainable Compressed Air Systems: A Systematic Review. Energies, 2023, 16(7): 3188. https://doi.org/10.3390/en16073188.
[2] M. Demetgul, I. N. Tansel, and S. Taskin. Fault diagnosis of pneumatic systems with artificial neural network algorithms. Expert Syst. Appl., 2009, 36(7): 10512–10519. https://doi.org/10.1016/j.eswa.2009.01.028.
[3] K. Zhang. Fault Detection and Diagnosis for Multi-Actuator Pneumatic Systems. Ph.D. dissertation, Stony Brook Univ., New York, NY, USA, 2011.
[4] Z. Wang et al. Facilitating Energy Monitoring and Fault Diagnosis of Pneumatic Cylinders with Exergy and Machine Learning. Int. J. Fluid Power, 2023, 24(4): 643–682. DOI: 10.13052/ijfp1439-9776.2442.
[5] M. Daigle, C. S. Kulkarni, and G. Gorospe. Application of model-based prognostics to a pneumatic valves testbed. 2014 IEEE Aerospace Conf., Big Sky, MT, USA, 2014, pp. 1–8. DOI: 10.1109/AERO.2014.6836319.
[6] B. M. Rahman et al. Fault Diagnosis of Pneumatic Systems: Application of a Systematic Model-Based Methodology. IFAC-PapersOnLine, 2017, 50(1): 3294–3300. https://doi.org/10.1016/j.ifacol.2017.08.505.
[7] W. Gauchel, T. Streichert, Y. Wilhelm. Predictive Maintenance with a Minimum of Sensors using Pneumatic Clamps as an Example. The 9th Int. Fluid Power Conf Dresden, Oct. 12–14, 2020. https://doi.org/10.25368/2020.81.
[8] V. Boyko and J. Weber. Cycle Time-Based Fault Detection and Localization in Pneumatic Drive Systems. Actuators. 2024, 13(11):447. https://doi.org/10.3390/act13110447.
[9] W. Ertel et al. Model Free Diagnosis of Pneumatic Systems using Machine Learning. The 9th Int. Fluid Power Conf., Aachen, Germany, Mar. 24–26, 2014.
[10] T. Kovacs and A. Ko. Monitoring Pneumatic Actuators’ Behavior Using Real-World Data Set. SN Comput. Sci., 2020, 1: 196. https://doi.org/10.1007/s42979-020-00202-2.
[11] Z. Ding et al. A Deep-Learning-Based Low-Cost Micro-Leakage Measurement System for Industrial Applications. IEEE-ASME Trans. Mechatron., 2024, 29(1): 119–130. DOI: 10.1109/TMECH.2023.3272797.
[12] M. Tiboni and C. Remino. Condition Monitoring of Pneumatic Drive Systems Based on the AI Method Feed-Forward Backpropagation Neural Network. Sensors, 2024, 24(6): 1783. https://doi.org/10.3390/s24061783.
[13] Y. Shi et al. Improved object detection network for pipeline leakage localization in the pneumatic system based on thermal images. Measurement, 2025, 242: 116225. https://doi.org/10.1016/j.measurement.2024.116225.
[14] M. Borg, P. Refalo, and E. Francalanza. Fault Condition Indicators along the Demand Side of a Sustainable Compressed Air System. Procedia CIRP, 2024, 126: 283–288. https://doi.org/10.1016/j.procir.2024.08.340.
[15] H. Zhu et al. Leakage Fault Diagnosis of Two Parallel Cylinders in Pneumatic System with a Minimal Number of Sensors. Electronics, 2023, 12(15): 3261. https://doi.org/10.3390/electronics12153261.
[16] Z. Wang et al. Low-cost Fault Diagnosis of Pneumatic Systems with Exergy and Machine Learning: Concept, Verification, and Interpretation. JFPS Int. J. Fluid Power Syst., 2023, 16(2): 24–32. https://doi.org/10.5739/jfpsij.16.24.
[17] Z. Tong et al. Accumulated and transient exergy analyses of pneumatic systems with isochoric and isobaric compressed air storage tanks. Energy Storage, 2021, 3(6): e269. https://doi.org/10.1002/est2.269.
[18] A. Krizhevsky, I. Sutskever, and G. E. Hinton. ImageNet classification with deep convolutional neural networks. Commun. ACM, 2017, 60(6): 84–90. https://doi.org/10.1145/306538.
Biographies

Lingchao Yu received his bachelor’s degree in Mechanical Engineering from Qingdao University of Science and Technology in 2023. Currently, he is pursuing his master’s degree in Mechanical Engineering at Dalian Maritime University. His research interests include pneumatic fault diagnosis and machine learning.

Zhiwen Wang received the bachelor’s degree of Marine Engineering from Dalian Maritime University in 2012 and the philosophy of doctorate degree in Marine Engineering from Dalian Maritime University in 2018, respectively. He is currently working as an Associate Professor at the Department of Mechanical Engineering, Dalian Maritime University. His research areas include energy saving and FDD of pneumatics, thermodynamics, and energy storage.

Chunpu Zhang received his bachelor’s degree in Mechanical Engineering from Dezhou University in 2022. He is currently pursuing a master’s degree in Mechanical Engineering at Dalian Maritime University. His research areas include data-driven modeling.

Zheng Zhao received his B.D., M.D. and Ph.D. degrees of information science and technology in 2010, 2013, and 2017, respectively. He is currently a lecturer in the College of Artificial Intelligence, Dalian Maritime University, Dalian, China. His research interests include next-generation internet, data security, and artificial intelligence.

Duo Li received his bachelor’s degree in Mechanical Engineering from Shenyang Jianzhu University and Technology in 2023. Currently, he is pursuing his master’s degree in Mechanical Engineering at Dalian Maritime University. His research interests include pneumatic fault diagnosis and machine learning.

Rupp Carriveau is a Professor of Mechanical, Automotive & Materials Engineering, University of Windsor, Canada. He received his BSc in Civil Structural Engineering from University of Windsor. He obtained his MSc and PhD in Fluids Engineering from Western University, Canada. His research interests cover energy storage, renewable energy, and systems optimization etc.

David S.-K. Ting is a Professor of Mechanical, Automotive & Materials Engineering, University of Windsor, Canada. He received his BSc in 1989 from University of Manitoba. He obtained his MSc and PhD in 1992 and 1995 from University of Alberta, Canada. His major research interests are turbulence, heat transfer, energy & thermal systems, renewable energy, and aerodynamics.

Wei Xiong is a Professor of Mechanical Engineering, Dalian Maritime University. He is the director of Ship Electromechanical Equipment Institute. He received his PhD in the Faculty of Mechatronic Engineering from Harbin Institute of Technology, China. His major research interests are fluid power and control, marine rescue, and compressed air energy storage.
International Journal of Fluid Power, Vol. 27_2, 327–358
doi: 10.13052/ijfp1439-9776.2723
© 2026 River Publishers