Gas Void Fraction Monitoring with Speed of Sound Measurements for Hydraulic System Aeration Monitoring
Brian L. Steward1,*, Daniel Gysling2 and James Oftelie3
1Agricultural and Biosystems Engineering Department, Iowa State University, Ames, Iowa, USA
2CorVera LLC, South Glastonbury, Conn., USA
3Aeration Measurement Technology LLC, Longview, Texas, USA
E-mail: bsteward@iastate.edu; dgysling@corvera.io; james.oftelie@amtechllc.com
*Corresponding Author
Received 31 July 2025; Accepted 30 January 2026
Abstract
Knowledge of the level of entrained air in pump inlets is important for hydraulic system design. Entrained air levels, often quantified as gas void fractions, can change with operation of hydraulic systems, so monitoring entrained air during operations can provide substantial design insight to a hydraulic system. The performance of a SONAR-based entrained air measurement system was investigated on a test hydraulic system utilizing a Coriolis meter as a reference. Two instances of the measurement system were installed on the inlet line of a hydraulic pump in series with a Coriolis meter. One instance of the SONAR-based entrained air measurement system was installed to measure the gas void fraction (GVF) within the flow tubes of a Coriolis flow meter, and a second instance of the SONAR-based entrained air measurement system was installed to measure the GVF within in a section of hydraulic hose in series with the Coriolis meter. Data were recorded to evaluate the SONAR-based entrained air measurement systems both upstream and downstream, as well as collocated with, the Coriolis meter. Speed of sound (SOS) measurements were acquired within the aerated hydraulic oil in the inlet line as the GVF was varied utilizing a variable area flow restriction installed within the pump inlet line. Increasing the restriction reduced the pressure and increased the GVF within the hydraulic fluid due to (1) the existing gas expanding and (2) additional out-gassing from the hydraulic oil. The measured SOS was utilized to determine a gas volume fraction (GVF) within each instance of the SONAR-based GVF measurement system. Additionally, GVF was also calculated from the density measurements of a Coriolis flow meter. GVF measurements from the SOS measurement test section across the Coriolis meter were highly correlated with GVF calculated from Coriolis meter density measurements. The SOS GVFs were shifted up by up to 0.126 % GVF and matched with 0.2% RMSE. For the upstream or downstream SOS GVF measurements, there was variation from those calculated from Coriolis meter density measurements. These differences were anticipated due to pressure differences in the pipe section from that in the Coriolis meter. These pressure differences resulted in differences in the air released from the hydraulic fluid and differing GVFs in the two sections. These results show that the SOS measurement technique can accurately measure the entrained air status of hydraulic systems.
Keywords: Gas volume fraction, entrained air, hydraulic systems, speed of sound.
1 Introduction
Entrained gases in hydraulic systems are contaminants that have detrimental effects the operation, life and performance of the systems. Entrained gas entering the pump is typically the results of two processes. First, fluid aeration is the entry of entrained air into the fluid that is not effectively removed by the reservoir prior to entering the pump. Various mechanisms can introduce entrained air such as splashing of fluid returning to the reservoir, turbulence at the air-fluid interface at the top of the reservoir, the formation of inlet vortices within the reservoir as fluid is being drawn out by the pump, and air being drawn in through leaks in fittings on the suction line of the pump. The second way that entrained gases are introduced to the fluid is through cavitation. Cavitation can happen in two ways. Gaseous cavitation occurs when the pressure is less than the saturation pressure of the fluid and dissolved air in the fluid comes out of solution and forms air bubbles entrained in the fluid [1]. Vaporous cavitation occurs when the pressure is less than the vapor pressure of the fluid, and the bubbles form from hydraulic fluid vapor.
Because of the importance of overcoming aeration, several studies have sought out solutions to this problem. Longhitano et al. [2] experimentally investigated the air release rate in different reservoir designs. Their main contribution was the development of an experimental procedure for measuring air release rate in hydraulic reservoirs. In related work, Wohlers et al. [3] also investigated design optimization of hydraulic reservoirs using both numerical and empirical tools.
The air release property of a hydraulic oil is also an important factor in reducing the effects of aeration since if a hydraulic fluid gives up air more quickly in the hydraulic reservoir than the likelihood of aeration at the inlet to a pump is reduced even with reduced residence times in the reservoir. Gullapalli et al. [4] investigated the air release rates of fluids with the same ISO viscosity but with different base oil and additives. They found significant differences in air release rates resulting in effects on volumetric efficiency and pump noise level. Schrank et al. [5] further investigated the dynamics of air absorption and air release. Furthermore, the cavitation phenomenon has been added to models of hydraulic components [6, 7] because of the influence of cavitation on their operation.
A challenge to investigating aeration is the measurement of the level of entrained air in a hydraulic fluid. Schrank et al. [8] reviewed the optical, electrical, and mechanical properties of hydraulic fluids that could be used for sensing the entrained air in the fluid. Additionally, they investigated four entrained air sensing approaches including (1) mixture density through measurement of pressure drop across flow through an orifice, (2) compressibility in a cylinder, (3) photography, and (4) electrical permittivity of the fluid. These approaches were compared with each other and trade-offs were considered. It is clear that measurement of aeration in hydraulic fluid is challenging to accomplish, particularly in the context of sensing in-situ on vehicles in the field. SONAR-based gas void fraction (GVF) measurement technology has been shown to accurately measure the GVF in a wide range of gas/liquid mixtures [9, 10] providing a solid foundation for its application to in-situ measurement of aeration levels in hydraulic fluids. Pan et al. [11] showed the utility of this technology in measuring real-time in-situ GVF to study complete filling behavior of positive displacement pumps, and the work reported on in this paper serves to validate its ability to accurately quantify gas void fraction in fluid power hydraulic systems.
2 Background on SONAR-Based Gas Void Fraction Measurement
The method for measuring the gas void fraction in the hydraulic fluid in this work is a SONAR-based GVF measurement approach described in [9]. SONAR-based GVF measurement was initially developed to measure multiphase flows for the oil and gas industry and is currently utilized to measure gas void fractions in a wide range of applications, including oil and gas, mining and minerals, and pulp and paper industries.
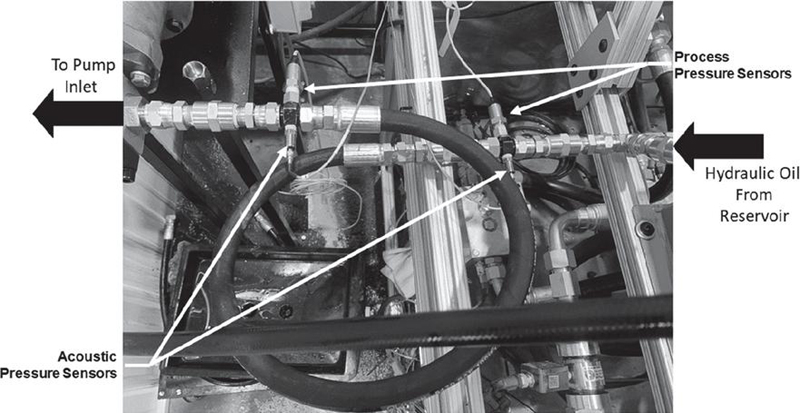
Figure 1 Instrumented hydraulic couplings with acoustic pressure sensors and process pressure sensors installed on both ends of a hydraulic hose enable measurements of speed of sound within the hydraulic hose.
Gas void fraction is defined as the volume of entrained gas over the total volume of an aerated liquid, and can be represented mathematically as:
| (1) |
where is the gas void fraction, is the volume of entrained gas in the liquid, and is the volume of liquid, and is used to indicate the level of aeration in a hydraulic fluid.
The SONAR-based method utilizes a pair of acoustic pressure transducers installed on both ends of a hydraulic conduit to measure and interpret the speed at which naturally-occurring, low frequency acoustic waves propagate within the hydraulic piping network (Figure 1). The hydraulic conduit can consist of a wide range of conduits including flexible hydraulic hoses, rigid pipes, and flow tubes within Coriolis meters. The outputs of the acoustic sensors are processed utilizing SONAR-based beamforming algorithms to determine speed at which the sound is propagating.
SONAR beamforming algorithms use signals measured from multiple locations, for example, from an array of signal transducers in an acoustic media. Array signal processing transforms signals from the temporal-spatial domain to the wave number-frequency () domain. On a 2D plot of acoustic power, there is an acoustic ridge to which a line can be fit. The slope of the line is the speed of sound (SOS) since:
| (2) |
where is the SOS in the mixture, is the frequency, and k is the wave number. When using only two acoustic pressure sensors, the problem reduces to finding the peak of the power as a function of SOS (Figure 2).
This measured SOS is then used to determine the gas void fraction of the process fluid utilizing Wood’s Equation [12, 13] expressed as follows:
| (3) |
where is the low frequency SOS, and is the density of a mixture consisting of “N” components to the volumetric phase fraction, , density, and SOS, of each component of the mixture. The compliance of the conduit, given for a thin-walled, circular cross section conduit of diameter and wall thickness of and modulus of , also influences the propagation velocity.
The mixture density, , is given by a volumetrically-weighted average of the components:
| (4) |
For cases in which the volumetrically-weighted compressibility of the gas phase dominates the compressibility of the mixture, which is typically a good approximation at low pressures with gas void fractions 0.1%, Wood’s equation can be approximated as follows:
| (5) |
where is the polytropic exponent governing the compressibility of the gas bubbles and is the process pressure. SOS is thus a function of gas void fraction for a representative mix of air and oil over a range of pressures (Figure 3). The gas SOS is expressed as a function of gas temperature, , the gas constant, , and the polytropic exponent .
| (6) |
The appropriate polytropic exponent depends on the frequency of the sound waves compared to a thermal relaxation frequency set by the bubble diameter and the thermal diffusivity of the gas [14]. For air bubbles, this polytropic exponent can range from isothermal conditions, , for low frequencies compared to the thermal relaxation frequency, to isentropic conditions, , for high frequencies compared to the thermal relaxation frequency. For most SONAR-based GVF measurement applications in hydraulic systems, the frequencies utilized are sufficiently low, and the air bubbles are sufficiently small for the propagation of the sound to be well modelled as isothermal ().
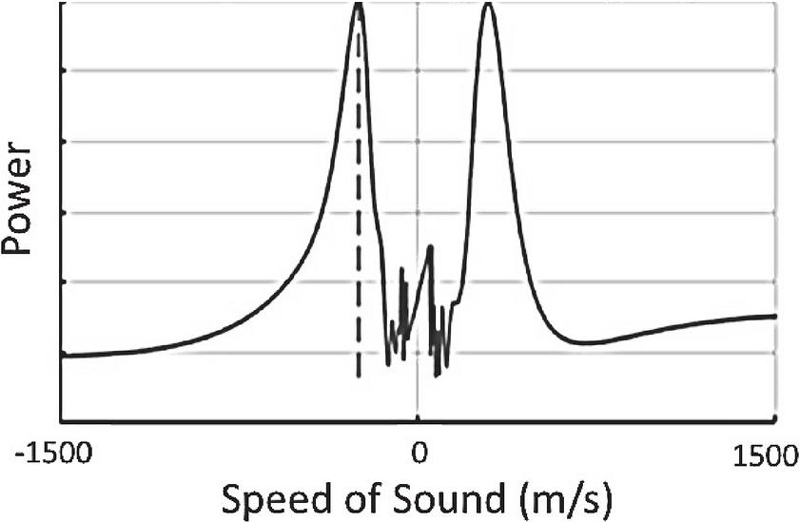
Figure 2 Acoustic power acquired from a SONAR sensor array where the power plotted is the output of a beam-forming optimization process. The sound speed associated with the maximum power is the optimized sound speed within the array.
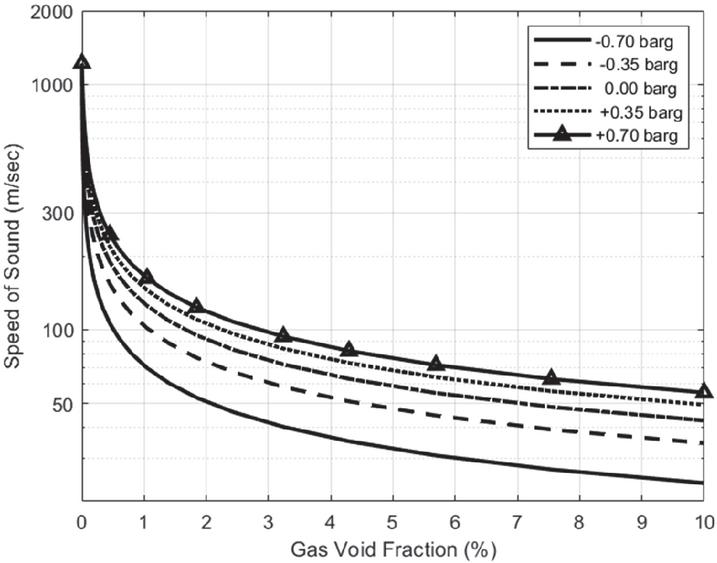
Figure 3 Speed of sound in a multiphase fluid is a function of GVF and process pressure. The speed of sound decreases the most when the pressure is low as GVF increases. Wood’s equation shows static mixture pressure is an important parameter determining the relationship between the measured sound speed of the process fluid and GVF.
Given that SONAR-based GVF measurement technology has been and is currently being used in a wide range of other applications with good performance, it was anticipated that the technology could be used also for measuring the aeration state in hydraulic systems. Thus, the objective of this work is to investigate the performance of the SOS measurement approach in estimating entrained air in a hydraulic system.
3 Methods
A hydraulic test system was constructed and used for the experiments of this study (Figure 4). ISO VG 46 Hydraulic fluid (S2 MX 46 Tellus, Shell USA, Inc., Houston, Texas) was used for the system fluid. An 8 cc/rev external gear pump drew fluid from a 19 L steel hydraulic reservoir. On the upstream side of the pump, the fluid passed through a ball valve which restricted flow from the reservoir, lowering fluid pressure resulting in air being drawn out of solution. Two circuits were used for different measurement configurations. The first circuit (Figure 5) passed fluid through a 1.092 m (43 in.) long section of 100R17-10 hydraulic hose which had integrated electronics piezoelectric (IEPE) acoustic pressure sensors measuring the acoustic pressure at each end of the section. This test section was called SOS measurement test section #1 (MTS1). Then the fluid passed through a Coriolis flow meter (model CMF 100, Micromotion Inc., Boulder, CO), which had a second set of IEPE acoustic pressure sensors installed at the inlet and outlet of the Coriolis meter and used to determine the SOS measurement within the flow tubes of the Coriolis meter (test section #2; MTS2). Additionally, two static pressure sensors at each end of the section measured the process pressure for both MTS1 and MTS2. After the test sections, the aerated hydraulic oil entered the gear pump inlet which was powered by a 2 Hp electric motor with a nominal shaft speed of 1740 rpm. Signals from the pressure sensors were provided to the SOS signal processing computer which produced one GVF measurement every four seconds.
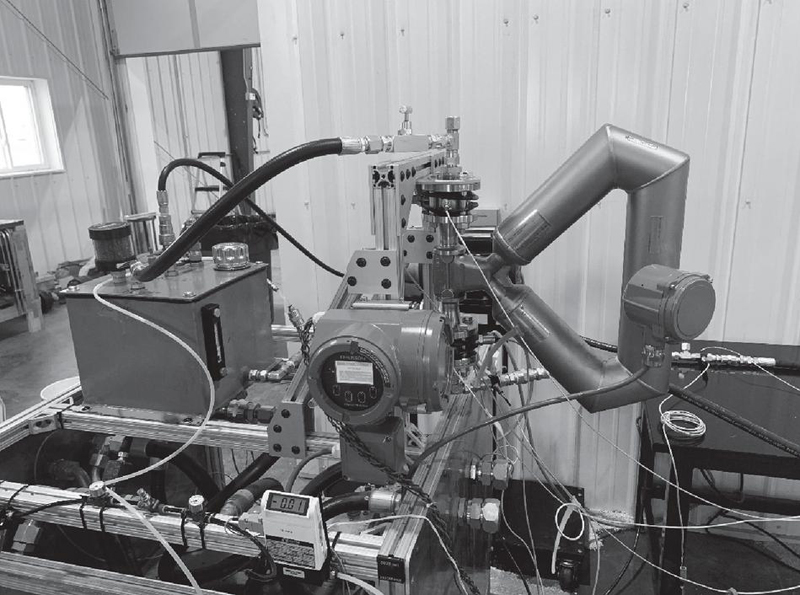
Figure 4 Hydraulic test system at the Iowa State University Off-Highway Vehicle Chassis Dynamometer Lab. The Coriolis flow meter in the foreground had acoustic pressure sensors mounted on its inlet and outlet for measuring SOS.
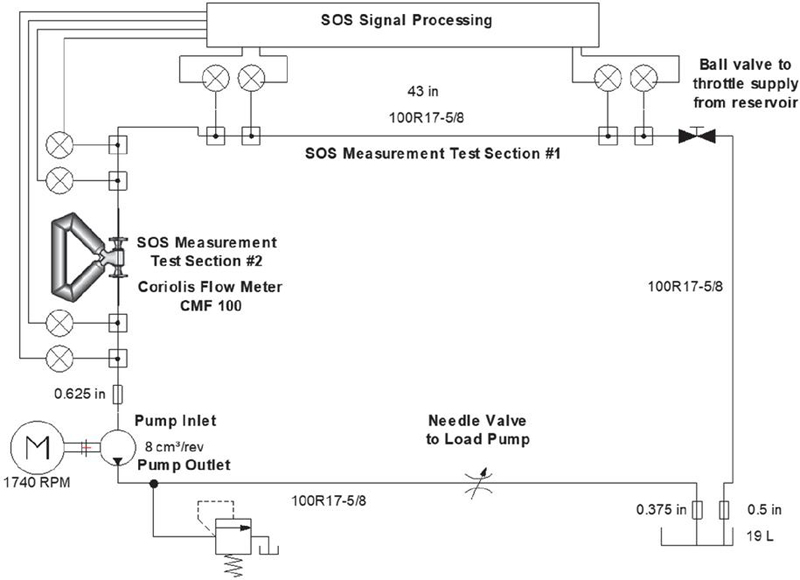
Figure 5 First Test circuit with SOS measurement test section #1 placed upstream from the Coriolis flow meter. SOS measurement test section #2 included the section of pipe in the Coriolis flow meter.
The second test circuit was the same as the first test circuit except that the location of the test hose section (MTS1) was placed downstream of the Coriolis flow meter. That is, the fluid passed first through the Coriolis flow meter and then travelled through MTS1 (Figure 6). MTS2 included the Coriolis meter as in the first test circuit.
For each test section, the pump drew fluid from the reservoir passing through the measurement aperture formed by the two acoustic pressure sensors and the hose section between the sensors. Static pressures were also measured at the beginning and end of each test section, and the mean static pressure within the test section was used to determine the GVF based on Equation (5) using the SOS found from the beam-forming techniques. For each circuit, the pressure was set at six levels using the ball valve at the outlet of the reservoir. Measurements were acquired at each level for about a minute (50 to 180 sec). The pressure measurements were processed to find the SOS and then, utilizing the known density of the hydraulic oil, the GVF of the aerated oil was calculated.
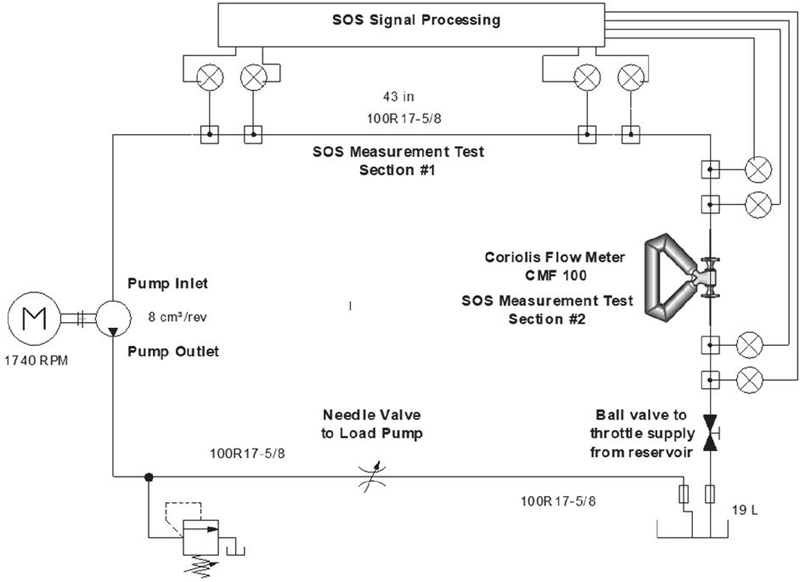
Figure 6 Second test circuit in which SOS measurement test section #1 was placed downstream from the Coriolis Flow meter. MTS2 included the Coriolis Flow meter as in the first test circuit.
In this set of experiments, the intent of the Coriolis meter is to provide a reference measurement of the gas void fraction. Although Coriolis flow meters are well known to provide accurate flow of single-phase fluids, it is also well-known that bubbly flows can lead to substantial measurement errors on aerated liquids. This work utilizes an approach to increase the confidence of the accuracy of the Coriolis-based gas void fraction measurement utilizing a self-consistency argument based on comparisons between the Coriolis meter density and the collocated SONAR-based gas void fraction measurement.
As background, the errors in Coriolis meters operating on aerated liquids are often attributed to two primary mechanisms – decoupling and compressibility. Decoupling is the phenomena in which the amplitude of the vibration of the bubbles is different from that of the liquid in the vibrating Coriolis tubes. The second error source is the increased compressibility of the bubbly fluid resulting in a reduced frequency of the tube vibrations.
These errors affect the measurement of fluid density according to a model presented by [15], which can be expressed mathematically by:
| (7) |
where is the measured density, is the density of the liquid phase of bubbly liquid, is the gas void fraction, is the reduced frequency of the vibrating tubes, is the density decoupling parameter and is the density compressibility parameter [9]. ranges from 1 to 3 under fully-coupled to fully-decoupled conditions. The reduced frequency is defined as:
| (8) |
where is the vibration frequency that the tube is being driven, is the inner diameter of the Coriolis meter tube, and is the SOS of the bubbly liquid.
The ratio of the mixture density reported by the Coriolis meter to the known liquid density can be expressed as a function of the gas void fraction and reduced frequency.
| (9) |
where is the ratio between the measured density and the density of the liquid.
For conditions with minimal decoupling, i.e. , and the reduced frequency approaches zero, i.e. , the measured density from a Coriolis meter can be related to the gas void fraction within the Coriolis meter as follows;
| (10) |
Thus, assuming the errors due to compressibility and decoupling are negligible, the density from the Coriolis meter can be used with the known density of the liquid to determine a gas void fraction as follows:
| (11) |
when .
For this work, the reduced frequency of Coriolis meter is sufficiently low that the effects of compressibility can be neglected [9].
The role of decoupling in this application can be assessed analytically as described in [9] with knowledge of the fluid viscosity, vibration frequency, and bubble size. However, since bubble size is typically unknown and in general difficult to measure in most applications, utilizing this analysis to quantify the effects of decoupling can be elusive.
For these sets of experiments, both mixture density reported by the Coriolis meter and a SONAR-based gas void fraction within the flow tubes were measured. Utilizing these two collocated measurements, the role of decoupling on the Coriolis-based density measurement can be assessed empirically by comparing the measured density versus the measured GVF to assess the consistency of the Coriolis density measurement and the SONAR-based gas void fraction measurement. If the ratio of the measured density to the known liquid density plotted versus GVF is linear with a slope of minus 1 and a y-intercept of unity, then the data provides confidence that the Coriolis meter is providing an accurate mixture density with negligible effects of decoupling and that the gas void fraction measurement is accurate.
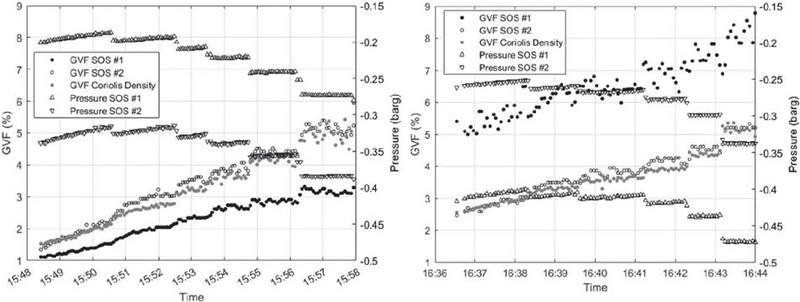
Figure 7 Time history of the two experiments with first (left) and second (right) test circuits. The pressure and GVF in the test sections changes depend on the order of the test sections in each circuit.
4 Results and Discussion
The time histories of the two experiments with the two test circuits show how the pressures in the two test sections decreased as the ball valve at the reservoir outlet was closed and created more restriction causing the pressure to drop (Figure 7). The different test circuits show how the upstream location of MTS1 relative to the Coriolis meter resulted in a MTS1 pressure being higher than that of MTS2 across the Coriolis meter for first test circuit, and for the second test circuit, MTS1 downstream of the Coriolis meter had a lower pressure than that of MTS2. These pressure difference affected the GVF in MTS1, lower than that of MTS2 in first test circuit, because lower pressures resulted in less air being drawn out of solution. The opposite effect was observed for the second test circuit. The GVF in MTS1 was higher than that in MTS2. These results show that the sensor is behaving qualitatively as expected.
Next, the Coriolis density errors were checked by plotting the density ratio, R, against the SOS measured GVF. For both circuits, the data followed the 1-GVF line showing that , and the bubble motion is effectively fully-coupled (Figure 8). Based on these results, we can be confident in the Coriolis meter density measurements and the Coriolis reference GVF values.
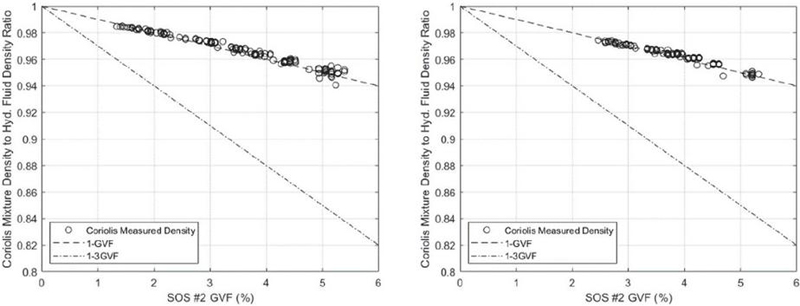
Figure 8 Plots of density ratio vs. GVF in MTS2 show that the bubble motion is completely coupled and compressibility errors are negligible for the Coriolis measurements of bubbly liquid density for first (left) and second test circuits (right).
For both test circuits, when GVF was measured over the same test section (MTS2) used by the Coriolis meter density measurements and SOS measurements, GVF matched between the measurement approaches (Figure 9). For the first test circuit, the relationship between the two GVF was explained by a linear relationship with a slope that was nearly unity with a 0.19% GVF RMSE. For the second test circuit the linear relationship also had a unity slope and a 0.16% GVF RMSE. The SOS measured GVF was higher than the Coriolis density GVF by 0.107 and 0.126 % GVF for the first and second test circuits, respectively.
For the SOS GVF measurements acquired over the hydraulic hose test section (MTS1) that was either upstream or downstream of the Coriolis meter, SOS GVF measurement was shifted off the 1-to-1 line relative to GVF calculated from Coriolis meter density measurements (Figure 10). However, these shifts were explainable due to the pressure differences with the section. Pressure differences in MTS1 and the Coriolis meter should result in different GVF fractions. For test circuit 1, the hose test section, MTS1 was upstream of the Coriolis meter and so the fluid had higher pressure in MTS1, and we would expect, based on Henry’s Law, a lower GVF as less gas was released from the solution in the section. However, the relationship between the two measurements of GVF appears quadratic which explained most of the variation in the measurements (; RMSE 0.07% GVF). This relationship may be due to a variety of causes such as bubble formation dynamics, changes in the pressures of the two sections or air leaks between the two sections. Determining the exact cause was beyond the scope of this work. Qualitatively, we would expect the downstream section to have a higher GVF which aligned with our observations.
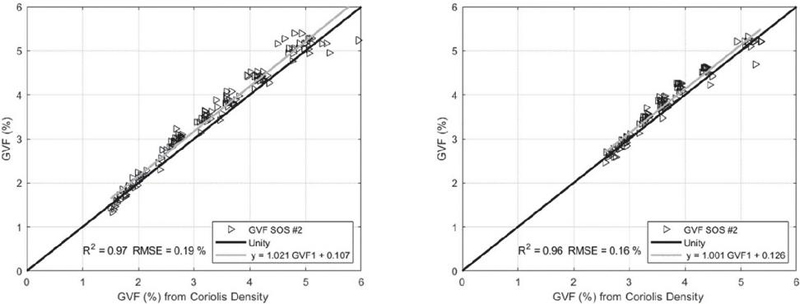
Figure 9 Measured GVF with SOS over the same test section (MTS2) as the Coriolis flow meter was linearly related to the GVF calculated from the Coriolis mixture density for both first (left) and second (right) test circuits.
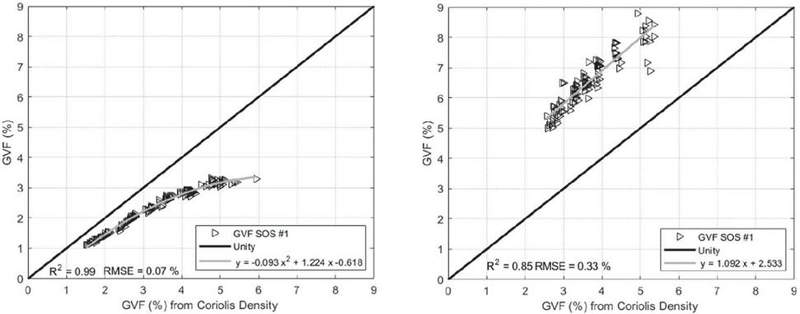
Figure 10 SOS measured GVF in MTS1 upstream of the Coriolis meter for the first circuit (left) and downstream for second circuit (right). Qualitative differences due to changes in fluid condition occurred as expected.
For test circuit 2, the hose test section, MTS1 was downstream of the Coriolis meter and larger GVF was measured in MTS1 as compared with what was obtained from the Coriolis meter. The pressure was lower in MTS1 so more air should be drawn out of solution in it. A linear relation explained much of the variability in the SOS GVF measurement, but less than in test circuit 1 (; RMSE 0.33% GVF). The shift of the line is 2.5% GVF off of the unity line.
These measurements of GVF in different test sections show that the entrained air level is changing as the hydraulic fluid travels through the sections and experiences changes in static pressure. We should only expect to measure the same GVF in the same measurement test section (MTS2) since GVF is being measured under the same fluid conditions. The measurement technology finding different GVFs in adjacent test sections builds confidence in the approach.
5 Conclusions
In this validation study of the SOS measurement of entrained air in hydraulic fluids, we can conclude the following:
1. The Coriolis meter was measuring density accurately because the density ratio was related to SOS measured GVF with a unity slope and no offset from the line indicating that any errors measuring density were negligible.
2. When measuring GVF in the same location, the SONAR-based gas void fraction measurement was consistent with the Coriolis-based gas void fraction measurement.
3. When measuring GVF in different locations which are in series, SONAR-based GVF measurement differed from each other as expected based on the difference in pressures in the sections resulting in different GVFs.
4. The SONAR-based Gas Void Fraction measurement of entrained air in a hydraulic fluid is a viable method that is particularly well-suited for in-situ measurements of entrained air in hydraulic fluids.
Acknowledgements
Special thanks to Ario Kordestani and Josiah Schumacher for their support with project logistics and hydraulic system design and development.
References
[1] G. E. Totten, Y. H. Sun, R. J. Bishop Jr, and X. Lin, “Hydraulic system cavitation: A review,” SAE Transactions, Vol. 107, Section 2, pp. 368–380. 1998. www.jstor.org/stable/pdf/44668176.pdf.
[2] M. S. M. Longhitano, B. S. A. Protase, and I. H. Murrenhoff, “Experimental investigation of the air release in hydraulic reservoirs,” in Proceedings of the 10th International Fluid Power Conference, Dresden, Germany, pp. 597–608. 2016. tud.qucosa.de/en/api/qucosa%3A29337/attachment/ATT-0/.
[3] I. A. Wohlers, M. E. A. Backes, and D. I. F. D. Schönfeld, “An approach to optimize the design of hydraulic reservoirs,” in Proceedings of the 10th International Fluid Power Conference, Dresden, Germany, pp. 609–618. 2016. tud.qucosa.de/en/api/qucosa%3A29338/attachment/ATT-0/.
[4] S. Gullapalli, P. Michael, J. Kensler, M. Cheekolu, R. I. Taylor, and E. Lizarraga-Garcia, “An investigation of hydraulic fluid composition and aeration in an axial piston pump,” in Fluid Power Systems Technology, American Society of Mechanical Engineers. Vol. 58332, 2017. doi:10.1115/FPMC2017-4259.
[5] K. Schrank, H. Murrenhoff. and C. Stammen, “Measurements of air absorption and air release characteristics in hydraulic oils at low pressure,” in Fluid Power Systems Technology, American Society of Mechanical Engineers. Vol. 56086, 2013. doi:10.1115/FPMC2013-4450.
[6] A. Vacca, R. Klop, and M. Ivantysynova. “A numerical approach for the evaluation of the effects of air release and vapour cavitation on effective flow rate of axial piston machines,” International Journal of Fluid Power, Vol. 11, Num. 1, pp. 33–45, 2010. journals.riverpublishers.com/index.php/IJFP/article/view/487.
[7] T. Ransegnola and A. Vacca. “Virtual design and analysis of the balancing element of an external gear machine considering cavitation and mixed lubrication effects.” International Journal of Fluid Power, Vol. 24, Num. 1, pp. 77–97, 2023. doi:10.13052/ijfp1439-9776.2414.
[8] K. Schrank, H. Murrenhoff, and C. Stammen, “Investigation of different methods to measure the entrained air content in hydraulic oils.” in Fluid Power Systems Technology. American Society of Mechanical Engineers. Vol. 45974, 2014. doi:10.1115/FPMC2014-7823.
[9] D. L. Gysling, “Accurate mass flow and density of bubbly liquids using speed of sound augmented Coriolis technology”, Journal for Flow Measurement and Instrumentation. Vol. 91, 2023. doi:10.1016/j.flowmeasinst.2023.102358.
[10] D. L. Gysling, “Clamp-on, SONAR-based volumetric flow rate and gas volume fraction measurement for industrial applications”, in Proceedings of the 13th Conference on Flow Measurement (FLOMEKO 2005), 2014. Peebles, Scotland, U.K.
[11] D. Pan, A. Vacca, V. H. B. Manne, and D. Gysling, “On the volumetric loss caused by incomplete filling with undissolved gas in positive displacement pumps: lumped parameter modeling, CFD comparisons, and experimental validations, International International Journal of Fluid Power, Vol. 26, Num. 2, pp. 129–162, 2025. doi:10.13052/ijfp1439-9776.2622.
[12] A. B. Wood, A Textbook of Sound, 3rd ed. London, UK: G. Bell & Sons; 1955.
[13] S. Temkin, Sound Propagation in Bubbly Liquids, Naval Research Laboratory Memorandum, Report 6403, 1989.
[14] K. Fu, “Direct numerical study of speed of sound in dispersed air-water two-phase Flow,” Wave Motion, Vol. 98, 2020. doi:10.1016/j.wavemoti.2020.102616.
[15] J. Hemp, and J. Kutin, “Theory of errors in Coriolis flowmeter readings due to compressibility of the fluid being metered,” Journal for Flow Measurement and Instrumentation, Vol. 17, Num. 6, pp. 359–369, 2006. doi:10.1016/j.flowmeasinst.2006.07.006.
Biographies

Brian L. Steward received the bachelor’s degree in electrical engineering from South Dakota State University in 1989, the master’s degree in electrical engineering from South Dakota State University in 1994, and the philosophy of doctorate degree in Agricultural Engineering from the University of Illinois at Urbana-Champaign in 1999, respectively. He is currently working as Professor at the Agricultural and Biosystems Engineering Department, Iowa State University. His research focuses on agricultural machinery systems including fluid power, dynamic systems, sensors, virtual design and vehicle testing.

Daniel Gysling, Ph.D., is founder and CEO of CorVera, LLC. Daniel’s technical expertise is in the areas of fluid and structural dynamics, and he has served in technical leadership roles in a variety of industries. Daniel is the primary inventor of SONAR-based flow measurement technology and holds numerous patents in the area of multiphase flow measurement.

James Oftelie received his BSME degree from Iowa State University in 1996 and MBA in 2010. After a successful Navy career, he has worked in the civilian mobile fluid power industry for 30 years beginning at Sauer Sundstrand (today’s Danfoss Power Systems), ending at Komatsu Mining in Longview TX redesigning the hydraulic systems of the super large mining wheel loaders (initially developed by Letourneau) for improved performance and efficiency. He created Aeration Measurement Technologies LLC in 2025 to develop and utilize CorVera’s aeration measurement system for mobile hydraulics, using it to directly assist hydraulic system developers on a consultant basis.
International Journal of Fluid Power, Vol. 27_2, 435–452
doi: 10.13052/ijfp1439-9776.2725
© 2026 River Publishers