An Approach for Evaluating Structure-Borne Noise Emission of Axial Piston Units Using Blocked Forces
Matthias Vogt1, 2,* and Marcus Geimer1
1Institute of Mobile Machines (Mobima), Karlsruhe Institute of Technology (KIT), Karlsruhe, Germany
2Development of Axial Piston Units, Bosch Rexroth AG, Horb am Neckar, Germany
E-mail: matthias.vogt@partner.kit.edu; marcus.geimer@kit.edu
∗Corresponding Author
Received 30 August 2025; Accepted 12 December 2025
Abstract
In the context of electrification and the development of quieter internal combustion engines, the noise generated by axial piston units is becoming more prominent. While established methods and standards exist for evaluating airborne and fluid-borne noise of hydraulic pumps, the structure-borne noise emitted by the pump and transferred to mobile machinery has rarely been investigated. A method that has gained popularity in recent applications for characterizing structure-borne noise sources is the in situ blocked force method. Blocked forces are receiver-system-independent interface quantities, allowing for a component-specific assessment of structure-borne noise. This publication introduces the fundamental approaches for determining blocked forces and presents the results of a metrological assessment of blocked forces for an axial piston pump. The findings demonstrate promising outcomes according to common validation methods for blocked forces and provide two straightforward single-valued metrics for evaluating the emitted structure-borne noise of an axial piston pump.
Keywords: Structure-borne noise, axial piston pumps, source characterization, blocked forces.
1 Introduction
The development of increasingly quieter internal combustion engines, along with the growing adoption of considerably quieter electric motors, has increased the demand for low-noise components in mobile machinery [1]. This trend presents a significant challenge for component manufacturers, but it also offers substantial potential to reduce overall noise levels of mobile machines. A key aspect in the development of low-noise mobile machinery is the ability to accurately assess and evaluate the contribution of individual noise sources.
One of the primary sources of noise in mobile machinery are axial piston units. These units are widely used due to their high power density, the adjustable displacement volume, and the achievable high pressure level [2]. The challenge in assessing the contribution of axial piston pumps to the overall noise lies in the fact that these pumps emit all three types of sound: airborne noise (ABN), fluid-borne noise (FBN), and structure-borne noise (SBN). To enable a comprehensive assessment of the acoustic behavior of a pump, all three types of noise must be evaluated separately.
Figure 1 presents a schematic illustration of the noise transfer paths within a mobile machine, assuming the axial piston pump is the sole noise source and the SBN transmitted through the tubing can be neglected. SBN vibrations that directly affect the driver, such as those transmitted through the seat, are also not considered here. The primary excitation mechanisms within an axial piston pump can be divided in a SBN excitation and a FBN excitation, often referred to as flow ripple or fluid pulsation. These excitation mechanisms lead, on the one hand, to an ABN directly emitted from the pump housing (see Figure 1) and, on the other hand, to FBN and SBN transmitted via the pump discharge port and the pump mounting to the vehicle. The following section briefly describes the most important excitation mechanisms within an axial piston pump.
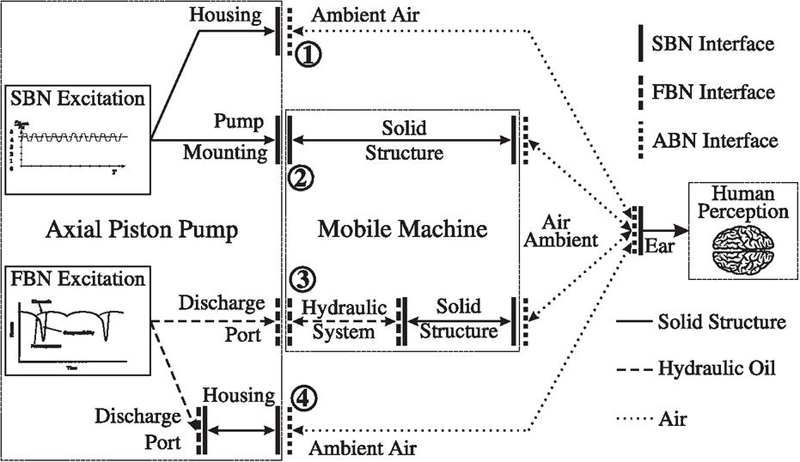
Figure 1 Noise transfer paths of a mobile machine with axial piston unit as the only source.
The FBN excitation or fluid pulsation in an axial piston pump can be divided into kinematic pulsations, due to the finite number of displacement elements, and pulsations resulting from compressibility of the hydraulic oil. This occurs during the transition of a piston from the suction port to the discharge port, when the pressure in the piston chamber differs from that in the discharge port [3, 2, 4].
Since fluid pulsation can lead to not only noise issues but also other problems within the hydraulic system, various studies have been conducted to characterize the FBN excitation of hydraulic units. The most common methods are the “High Impedance Pipe” Method [5], the “Reflectionless Termination (RaLA)” Method [3, 6], the “Secondary Source” Method [7, 8], and the “Two Pressures Two Systems” Method [9, 10]. Additionally, Kojima et al. [11] proposed a power-based method to evaluate the FBN of hydraulic pumps. Some of these methods have also been standardized in ISO 10767 [12, 13, 14, 15], enabling a comparable source characterization of hydraulic pumps with respect to FBN. Concerning the ABN caused by high-pressure pulsations in the discharge port of the pump , Haarhaus [16] demonstrated that this plays a minor role in the noise emission of axial piston pumps.
Regarding SBN excitation mechanism, previous studies [16, 17, 18, 19, 20, 21, 22] have indicated that the primary excitation is due to the axial force resulting from pressure fluctuations in the cylinder chambers of the pump’s power unit. These forces lead to two primary effects: firstly, they induce vibrations in the pump housing, causing the pump to directly radiate ABN ; secondly, the SBN is transmitted at the pump’s mounting points to the mobile working machine, thereby exciting the entire machine structure .
For the characterization of ABN radiated from the housing of hydraulic pumps and motors, a test procedure is described in the ISO 4412-1/2 standard [23, 24]. This standard defines necessary properties for the test setup to ensure comparable results that are independent of external boundary conditions.
In contrast to FBN and ABN, there is currently no standard or established method for the source characterization of hydraulic pumps with respect to SBN. Hence, this publication presents an approach that enables the evaluation of SBN based on so-called blocked forces, which provide a receiver-independent description of the source at the interface to the receiving structure. In addition to evaluating the pump, source characterization using blocked forces also enables the prediction of vehicle noise resulting from SBN excitation.
The publication is structured as follows: First, various methods of transfer path analysis are introduced, focusing on component-based transfer path analysis. Next, the application of the in situ blocked force method to an axial piston pump is presented, and two metrics for evaluating SBN are derived. Subsequently, the results of the in situ blocked force measurement and the evaluation metrics are discussed. Finally, the findings are summarized, and an outlook is provided.
2 Methods
The method used to investigate the transmission paths through which noise is transferred from a source to a receiver is referred to as Transfer Path Analysis (TPA). The description of a source using blocked forces is one method of source characterization within the framework of TPA. Therefore, an introduction to TPA will be provided in this chapter.
According to [25], a typical TPA workflow aiming to identify critical noise sources or transmission paths can be divided into four steps:
1. Operational measurement of the active component
2. Determination of the structural dynamic behavior of the passive receiver
3. Calculation of interface quantities between the source and the receiver
4. Assessment of the contribution of individual sources and paths to the overall noise
Depending on the TPA method used, only some of these steps may be performed, or they may be carried out in different order. Since this publication focuses on evaluating the SBN transmitted from an axial piston pump to a mobile working machine, the emphasis is on the third step, the calculation of interface quantites. An overview of the different TPA methods can be found in [25]. The notation and theoretical framework introduced in the following are also based on this work. In the next sections, the TPA methods most relevant to this publication will be introduced.
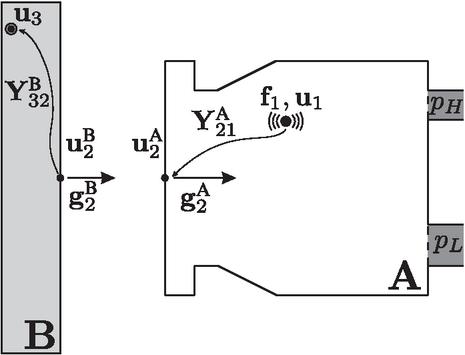
Figure 2 General transfer path problem applied to a hydraulic pump.
Figure 2 illustrates the general transfer path problem applied to hydraulic pump connected to a receiver system , such as the engine flange in a mobile working machine. In addition to the mounting points, the pump is also connected to the receiver via hydraulic hoses or pipes. These interfaces are not considered here. The system consists of three nodes: the excitation point within the source , the interface , and an arbitrary point on the receiver . The excitation at node is described by the force and the displacement quantity . As displacement quantities, accelerations, velocities and displacements can be considered, as these can be directly converted into one another. The response at the receiver point to the excitation at is denoted by . At the interface, the displacement quantities on the source and receiver sides are described by and , respectively, and the interface forces by and . At this point, it is important to note that the superscript indicates the component to which the quantity refers. Accordingly, represents a source quantity, while denotes a receiver quantity. The superscript indicates that the quantity is associated with the assembled system. The structural dynamic behavior of a node, as well as the transfer behavior between two nodes, is described using admittances . Admittance is a measure of how a structural dynamic system responds to external forces. It is defined as the ratio of the system’s vibration response to the applied excitation in the frequency domain. Since the systems under investigation are typically multi-input multi-output (MIMO) systems, forces and velocities at the nodes are described by column vectors, and the transfer behavior is represented using admittance matrices.
The described transfer path problem can be represented by the following system of equations, where the subsystem admittance matrices and are arranged in a block-diagonal format. The admittances matrices with identical indices describe the point admittances at the nodes, while those with different indices represent the transfer admittances between the nodes.
| (1) |
For an assembled system, assuming a rigid behavior of the interface, the compatibility condition and the equilibrium condition at the interface must be satisfied. The compatibility condition states that the displacement on both sides of the interface must be identical, i.e., . The equilibrium condition, which is fundamentally based on Newton’s Third Law, asserts that the interface forces on the receiver side must be equal in magnitude and opposite in direction to the forces on the source side, i.e., . By employing Equation 1 in conjunction with the compatibility and equilibrium conditions, it is possible to forecast the response at the receiver to an excitation , provided that the excitation and the admittances of the subsystems are known.
Although predicting the response at the receiver using the internal excitation, as just described, is theoretically possible, it presents certain practical issues. In particular, the internal forces are typically unknown with regard to their position, orientation, and magnitude. Consequently, it is not possible to define the transfer behavior, i.e., the admittances and . A solution to this problem is to find an alternative description of the source activity that: a) is capable of physically representing the internal forces (i.e., inducing the same vibration in the structure), b) has known positions, and c) has magnitudes that can be practically determined [26]. Such a description of the source activity can be achieved using the interface quantities at interface , which makes these interface quantities also suitable for evaluating the source with respect to SBN.
The TPA approaches presented in the following differ primarily in the interface quantities used to describe the source and how the response at the receiver can be predicted based on these interface quantities.
2.1 Classical TPA
In the first investigations in the field of TPA, the objective was to describe the source activity using the forces acting at the interface and , whereby and differ only in sign due to the equilibrium condition. From the fourth row of Equation 1, we obtain:
| (2) |
From this, it can be directly seen that the response at the receiver is determined by the interface force and the transfer behavior from the interface to the receiver point . This type of TPA is referred to as “Classical TPA”.
In practice, the transfer behavior is often determined using impact hammer or shaker measurements. When measuring , the source must be decoupled, as only the transfer behavior of the receiver itself (denoted by the superscript ) is required. This can be impractical or, depending on the connection, even impossible in practice. Furthermore the classical TPA has the fundamental drawback, that the interface forces used in this approach are influenced not only by source but also by the structural dynamic behavior of the receiver. As a result, these forces do not represent a pure source quantity, making them not transferable to other receiver systems and unsuitable for evaluating the source itself.
2.2 Component-based TPA
The limitations of classical TPA are overcome in component-based TPA (cTPA). In this approach, the source is described using receiver-independent interface quantities, which offers several advantages. Firstly, a receiver-independent source description allows the prediction of the vibration response for different receivers, assuming the transfer behaviour of the receiver can be determined. Secondly, and particularly relevant for this publication, the receiver-independent interface quantities enable the evaluation of the source itself in terms of SBN emission. Figure 3 shows an overview of the most important source characterisation methods, which are introduced in the following.
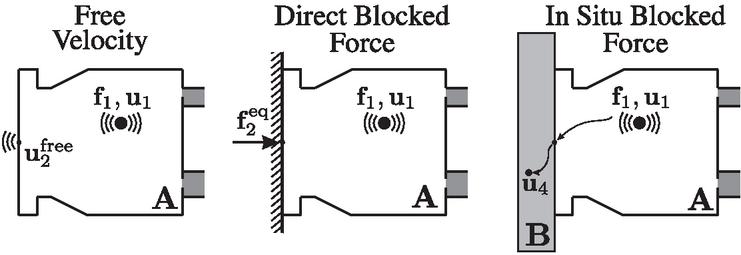
Figure 3 Source characterisation methods in cTPA.
2.2.1 Free velocity
The most obvious method to characterize a source without receiver system influence is to determine an interface quantity when the source is freely vibrating, i.e., not connected to any receiver system. In this case, the force at the interface vanishes, i.e., . The velocity at the interface is referred to as the free velocity, . Under this condition, the second row of Equation (1) becomes
| (3) |
from which it is evident that the free velocity depends solely on source quantities, thereby allowing for a description of the source excitation at the interface. Although the characterization of SBN sources using free velocities is theoretically possible, for hydraulic pumps it is impractical, as it would eliminate any means of driving the pump.
2.2.2 Direct blocked force
Another method for eliminating environmental influences is to theoretically attach the source to an infinitely stiff receiver. In this scenario, the velocity at the interface vanishes, i.e., . The force at the interface is then referred to as the blocked force (The superscript denotes “equivalent,” as the blocked forces offer an equivalent representation of the source excitation). Under these conditions, the second row of Equation 2 becomes:
| (4) | ||
From this, it can be seen that the blocked forces depend solely on the source itself, making them an appropriate interface quantity as well.
There are several methods for determining the blocked forces. The most obvious method is direct measurement using force transducers between the source and a receiver with sufficient stiffness. Nevertheless, previous studies [27, 28] have demonstrated that this method is rather impractical, as the valid frequency range is limited and proper arrangement of the force transducers is challenging.
2.2.3 In situ blocked force
Another method, first introduced by Moorhouse et al. [29], is the so-called “In Situ Blocked Force” method. This approach allows for the determination of blocked forces “in situ,” meaning in the typical installation condition of the source. This method has gained popularity in recent years, particularly in the automotive industry, leading to numerous scientific publications in this field [30, 31, 32, 33]. Additionally, the procedure for conducting an in situ blocked force measurement has been defined in the ISO 20270 standard [34] since 2019.
In [29], Moorhouse et al. demonstrated that the blocked force can be determined using the following relationship (for a detailed derivation, see [29] or [25]):
| (5) |
which states that the receiver independent blocked forces can be determined by multiplying the vibration responses at additional receivers points with the inverted transfer behavior from the interface to the indicators in the coupled state (denoted by the superscript ). Since the additional receiver points are not used as target quantities for purposes such as predictions, but rather for determining the blocked forces, they are usually referred to as indicators. From Equation 5, it follows that the measurement process for determining the blocked forces consists of two steps.
In the first step, the admittance matrix from the interface to the indicators for the assembled system is determined. For this purpose, the structure is excited close to the interface using an impulse hammer or shaker, and the response at the indicators is measured using accelerometers. In the second step, the response at the indicators is measured while the source is operating, with the accelerometers remaining at the same locations as during the impulse hammer measurement. The blocked forces are then determined via Equation 5 at the positions where the excitation was applied in the first step using the impulse hammer. By following these steps, the source and receiver do not need to be separated at any stage of the measurement process. This allows the blocked forces to be determined in the coupled state (in situ).
Additionally the in situ blocked force relationship from Equation 5 not only allows for the determination of blocked forces but also opens up possibilities for Virtual Acoustic Prototyping (VAP). Since the blocked forces are independent of the receiver system, they can be combined with any arbitrary receiver. More specifically, once a source is characterized by blocked forces, it can be virtually combined with various receiver systems to simulate the resulting noise for those receivers. This opens up possibilities such as the virtual investigation of how noise mitigation measures, tested on the test bench, affect the noise in a mobile working machine. The transfer behavior required for this purpose can be determined either through an initial measurement in the vehicle or by employing dynamic substructuring approaches.
2.3 Quality Criteria In Situ Blocked Force Method
The quality of the results when determining the blocked forces using the in situ method can be evaluated using various criteria. A fundamental prerequisite for achieving satisfactory results according to these quality criteria is that the transfer admittance can be determined with sufficient accuracy. There are specific quality criteria for this, which will not be discussed here, as they are general criteria for the experimental determination of transfer functions, as elaborated upon in [26].
In the following, the criteria of On-Board Validation and Transferability, which are specifically suitable for the in situ blocked force method, are introduced.
2.3.1 On-Board Validation
The most straightforward and particularly easy-to-apply method for in situ determination of blocked forces is the On-Board Validation (OBV). In this approach, the blocked forces, determined using indicators in conjunction with Equation 5, are used to make a prediction for the receiver points :
| (6) |
The required transfer admittance and vibration response are typically obtained simultaneously with the determination of and , making it an easy-to-apply method. To evaluate the source description via blocked forces, the predicted vibrations at the receiver points are compared with the directly measured ones. The OBV method can be particularly useful for assessing whether the number of interface degrees of freedom (DoF), and thus the number of blocked forces, is suitable to accurately describe the source. Additionally, OBV can help identify errors or issues in the inversion of the admittance matrix .
Besides OBV during the operation of the source, an OBV for so-called artificial excitations is typically conducted. In this case, the source itself is not in operation, and artificial excitations are applied to the source using an impact hammer or shaker. This approach offers the advantage that the artificial excitations provide a broad-band excitation and do not contain complex features like the operational response, which can complicate the inspection of agreement [26]. Consequently, the description of the interface can be evaluated more easily.
2.3.2 Transferability
As mentioned, OBV is a straightforward method for evaluating blocked forces. However, a good result in OBV is a necessary but not a sufficient condition. While OBV can assess the description of the interface and the matrix inversion, it does not verify whether the blocked forces are independent of the receiver system, which is a fundamental requirement for a reasonable source description in cTPA. To evaluate this, the concept of transferability is used, which examines whether the determined blocked forces can be transferred to another receiving system. For this purpose, the blocked forces are determined for an identical source excitation in two different assemblies AB and AC. If the condition of receiver independence is satisfied, the response at the receiver points of assembly AC can be predicted using the blocked forces determined in assembly AB. Or mathematically expressed:
| (7) |
It should be noted that deviations can arise not only due to nonlinearities, insufficient interface description, or numerical errors but also from variations in the excitation mechanism. Because of this, it is crucial to ensure that the operating conditions are as similar as possible in both operational tests. For hydraulic pumps, this particularly includes pressure and rotational speed. Additionally, the passive properties on the source side, such as the hosing, should be as identical as possible for both systems.
2.4 Virtual Point Transformation
For a comprehensive description of SBN sources, multiple frequency-dependent blocked forces in various spatial directions are typically necessary. The number and direction of the blocked forces are determined by the number and position of the excitation points during the impact hammer measurement. These must be chosen such that the source excitation for the frequency range of interest can be adequately described by the blocked forces. Since the in situ blocked force method involves impact hammer measurements in the assembled state, the excitation points are usually distributed around the interface on the receiver side, and thus the positioning of the excitation points depends on the geometry of the receiver. However, a receiver-independent source description should be achieved through interface quantities clearly defined by the source. One possibility of converting the interface quantities determined in the TPA into such quantities is the Virtual Point Transformation (VPT). In the following, the VPT method will be introduced in a manner similar to that in [35].
The concept of Virtual Point Transformation (VPT), introduced by van der Seijs et al. [36], originates from the field of dynamic substructuring, where a precise definition of interfaces between subsystems is essential. VPT aims to map interface quantities (interface DoF) onto a set of interface displacement modes (IDMs) that offer a precise interface description. When IDMs correspond to the six DoF (3 translational and 3 rotational) of a virtual point (VP), they are also known as rigid interface modes or virtual point DoF. This projection of interface quantities onto VPs allows for a clear definition of an interface, even at locations that are not directly accessible, such as with an impact hammer or accelerometer. Typically, physically significant points, like joint points or bolting points, are chosen as VPs.
The projection of interface quantities onto VP DoF can be accomplished using IDM matrices and , which contain the spatial position and orientation of velocities () and forces () relative to the VPs. For a comprehensive explanation of the construction of IDM matrices, see [36, 27].
For a single VP, the projection of velocities onto the VP can be described by the following equation:
| (8) |
where includes the three translational and three rotational velocities of the VP. The term represents the residuals, i.e., the motion that cannot be captured by the virtual point. These are typically flexible interface modes that cannot be represented as the VPT assumes a rigid interface behavior.
Similar to the interface velocities, the projection of the forces onto the VP forces and torques can be achieved as follows:
| (9) |
where includes the three forces and torques at the VP. Note that Equation 9 requires no residual term , as the virtual loads are, in fact, a direct result of the applied forces [27].
Using VPT, the blocked forces can be transformed to one or more virtual points, enabling the representation of the source at technically meaningful locations. Additionally, it simplifies the integration of blocked forces into structural dynamic models and allows the application of blocked forces from various sources to a machine structure.
It is important to note that the application of the VPT, more specifically the definition of the IDM matrices and , requires precise knowledge of the position and orientation of the excitation points. Depending on the specific use case, this information may not always be available, as it often relies on the existence of a geometric model of the receiving structure.
2.5 In Situ Blocked Force Determination for An Axial Piston Pump
As with many SBN sources, the in situ method is considered the most suitable source characterization method for hydraulic pumps. The determination of free velocities and the direct measurement of blocked forces are less suitable due to the aforementioned practical reasons.
In the case of the axial piston pump examined in this section, the blocked forces were not determined in a typical application, such as a mobile machine; instead, a test bench was specifically developed for this purpose, which offers the several advantages. The main benefit, besides the measurement under controlled laboratory conditions, is primarily the accessibility of the interface. The receiver can be designed in such a way that the interface, or the area around the interface, can be easily excited with an impact hammer or a shaker. This is often not possible in a mobile machine with limited space. Once a test bench for the in situ method is developed, the blocked forces for any operating point of the pump can be determined under controlled test conditions.
Figure 4 presents a schematic illustration of the experimental setup and the interface of the axial piston pump that was investigated in this study. The pump features a two-bolt mounting flange according to DIN ISO 3019-1 [37] and is is typically used in 6-ton mini excavators.
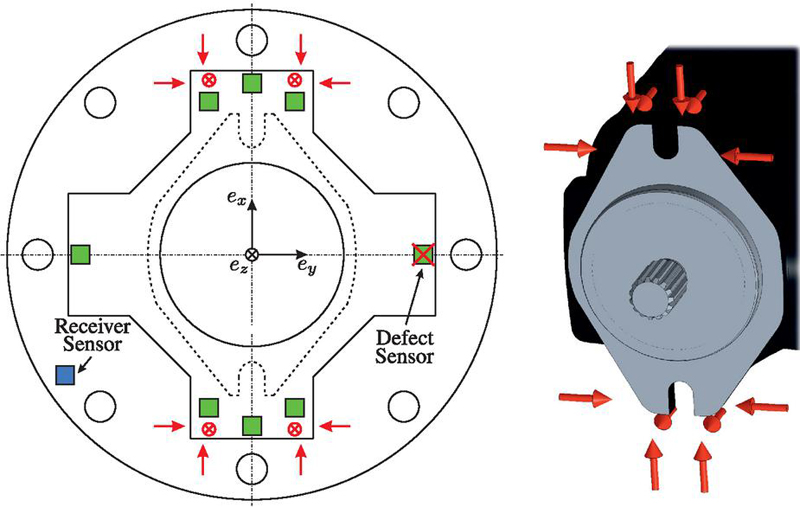
Figure 4 Schematic illustration of the test setup for the in situ blocked force TPA of an Axial Piston Pump.
In the measurement setup, the triaxial acceleration sensors used as indicators for determining the blocked forces are shown as green squares, while the receiver sensor is depicted as a blue square. The indicators can theoretically be positioned anywhere downstream of the interface on the receiver. However, as illustrated in the figure, they are typically placed in close proximity to the interface to ensure a high signal-to-noise ratio (SNR) and to minimize error sources such as nonlinearities along the transmission path. Unfortunately, it was discovered after the measurements that the right-hand indicator was damaged, so only seven indicators were used to determine the blocked forces.
The excitation points for the impact hammer are indicated by red arrows. Since, in an in situ TPA, the source and the receiver are coupled in every state of the procedure, the excitation with the hammer cannot be applied directly at the interface but only in its vicinity. Therefore, the excitation points are arranged around the interface. For the investigated pump, six impact locations are arranged around each of the two mounting points, based on the assumption that the excitation from the source is primarily transmitted to the receiver through these mounting points. To excite all interface DoF, impacts are applied both in the normal and in-plane directions. A major advantage of the in-situ blocked force method is that the calculated blocked forces are independent of the receiver behavior. Accordingly, the receiver can be selected such that all DoF can be well excited with the impact hammer. Although the positions of the excitation points then depend on the receiver geometry, this dependency can be resolved later through a VPT.
It should be noted that receiver independence only applies if the internal excitation mechanism of the source is not influenced by the receiver. Since, in an axial piston pump, the main SBN excitation is caused by pressure fluctuations within the hydraulic unit, and these are not directly affected by the external motion of the pump, this condition is assumed to be fulfilled.
In the described measurement setup, twelve blocked forces are determined using 21 indicator signals (seven triaxial accelerometers). Consequently, the admittance matrix is not square but nearly twice overdetermined, and the standard matrix inversion in Equation 5 is replaced by the pseudoinverse . Overdetermination of the admittance matrix is also recommended in ISO 20270-1:2019, as the matrix inversion then becomes a least-squares optimization, which reduces the influence of measurement errors and noise (for a detailed explanation, see [26]).
2.6 Evaluation of Structure Borne Noise Emission of Axial Piston Pumps
In the previous section, the procedure and setup for determining the blocked forces of an axial piston pump was explained. The following introduces an approach for evaluating an axial piston pump’s SBN emission based on the blocked forces.
The characterization of SBN sources has been a subject of investigation for many years. The Technical Committee on Acoustics TC43 of the International Organization for Standardization (ISO) has defined four requirements in [38, 26] that should be met by a characterization method:
1. Comparison of SBN emissions of similar machines
2. Examination of compliance with limit values
3. Determination of input data for acoustic planning (e.g. prediction of sound levels when installed)
4. Collection of necessary data for the development of quiet machines
In addition to the listed requirements, the Committee also proposed various characterization methods. These methods, along with many subsequently developed approaches such as the Source Descriptor method [39] and the Characteristic Power method [40], aim to fulfil the aforementioned requirements using one or two frequency-dependent single-valued parameters. In these approaches objective is to facilitate a straightforward characterization of the source, analogous to the use of sound power in the characterization of ABN.
However, it has been demonstrated that, unlike ABN, a complete characterization of SBN sources using one or two frequency-dependent single-valued parameters is hardly feasible. This is due to the significantly different nature of SBN (for a detailed explanation, see [26]). To specifically address the third requirement, which is the prediction of noise levels when the source is installed, the mentioned single-value-based methods are rather inadequate, particularly when an accurate prediction is required. Consequently, new approaches such as the in situ blocked force method have been developed in recent years [26]. These methods provide a more comprehensive description of the source, thereby enabling advanced concepts like cTPA and VAP, which are particularly relevant in later stages of development when specific applications for the source are known or for root cause analysis in a vehicle exhibiting poor noise performance.
However, in an early stage of hydraulic pump development, these concepts are of less interest. This is primarily due to the wide range of applications for a hydraulic pump, which vary significantly in their dimensions and acoustic properties. At an early stage of pump development, it is particularly important to investigate the effectiveness of measures, compare different pump designs, and identify critical operating points (1st and 4th requirement for a source characterization method). For this purpose, a straightforward evaluation method is needed, which may not provide a complete source description but offers a simple assessment that is independent of a receiving system.
2.6.1 Vector norm of the resultant blocked forces vector
There are various methods [40, 41, 42] to combine interface quantities such as blocked forces. One straightforward method is calculating the vector norm of the resultant blocked forces vector. In the first step, all blocked forces are combined into three resultant blocked forces , one for each coordinate direction. These forces are equivalent to the three translational forces at the virtual point when all twelve blocked forces are consolidated into one virtual point using VPT (see Figure 5). However, the entire IDM matrix is not required for this consolidation; only the part corresponding to the translational DoF is needed. Consequently, the exact position of the blocked forces is not necessary, only their spatial orientation. This can be advantageous, as it eliminates the need for an accurate geometric model of the receiving structure in many practical applications.
In the second step, the vector norm of the resultant blocked forces vector is calculated as follows:
| (10) |
yielding a single-valued, frequency-dependent force quantity. This combination using the vector norm results in the loss of phase information, rendering the metric is unsuitable for cTPA and VAP.
The vector norm of the resulting blocked force vector represents a straightforward evaluation metric, as only the magnitude and phase of the blocked forces and their spatial orientation need to be known, but not their exact position. However, this method disregards the rotational DoF at the interface, namely the torques. This is comparable to mounting the pump to the receiver using a ball joint. This is evidently a significant simplification, and studies on other systems have demonstrated that this can result in errors, especially at higher frequencies [43].
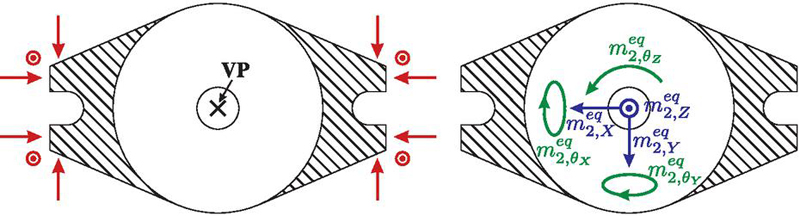
Figure 5 Aggregation of the blocked forces into virtual point quantities. Left: original orientation of the blocked forces, right: forces and torques at the virtual point.
2.6.2 Vector norm of the resultant blocked torques vector
Just as the translational DoF can be consolidated into an evaluation metric using the vector norm, the rotational DoF of the virtual point can also be combined in a similar manner. This metric can be referred to as the vector norm of the resultant blocked torques vector and can be calculated as follows:
| (11) |
Unlike the evaluation metric for the translational DoF, this metric requires not only the orientation but also the exact position of the blocked forces relative to the virtual point. For the axial piston pump under investigation, the virtual point was defined at the intersection of the shaft axis with the interface plane (shaded area in Figure 5).
Since this evaluation metric only considers the rotational DoF, this is equivalent to connecting the pump via a joint that only suppresses rotational DoF, which certainly does not reflect reality and thus also represents a simplification. Therefore, the goal would be to combine both evaluation metrics to represent a fixed mounting of the pump. However, this presents a fundamental problem, as the resultant force evaluation metric and the resultant torque metric cannot be directly combined, as they describe physically different quantities. One possible approach is to use a power metric, where forces and torques are combined with velocities and angular velocities to calculate power quantities that can be aggregated [40, 44]. However, this approach requires the determination of additional quantities, such as the point mobility of the source , which was not conducted within the scope of this study but represents a promising approach for future research.
3 Results
In this chapter, the first part presents the results of the in situ blocked force measurement for the axial piston pump described above and evaluates them using the introduced quality criteria. The second part demonstrates the behavior of the introduced evaluation metrics for two characteristic operating points of the pump.
3.1 Results In Situ Blocked Force Determination
To determine the transfer function of the admittance matrix—also known as the Frequency Response Functions (FRFs)—the directly measured acceleration signal was used. Accordingly, the FRFs are represented by the so-called accelerance, which describes the ratio of acceleration to force.
Figure 6 shows the result of the OBV for an artificial excitation using an impulse hammer impact on the pump housing. Specifically, the vector norm of the acceleration s from all three measurement channels of the triaxial receiver sensor (see Figure 4) is depicted. The vector norm is shown here as it integrates the responses across all three spatial axes, thereby providing a comprehensive measure of the total sensor response. This also simplifies data interpretation, as it consolidates the triaxial measurements into a single representative parameter. The vertical axis represents the acceleration in decibels (dB), with a reference value of . This reference value is uniformly used in all subsequent figures where the acceleration in dB is shown.
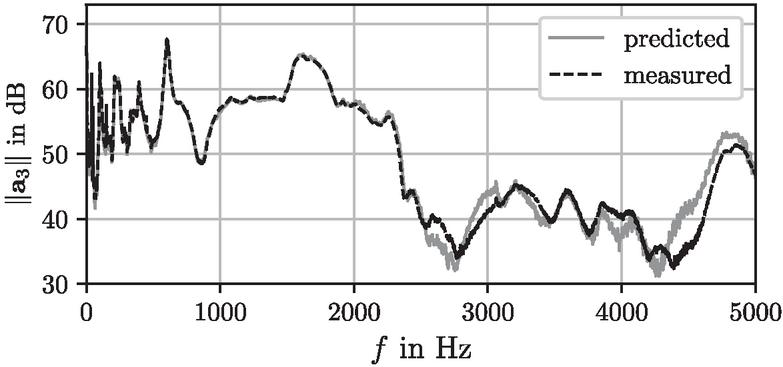
Figure 6 Result OBV for an artificial excitation.
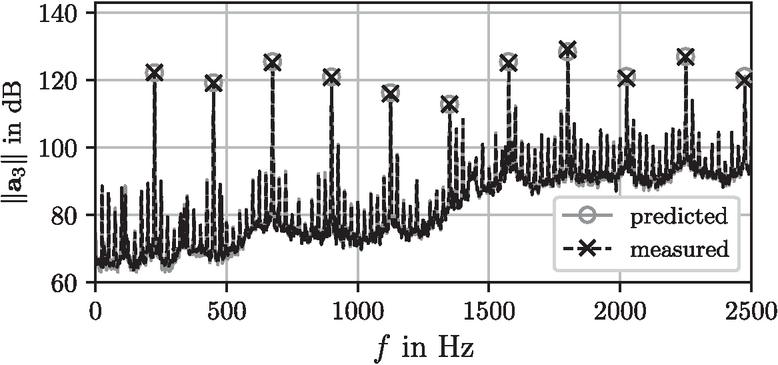
Figure 7 Result OBV for the the stationary operating point: , , .
It can be observed that for the frequency range , the prediction and measurement of the signal at the receiver point match very well. Beyond 2500 Hz, the signal becomes significantly noisier, indicating a poorer SNR. This can be attributed to the decreasing frequency response of the impulse hammer with a plastic tip at higher frequencies. This outcome indicates that, in further analysis, good results can only be expected for the frequency range of . Therefore, this frequency range will be examined in more detail in the following.
Figure 7 shows the OBV for a stationary operating point with , , and for a frequency range up to 2500 Hz. The resulting acceleration signal at the receiver sensor is typical for the noise signature of an axial piston pump. Axial piston pumps exhibit a tonal excitation characterized by significant peaks at the harmonics of the piston frequency. For the operating point considered, the first harmonic, due to the nine pistons, is at 225 Hz, with higher harmonics occurring at multiples of this frequency. The maximum value at the peaks is marked with a cross for the measured signal and with a circle for the predicted signal. As can be seen, the prediction and the measurement at the peaks agree very well, indicating that the blocked forces can accurately describe the SBN emitted by the pump also during operation.
As explained in the section on OBV, the result demonstrates that a set of twelve blocked forces is suitable for describing the source. However, what the OBV cannot yet demonstrate is whether the determined blocked forces are independent of the receiver system. To address this, the next step involves investigating the transferability of the blocked forces. For this purpose, the blocked forces determined in system AB are applied to another system AC. To ensure a valid transferability check, systems AB and AC must differ in their structural dynamic behavior. For the axial piston pump under investigation, the behavior of the receiver was influenced by varying the number of mounting screws on the receiver flange. The extent to which the admittance matrices and differ can be estimated by the mean magnitude difference of the indicator FRFs, as shown in Figure 8. The plot illustrates the percentage difference between the mean magnitude of all FRFs in system AB and those in system AC, relative to the values from system AB, as a function of frequency.
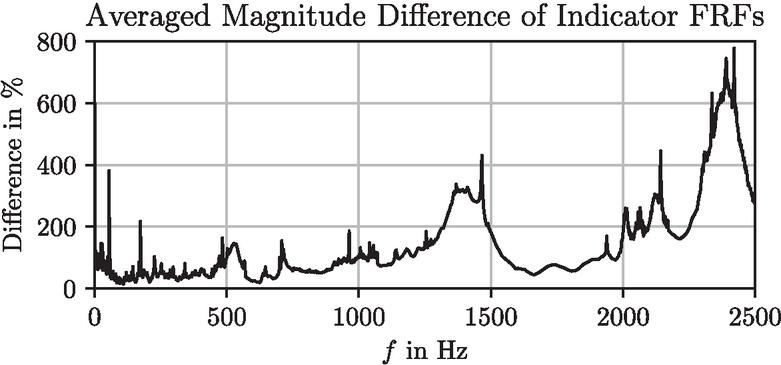
Figure 8 Averaged magnitude difference of the indicator FRFs of System AB and AC.
From the plot, it can be observed that the deviation is relatively small for the frequency range . It is only at frequencies above 450 Hz that the dynamic behaviour of the structure can be expected to be significantly affected, making the investigation of transferability only meaningful beyond this frequency.
Knowing this, the transferability validation can be performed in the next step. Figure 9 compares the receiver acceleration measured in system with the prediction based on the blocked forces and the transfer behavior for the same operating conditions. The insights from Figure 8 can also be observed when comparing Figure 7 and 9. While the peak values at the harmonics for frequencies up to 1000 Hz are nearly identical in Figures 7 and 9, they diverge more significantly at higher frequencies.
Examining the transferability check, it is evident that the measured and predicted accelerations align well for , with greater deviations occurring beyond this point. These discrepancies can be attributed to various factors, such as measurement errors during the impulse hammer test, numerical errors, or nonlinearities. It is also important to note that, unlike the OBV, the transferability check pertains to the same operating point but not exactly the same operational measurement. Consequently, differences in operating conditions, such as variations in oil temperature or air content in the oil, can also influence the results.
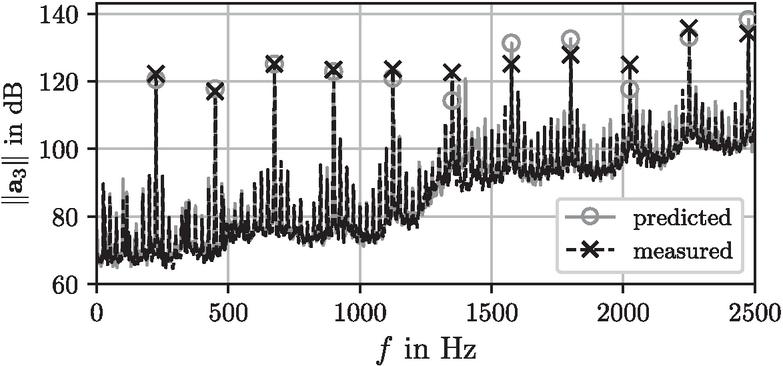
Figure 9 Result Transferability for the stationary operating point: , , .
3.2 Results Evaluation Metrics
As the results of the in situ measurements demonstrate, the SBN excitation by an axial piston pump can be described using twelve blocked forces. Using these blocked forces, the evaluation metrics introduced in the previous chapter can be computed. Figures 10 and 11 illustrate the behavior of the force based evaluation metric for maximum and minimum displacement volumes (: minimum displacement to maintain the target pressure), with values obtained from both system AB and system AC. Since this evaluation metric is force based, it has the unit Newton. For the determination of the decibel value, a reference value of is used.
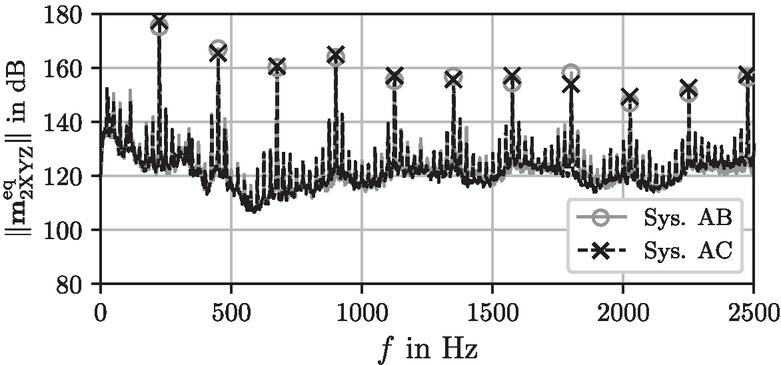
Figure 10 Evaluation quantity for the operating point: , , .
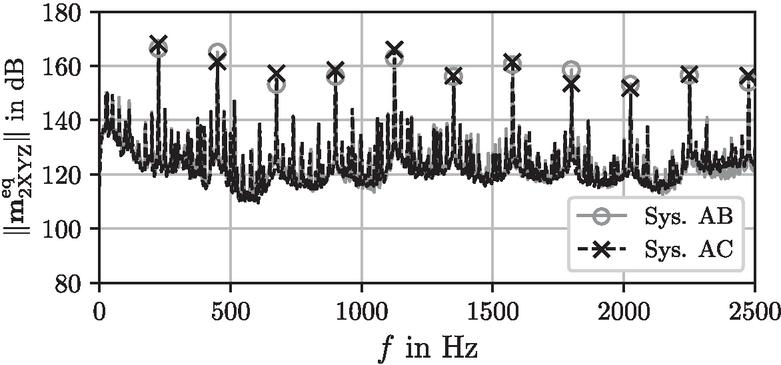
Figure 11 Evaluation quantity for the operating point: , , .
When analyzing Figure 10, it is noticeable that the qualitative behavior of the evaluation metric significantly differs from that of the acceleration at the receiver points in Figures 7 and 9. This difference is primarily due to the rigid test setup, which causes the receiver sensors to experience stronger vibrations only at higher frequencies. Instead, Figure 10 clearly shows that the SBN excitation at this operating point is mainly dominated by the first harmonic, with the influence of higher harmonics generally decreasing. Comparable values of the evaluation metric are obtained for both systems AB and AC, confirming the independence from the receiver system.
Figure 11 shows the evaluation metric for the operating point with the same rotational speed and pressure but with minimal displacement volume. As can be seen, the spectrum does not fundamentally change due to the same rotational speed; however, the quantitative values of some harmonics in Figures 10 and 11 differ significantly. While the evaluation metric for maximum displacement is clearly dominated by the first harmonic, the peaks at minimum displacement are at a similar level over a broader frequency range. The evaluation metric for both systems also aligns well for this operating point.
Figures 12 and 13 illustrate the behavior of the torque-based evaluation metric for identical operating points. The reference value used to establish the dB scale is . Consequently, these two figures are not quantitatively comparable to those of the force-based evaluation metric.
As expected, the harmonics of the pump are also clearly noticeable for this metric, and the alignment of the peaks at the harmonics is satisfactory for both systems AB and AC. Unlike the force-based evaluation metric, the behavior for maximum displacement volume and minimum displacement volume are very similar for this metric. The second harmonic is dominant for both operating points, with a value slightly below 160 dB. For higher harmonics, the amplitudes decrease significantly, with the seventh harmonic exhibiting a slightly higher value.
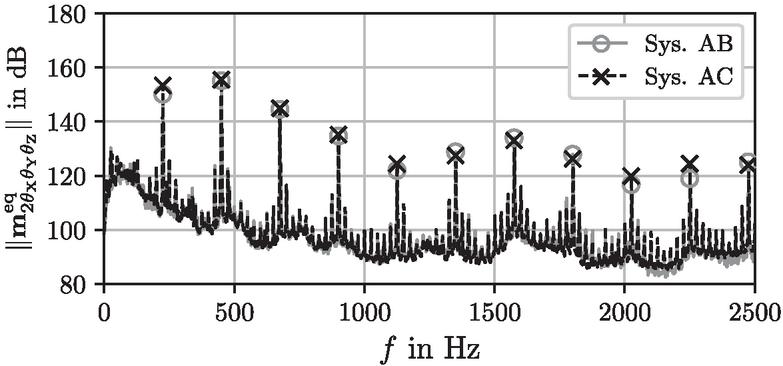
Figure 12 Evaluation quantity for the operating point: , , .
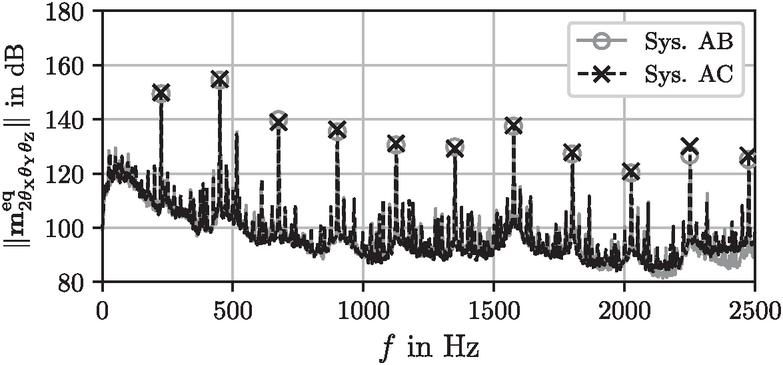
Figure 13 Evaluation quantity for the operating point: , , .
4 Discussion
The presented results demonstrate that the in situ blocked force method is suitable for determining the blocked forces of an axial piston pump. According to the OBV results, the pump can be characterized using 12 blocked forces within a frequency range of . However, the analysis of transferability indicates that these forces can only be transferred to another receiver system up to a frequency of approximately . This limitation could be attributed not only to insufficient source characterization but also to measurement errors or variations in the operational measurement.
Given that the frequency range up to approximately 5000 Hz is particularly relevant for the acoustics of axial piston pumps [45], the procedure for determining the blocked forces must be further optimized to enable source characterization within this frequency range. To achieve this, sufficient energy must be introduced into the system across the entire frequency range of interest during the FRF measurement. This can be accomplished by using different impact hammer tips or a shaker. Additionally, an investigation of the required interface DoF could help analyze whether the twelve blocked forces used are adequate for characterizing the axial piston pump.
The introduced single-valued evaluation metrics significantly simplify the source description using twelve blocked forces. However, it facilitates a straightforward evaluation of the SBN emission. This indicates that a straightforward assessment and comprehensive source description always represent a trade-off between simplicity and accuracy. While the comprehensive description is particularly suitable for making predictions, such as for VAP, the SBN analysis using the introduced metrics offers a straightforward tool to evaluate various operating points or optimization measures.
The suitability of these evaluation metrics for assessing the SBN emission of axial piston pumps remains to be ascertained, as it necessitates validation through additional measurements. In particular, it is essential to investigate which of the two metrics is better suited for evaluating axial piston pumps in terms of SBN. This implies the question of whether the translational or rotational DoF at the interface are more relevant. Nevertheless, both metrics represent initial approaches to evaluating the emitted SBN independently of a receiver system and provide a foundation for further investigations.
5 Conclusion and Outlook
To meet increasing noise requirements for mobile machinery, it is crucial to evaluate the acoustic behavior of axial piston pumps. Unlike ABN and FBN, no established method exists for assessing SBN emissions from hydraulic pumps. Therefore, two single-valued evaluation metrics have been introduced, which are based on a comprehensive source description using blocked forces and thus enabling a straightforward assessment of the pump’s SBN characteristics.
As the investigation shows, the in situ blocked force method enables comprehensive source characterization of axial piston pumps with respect to SBN within a certain frequency range. To further improve accuracy and extend the valid frequency range, the blocked force determination procedure must be further optimized. This particularly requires improvements in the measurement procedure. The single-valued evaluation metrics derived from the source description using blocked forces represent a significant simplification of the source characterization. However, these metrics enable a straightforward comparison of operating points and mitigation measures, which is essential in early stage pump development.
Future research should focus on determining which of the two metrics is better suited for evaluating the SBN emissions of axial piston pumps. Additionally, the two metrics should be compared with advanced methods, such as power-based approaches, which have the advantage of combining both rotational and translational quantities into a single evaluation metric.
Acknowledgements
Acknowledgements are given to Bosch Rexroth AG for the financial support and the provision of the acoustic test bench, as well as to the Bosch Sound Propagation expert team for their technical and professional support.
References
[1] T. Pietrzyk, M. Georgi, S. Schlittmeier, and K. Schmitz. Psychoacoustic Evaluation of Hydraulic Pumps. Sustainability, 13(13):7320, June 2021.
[2] T. Nafz. Aktive Ventilumsteuerung von Axialkolbenpumpen zur Geräuschreduktion hydraulischer Anlagen. PhD thesis, RWTH Aachen, Aachen, 2011. ISBN 978-3-8440-0511-0.
[3] H. Theissen. Volumenstrompulsation von Kolbenpumpen. O+P Ölhydraulik und Pneumatik, 24, 1980.
[4] U. Bittner. Strukturakustische Optimierung von Axialkolbeneinheiten: Modellbildung, Validierung und Topologieoptimierung. PhD thesis, Karlsruher Institut für Technologie, Karlsruhe, 2013. ISBN 978-3-86644-938-1.
[5] D. E. Bowns, K. A. Edge, and D. G. Tilley. The Assessment of Pump Fluid Borne Noise. In Proceedings of I. Mech. E. Conf.-Quiet Oil Hydraulic Systems, London, England, 1977.
[6] P. Larsson, J. Palmberg, and K. Weddfelt. Analysis and measurement of pressure ripple of fluid power pumps. In Proceedings of Eighth IASTED International Symposium on Measurement, Signal Processing and control, Taormina, Italy, 1986.
[7] K. A. Edge and D. N. Johnston. The ‘Secondary Source’ Method for the Measurement of Pump Pressure Ripple Characteristics Part 1: Description of Method. Proceedings of the Institution of Mechanical Engineers, Part A: Journal of Power and Energy, 204(1):33–40, February 1990.
[8] K. A. Edge. The ‘Secondary Source’ Method for the Measurement of Pump Pressure Ripple Characteristics Part 2: Experimental Results. Proceedings of the Institution of Mechanical Engineers, Part A: Journal of Power and Energy, 204(1):41–46, February 1990.
[9] K. Weddfelt. Measurement of pump source characteristics by the two-microphone method. In Proceedings of The Second Tampere International Conference on Fluid Power, Tampere, Finland, 1991.
[10] E. Kojima. A new method for the experimental determination of pump fluid-borne noise characteristics. In Proceedings of 5th Bath International Fluid Power Workshop, Circuit, Component and System Design, pages 111–135, Bath, England, 1992.
[11] Eiichi Kojima, Toru Yamazaki, and Kevin Edge. Development of Standard Testing Procedure for Experimentally Determining Inherent Source Pulsation Power Generated by Hydraulic Pump. International Journal of Fluid Power, 10(1):27–35, January 2009. Publisher: River Publishers.
[12] International Organization for Standardization. ISO 10767-1:1996 Hydraulic fluid power – Determination of pressure ripple levels generated in systems and components – Part 1: Precision method for pumps, 1996.
[13] International Organization for Standardization. ISO 10767-2:1999 Hydraulic fluid power – Determination of pressure ripple levels generated in systems and components – Part 2: Simplified method for pumps, 1999.
[14] International Organization for Standardization. ISO 10767-3:1999 Hydraulic fluid power – Determination of pressure ripple levels generated in systems and components – Part 3: Method for motors, 1999.
[15] International Organization for Standardization. ISO 10767-1:2015 Hydraulic fluid power – Determination of pressure ripple levels generated in systems and components – Part 1: Method for determining source flow ripple and source impedance of pumps, 2015.
[16] M. Haarhaus. Geräuschentstehung und Geräuschminderung bei Axialkolbenpumpen in Schrägscheibenbauweise. PhD thesis, RWTH Aachen, Aachen, 1984.
[17] M. Bergemann. Systematische Untersuchung des Geräuschverhaltens von Kolbenpumpen mit ungerader und mit gerader Kolbenanzahl. PhD thesis, RWTH Aachen, Aachen, 1994. ISBN 978-3-930085-23-1.
[18] M. Pettersson. Design of fluid power piston pumps: with special reference to noise reduction. PhD thesis, Linköping University, Linköping, 1995. ISBN 978-91-7871-592-3.
[19] B. Müller. Einsatz der Simulation zur Pulsations- und Geräuschminderung hydraulischer Anlagen. PhD thesis, RWTH Aachen, Aachen, 2002. ISBN 978-3-8322-0793-9.
[20] Ganesh Kumar Seeniraj, Minming Zhao, and Monika Ivantysynova. Effect of Combining Precompression Grooves, PCFV And DCFV on Pump Noise Generation. International Journal of Fluid Power, 12(3):53–63, January 2011. Publisher: River Publishers.
[21] Ganesh Kumar Seeniraj and Monika Ivantysynova. A Multi-Parameter Multi-Objective Approach to Reduce Pump Noise Generation. International Journal of Fluid Power, 12(1):7–17, January 2011. Publisher: River Publishers.
[22] Richard Klop and Monika Ivantysynova. Investigation of Noise Sources on a Series Hybrid Transmission. International Journal of Fluid Power, 12(3):17–30, January 2011. Publisher: River Publishers.
[23] International Organization for Standardization. ISO 4412-1:1991 Hydraulic fluid power – Test code for determination of airborne noise Ieveis – Part 1: Pumps, 1991.
[24] International Organization for Standardization. ISO 4412-2:1991 Hydraulic fluid power – Test code for determination of airborne noise Ieveis – Part 2: Motors, 1991.
[25] M. V. van der Seijs, D. de Klerk, and D. J. Rixen. General framework for transfer path analysis: History, theory and classification of techniques. Mechanical Systems and Signal Processing, 68-69:217–244, February 2016.
[26] J. W. R. Meggitt. An introduction to the in-situ blocked force method for vibration source characterisation. Technical report, Acoustics Research Centre – University of Salford, 2022.
[27] M. V. van der Seijs. Experimental Dynamic Substructuring: Analysis and Design Strategies for Vehicle Development. PhD thesis, Delft University of Technology, 2016.
[28] M. V. van der Seijs, E. Pasma, D. de Klerk, and D. J. Rixen. A robust Transfer Path Analysis method for steering gear vibrations on a test bench. In Proceedings of ISMA 2014, Leuven, Belgium, 2014.
[29] A. T. Moorhouse, A. S. Elliott, and T. A. Evans. In situ measurement of the blocked force of structure-borne sound sources. Journal of Sound and Vibration, 325(4-5):679–685, September 2009.
[30] C. L. Balogh, T. Kimpián, and T. Ungvári. An Examination of Component-Based TPA Performance and Feasibility for Steering Motors. Journal of Physics: Conference Series, 2677(1):012011, December 2023.
[31] M. van der Kooij, S. W. B. Klaassen, and A. Huelsmann. Using Dynamic Substructuring and Component TPA to Shape the NVH Experience of a Full-Electric Vehicle. In Proceedings of 12th International Styrian Noise, Vibration & Harshness Congress: The European Automotive Noise Conference, pages 2022–01–0988, Graz, Austria, June 2022.
[32] P. Wagner, F. Bianciardi, P. Corbeels, and A. Huelsmann. High frequency source characterization of an e-motor using component-based TPA. In Proceedings of SIA NVH Comfort 2021, Le Mans, France, 2021.
[33] M. Burkhardt, E. Hensel, and W. Drossel. Messdatenbasierte Charakterisierung von Körperschallquellen in sechs Freiheitsgraden. In Proceedings of DAGA 2020 – 46. Jahrestagung für Akustik, Hannover, Germany, 2020.
[34] International Organization for Standardization. ISO 20270-1:2019 Acoustics — Characterization of sources of structure-borne sound and vibration — Indirect measurement of blocked forces, 2019.
[35] Matthias Vogt and Marcus Geimer. Comparison of different approaches for Evaluating Structure-Borne Noise Emission of Axial Piston Units. In Proceedings of DAGA 2025 (Deutsche Jahrestagung für Akustik), Copenhagen, Denmark, 2025.
[36] M. van der Seijs, D. van den Bosch, D. Rixen, and D. de Klerk. An improved methodology for the virtual point transformation of measured frequency response functions in dynamic substructuring. In Proceedings of COMPDYN 2013, pages 4334–4347, Kos Island, Greece, 2014.
[37] International Organization for Standardization. ISO 3019-1:2001 Hydraulic fluid power – Dimensions and identification code for mounting flanges and shaft ends of displacement pumps and motors – Part 1: Inch series shown in metric units, 2001.
[38] T. ten Wolde and G. Gadefelt. Development of Standard Measurement Methods for Structureborne Sound Emission. Noise Control Engineering Journal, 28(1):5, 1987.
[39] J. M. Mondot and B. Petersson. Characterization of structure-borne sound sources: The source descriptor and the coupling function. Journal of Sound and Vibration, 114(3):507–518, May 1987.
[40] A. T. Moorhouse. On the characteristic power of structure-borne sound sources. Journal of Sound and Vibration, 248(3):441–459, November 2001.
[41] B. M. Gibbs, N. Qi, and A. T. Moorhouse. A Practical Characterisation for Vibro-Acoustic Sources in Buildings. Acta Acustica united with Acustica, 93(1):84–93, 2007.
[42] M. M. Späh and B. M. Gibbs. Reception plate method for characterisation of structure-borne sound sources in buildings: Assumptions and application. Applied Acoustics, 70(2):361–368, February 2009.
[43] M. Haeussler, T. Mueller, E. A. Pasma, J. Freund, O. Westphal, and T. Voehringer. Component TPA: benefit of including rotational degrees of freedom and over-determination. In Proceedings of ISMA2020, Leuven, Belgium, 2020.
[44] Barry Marshall Gibbs and Michel Villot. Structure-borne sound in buildings: Advances in measurement and prediction methods. Noise Control Engineering Journal, 68(1):1–20, January 2020. Publisher: Institute of Noise Control Engineering (INCE).
[45] H. Münch. Acoustically extended virtualization of industrial productsAkustisch erweiterte Virtualisierung von Industrieprodukten. PhD thesis, FAU Erlangen-Nürnberg, Erlangen, 2021. DOI 10.25593/978-3-96147-387-8.
Biographies

Matthias Vogt received his B.Sc. (2019) and M.Sc. (2021) in Mechanical Engineering from the Karlsruhe Institute of Technology (KIT). From 2022 to 2023, he was a researcher at the Institute of Mobile Machines (Mobima) at KIT. Since 2023, he has been pursuing a Ph.D. at Mobima in cooperation with Bosch Rexroth AG. His research focuses on developing a method for evaluating the structure-borne noise emissions of axial piston pumps.

Marcus Geimer received his Diploma degree in mechanical engineering from the RWTH Aachen University, Aachen, Germany in 1990. In 1995, he received his Ph.D. from the Institute of Hydraulics and Pneumatics, today named Institute for Fluid Power Drives and Systems, RWTH Aachen University. He started his industrial career in 1995 in the field of construction at the company Krupp Berco Bautechnik GmbH, Essen (Germany). There, he was the leader of the research group for hydraulic breakers. In 2000, he changed to Bucher Hydraulics Gmbh, Klettgau (Germany), where he led the construction and customer development for mobile hydraulics. Since 2005, he is a full professor and director at the Institute of Mobile Machines (Mobima), at the Karlsruhe Institute of Technology KIT, Germany. Hydraulic and electric drives for the traction drive as well as for the working functions and controls for mobile machines are one main research areas of the institute.
International Journal of Fluid Power, Vol. 27_1, 225–256
doi: 10.13052/ijfp1439-9776.2717
© 2026 River Publishers