Energy and Techno-Economic Analysis of Hydraulic Power Unit Designs for a Coil Compactor Machine
Samuele Nizzardo1, Alarico Macor2 and Alberto Benato1,*
1Department of Industrial Engineering, University of Padova, Via Venezia 1, Padova, 35131, Italy
2Department of Management and Engineering, University of Padova, Via Stradella San Nicola 3, Vicenza, 36100, Italy
E-mail: alberto.benato@unipd.it
∗Corresponding Author
Abstract
Coil compactor machines are energy-intensive industrial systems in which the hydraulic power unit plays a major role in determining overall efficiency during the operating cycle. This study presents an energy and techno-economic analysis of five hydraulic power unit designs for a wire rod coil compactor machine equipped with a tying head unit. Starting from a conventional pressure-controlled reference system, four alternative architectures are investigated: an inverter-driven system, a load-sensing system, an accumulator-based system, and a split hydraulic layout. Energy consumption is evaluated through detailed simulation of the machine duty cycle, while both operating and initial investment costs are assessed to compare the different solutions on a life-cycle basis. The results show that the load-sensing system and the optimized split system provide the best overall performance, reducing energy consumption by 27.89% and 23.88%, respectively, compared with the reference configuration. These reductions correspond to annual operating cost savings of approximately 4.9 k€ and 4.2 k€, respectively. Although these solutions require higher initial investments (+5.93 k€ for the load-sensing system and +2.72 k€ for the optimized split system), the corresponding simple payback periods are approximately 14.4 months and 7.7 months, respectively. The life-cycle assessment over a 20-year operating horizon indicates a substantial reduction in total expenditure. In particular, cumulative operating costs decrease from approximately 355 k€ for the reference configuration to about 256 k€ and 270 k€ for the load-sensing and optimized split solutions, respectively. The proposed analysis provides quantitative support for the selection of hydraulic power unit designs in energy-intensive industrial machinery and highlights the importance of integrating energy and economic criteria during the design stage.
Keywords: Hydraulic power unit, coil compactor machine, energy efficiency, techno-economic analysis, load-sensing system, hydraulic accumulator.
1 Introduction
Machines based on fluid power transmission systems account for nearly 5% of global energy-related emissions. Since more than 40% of these emissions are associated with losses in fluid power systems, substantial emission reductions could be achieved through energy-efficient innovations. As illustrated in Figure 1, research on energy-efficient fluid power offers significant short-term emission reduction potential and is expected to play a pivotal role in the disruptive transformation of fluid power technologies required to meet the European 2050 net-zero emission target [1]. The relatively poor efficiency of hydraulic systems (HSs) is primarily due to the extensive use of throttling for regulation and safety purposes. For pump-controlled hydraulic systems, the overall efficiency is only about 70% even under ideal operating conditions [2]. More generally, compared with electrical and mechanical systems, hydraulic systems tend to exhibit lower efficiency because of several loss mechanisms, mainly including throttling losses, overflow losses, and leakage losses. As discussed in several books (e.g. [3, 4]), the simplest and most traditional way to perform pressure reduction in an open-loop circuit is through the use of a relief valve. This configuration is still widely adopted in industry for small operating machines because it is a well-established, inexpensive, and reliable solution. Combining different chambers in multi-chamber actuators offers an interesting opportunity to improve the energy efficiency of valve-controlled systems [5]. However, increasing operating costs and growing attention to energy efficiency have progressively driven the transition toward more sustainable solutions based on load sensing (LS) [6], hydraulic accumulators (HAs) [7], flywheels [8], servomotors [9], digital pumps [10] and other less conventional approaches (e.g. [11, 12, 13, 14]). These developments have enabled the design of more efficient systems capable of operating under demanding working conditions. Mahato and Ghoshal have reported an interesting overview of energy saving approaches in hydraulic systems in [15, 16].
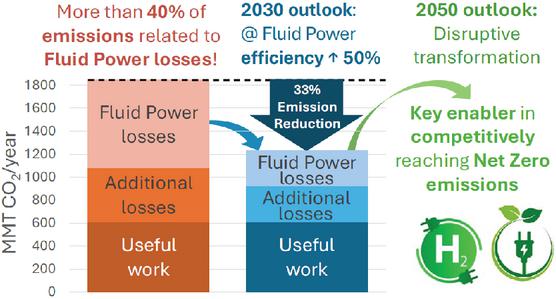
Figure 1 Emissions related to energy losses in fluid power systems and research impact.
However, at the same time, these solutions introduce two main drawbacks: higher initial investment costs and a lower degree of generality in the optimization process, which becomes increasingly tailored to specific operating scenarios. Rather than being viewed as a direct disadvantage, this aspect should be regarded as an indication of an intrinsic efficiency limit in the conventional design approach to hydraulic systems.
Among energy-intensive hydraulic applications, wire rod coil compactor machines represent a particularly relevant case. These industrial machines are designed to reduce coil volume and improve coil stability by exploiting the high forces generated by hydraulic actuation. This machine operates by compressing a wire rod coil between a set of pressure plates, removing and repositioning the lifting table, closing the wire guide, tensioning and tying the securing wires around the coil, and cutting the excess wire. The main hydraulic challenges of this application are the high peak flow demand, the large number of actuators operating in a coordinated sequence, and the highly repetitive nature of the duty cycle. Similarly to injection molding machines, forging presses, and other metal-forming equipment, coil compactors are characterized not only by high peak power demand but also by highly repetitive operation. In the case considered in this work, the machine operates continuously for 10 hours per day and 5 days per week, resulting in hundreds of thousands of cycles per year. Under these conditions, even a moderate reduction in the energy consumption of a single cycle may lead to significant annual energy and cost savings. However, studies that simultaneously compare the energy performance and the long-term economic viability of several power unit architectures applied to the same stationary industrial machine, under an identical and realistic duty cycle, are still scarce.
The present study addresses this gap by providing a systematic and integrated comparison of five hydraulic power unit configurations (spanning from conventional pressure control to load-sensing and accumulator-based architectures) applied to a real coil compactor machine with tying head unit (CCTHU). Within this context, the aim of this paper is to identify the hydraulic system configuration that best balances initial investment and operating costs for the CCTHU, changing the power unit design only. To this end, five different system configurations were investigated:
• Pressure-controlled system (), taken as the reference configuration, consisting of a variable-displacement piston pump (VP) coupled with a fixed-speed electric motor (FM);
• Inverter-driven system (), consisting of a fixed-displacement piston pump (FP) driven by a variable-speed electric motor (VM) controlled by an inverter;
• Load-sensing system ();
• Accumulator-based system (), composed of a fixed-displacement piston pump (FP) and a hydraulic accumulator;
• Split system (), incorporating two FPs, two FMs, and one HA.
The comparison is carried out from both energy and techno-economic perspectives in order to assess the effectiveness of each configuration under the actual operating cycle of the machine. In this way, the study aims to provide quantitative support for the selection of hydraulic power unit designs in energy-intensive industrial applications, with particular emphasis on the trade-off between improved efficiency and increased initial investment cost.
The remainder of the paper is organized as follows. Section 2 describes the methods adopted for modelling the electric motor and inverter, the hydraulic piston pump, and the sizing and optimization of the accumulator. Section 3 presents the selected case study. Section 4 reports and discusses the results, and Section 5 concludes the paper.
2 Methods and Models
The modelling approaches described in this section are common to all five configurations considered in the study. They are introduced here, prior to the description of the individual system configurations in Section 3, in order to avoid repetition and to provide a self-contained methodological foundation for the simulation results presented in Section 4.
In fluid power engineering, a given application can usually be addressed through different system configurations. In this context, energy performance and economic considerations represent the main criteria for selecting the most suitable solution. Accordingly, this study investigates a complete reconfiguration of the hydraulic power unit (PU) and analyzes the resulting design alternatives by means of the Simcenter AMESim simulation platform.
Three methodological design levels are considered in this work: conventional hydraulic system design, optimized system design, and complete hydraulic system reconfiguration. In the following sections, the models of electric motor and inverter are briefly introduced; then the pump loss models are presented, and finally the accumulator sizing and optimization procedure are described.
2.1 Electric Motor and Inverter
The model described in this section applies uniformly to all five configurations. The specific motor and pump types selected for each configuration – fixed or variable displacement pumps, fixed or variable speed motors – are detailed in Section 3.
The electrical energy consumption of each configuration is obtained from the mechanical power demand at the pump shaft through the efficiencies of the electric motor and the inverter.
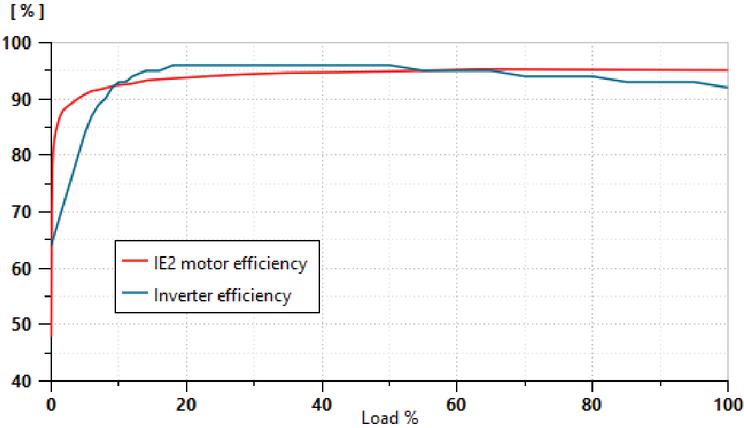
Figure 2 Efficiency of IE2 motor and inverter.
Rather than adopting constant average values, in this work both efficiencies are modelled as functions of the load using the efficiency curves shown in Figure 2, which were derived from the EU Regulation 2019/1781 [17] for the electric motor and from [18] for the inverter. This approach captures the efficiency drop that occurs at low load – below approximately 10–15% – and the essentially flat trend over the remaining operating range, where both curves settle close to their nominal values. It should be noted that the motor and inverter efficiencies enter the electrical energy balance of all five configurations through the same functional relationships. This ensures that the configurations are compared so that the resulting energy ranking reflects differences in the hydraulic circuits rather than dissimilarity in the modelling of the electrical drive. The configuration most affected by the load-dependent efficiency is S1, where the motor operates at variable speed and, therefore, explores a wider portion of the efficiency curve during the duty cycle. The efficiency curves adopted refer to an IE2 class motor, as it corresponds to the motor installed on the existing machine. This represents a conservative assumption, since the IE3/IE4 classes mandated for new motors by EU Regulation 2019/1781 exhibit even higher and flatter efficiency curves.
2.2 Axial Piston Pump Model
Pump energy losses constitute a significant share of the total losses in a hydraulic circuit; therefore, their modelling is crucial in simulation studies. Several approaches have been proposed in the literature for modelling axial piston pumps. Purely empirical approaches, based on efficiency maps derived from experimental measurements, offer high accuracy but require extensive test data for each pump and are not easily generalizable [19]. Physics-based analytical models, which derive loss expressions from the internal geometry and fluid properties, are the most detailed but are computationally expensive and require knowledge of internal design parameters not typically available from manufacturers [20, 21]. Semi-empirical loss models represent a well-established intermediate approach: they use physically motivated loss expressions whose coefficients are identified from manufacturer performance curves. This class of models has been widely used in simulation-based comparative studies of hydraulic systems and offers a good balance between physical representativeness and computational efficiency [22]. The present work adopts this approach, as described below. Volumetric losses were modelled as a leakage flow through a laminar orifice, which, according to laminar flow theory, depends linearly on pressure:
| (1) |
Hydro-mechanical losses can be described by analogy with the Stribeck curve for viscous friction between moving parts [23], where the friction torque is expressed as a linear function of pressure , rotational speed , and dry friction torque :
| (2) |
The coefficients of the previous loss models, , , , and were identified by fitting the model to the manufacturer-supplied performance curves of the pumps using a least-squares identification procedure. The model was calibrated on the functional data of a 140 cc commercial pump with a maximum pressure of 350 bar [24]. Figure 3 compares the power and flow rate provided by the model with the experimental values provided by the manufacturer. In the optimization studies, where pump displacement varies continuously, the previous coefficients have been varied according to Ivantysynova’s scaling laws[25].
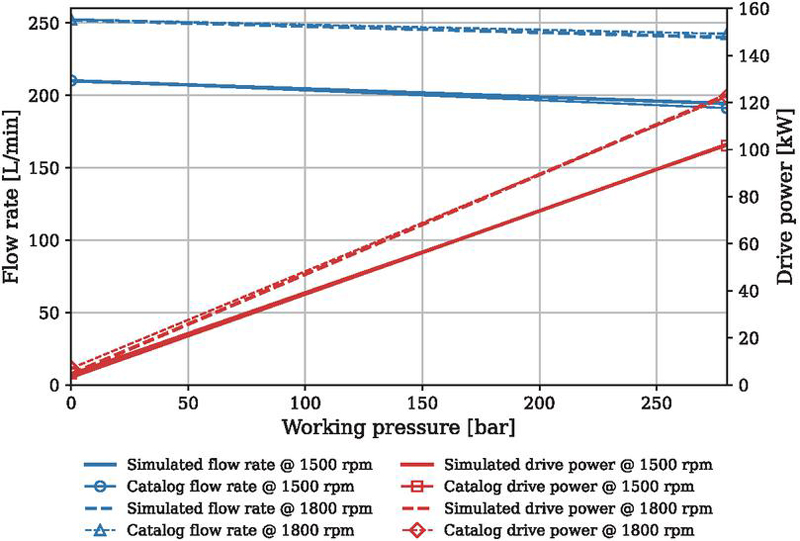
Figure 3 Comparison between the simulated and the catalogued pump at two different speeds. Dotted lines refer to the 1800 rpm regime, while the solid ones show the 1500 rpm regime.
2.3 Accumulator Sizing and Optimization
The optimization of component sizing is applied exclusively to the accumulator-based configurations (S3 and S4). Indeed, these are the only configurations in which the component sizing involves genuinely free design variables – specifically, the pump displacement, the accumulator volume, and the pre-charge pressure. In all other configurations (S0, S1, S2), the component sizing is fully determined by the maximum flow rate required by the duty cycle and by the constraints imposed by the control architecture.
Regarding the modelling of the hydro-pneumatic accumulator, several approaches are available in the literature, ranging from isothermal models (appropriate for slow charge-discharge processes) to polytropic and isentropic models [26]. In the present application, the accumulator operates at relatively high cycling frequencies, making heat exchange between the gas and the accumulator wall negligible on the timescale of a single cycle. The isentropic model is therefore adopted as the most physically appropriate choice for the charge-discharge process.
The accumulator sizing procedure starts with a detailed analysis of the different phases of the operating cycle in order to determine the average flow rate required by the system, which is assumed to be equal to the nominal pump flow rate. By performing a flow balance during both the charging and discharging phases of the accumulator, the maximum exchanged volume and the corresponding minimum and maximum gas pressures, and , can be determined. Once these quantities are known, the nominal accumulator volume , referred to the pre-charge pressure , can be computed by considering the charge–discharge process as isentropic:
| (3) |
However, this traditional sizing approach does not guarantee compliance with the velocity constraints imposed by the duty cycle, nor does it ensure minimum energy consumption during execution of the prescribed cycle (see Section 3.5). Therefore, in order to obtain reliable quantitative assessments of both energy consumption and dynamic performance, the design problem must be formulated as an optimization problem, and the corresponding results must be compared with those obtained from the traditional approach.
The optimization problem can be written as follows:
where are the design variables, , with , are the equality constraints, , with , are the inequality constraints, and is the objective function.
In the present study, the design variables are the pump displacement , , and . The objective function is defined as the minimization of the electrical energy consumption of the hydraulic circuit. The design parameters include the prescribed duty cycle, the actuator displacements, and the rotational speed of the electric motor. The design constraints consist of the maximum allowable accumulator volume and pressure, together with a bound on the admissible velocity tracking error during the simulated duty cycle, :
| (4) |
where denotes the reference velocity imposed by the duty cycle in the th phase and is the corresponding simulated velocity. Without these constraints, the simulated cycles would not be representative of the prescribed operating conditions.
The optimization was carried out using the genetic algorithm (GA) built into the Simcenter AMESim optimization module. The population size was set at 15 (more than 4.5 times the number of optimization variables), the maximum number of generations was set to 20, and the reproduction ratio is equal to 0.8. In this way, the number of iterations of the algorithm was 255. It should be noted that the AMESim GA implementation does not expose all internal parameters of the optimizer; this limitation is explicitly acknowledged.
3 Case Study and System Configurations
After briefly describing the reference machine and its duty cycle, this section presents the five circuit configurations examined in this work, starting from the layout currently adopted in the CCTHU. Each model is structured into three main subsystems: the actuator section, which is identical for all the considered configurations, the control unit, consisting of directional control valves and control systems, and the pumping unit.
3.1 Reference Machine and Duty Cycle
The CCTHU considered in this work is an advanced industrial machine designed to compact wire rod coils and apply securing wires. Its operating sequence includes the following main functions:
• Moving the pressure plates toward and away from the wire coil;
• Removing and repositioning the lifting table once the coil is supported by the pressure plates;
• Closing and opening the wire guide to prevent undesired movements;
• Tensioning and tying the support wires around the coil;
• Cutting the excess support wire.
fixed design parameters throughout the study, as they are imposed by the existing machine design. Only the hydraulic power unit layout and the sizing of the accumulator-related components are treated as design variables.
The simulated distribution unit consists of 12 linear actuators and 4 rotary actuators. The overall hydraulic system is shown in Figure 5. Actuators 2 and 4 were designed in a regenerative configuration in order to meet the required velocity constraints. The machine is assumed to operate for 10 hours per day, 5 days per week, and 50 weeks per year, accounting for maintenance stops, holidays, and other unforeseen interruptions. Assuming 20 seconds of idle time between two consecutive cycles for unloading and reloading the machine, one hour of operation corresponds to approximately 73 cycles. Consequently, the total number of duty cycles performed by the machine is about 182.5 thousand per year. The duty cycle is a key design parameter. It is defined by the size and speed of the individual actuators, as well as the resisting forces at each operating stage. The duty cycle data were derived from the design specifications provided by the industrial partner, including actuator dimensions and the required velocity profiles for each operating phase. The flow rate curve required by the complete system is shown in Figure 5.
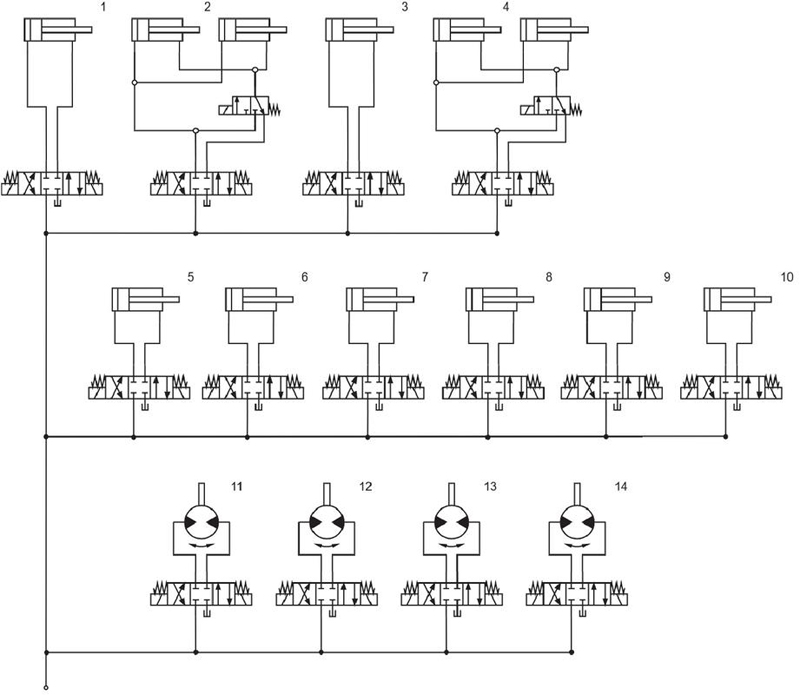
Figure 4 Distribution unit of the CCTHU machine.
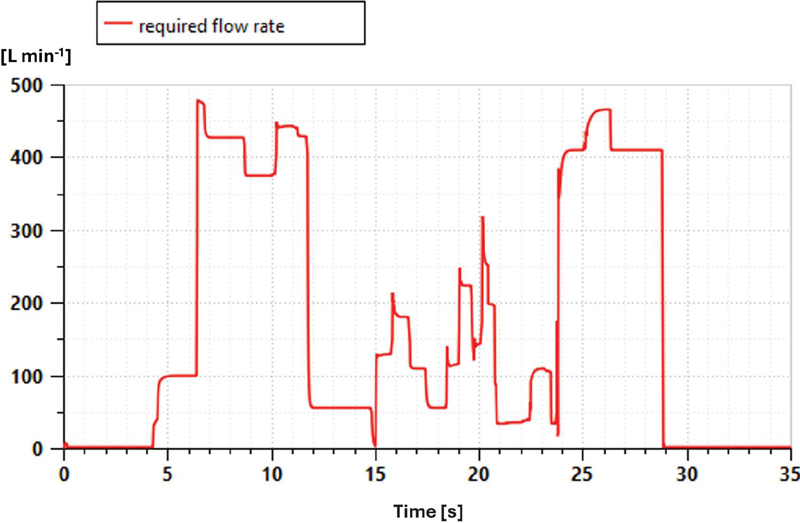
Figure 5 Flow rate required during the duty cycle.
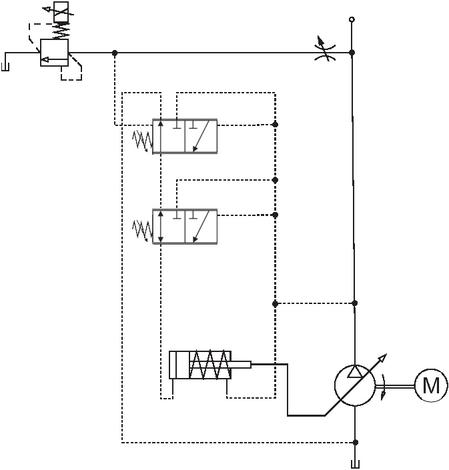
Figure 6 Pressure-controlled system. Reference configuration scheme of the PU ().
3.2 Pressure-controlled System (S0)
Flow regulation is achieved by means of a variable-displacement piston pump (VP) driven by a fixed-speed electric motor (FM), while the circuit pressure is maintained at a constant level. Speed regulation is assigned to a 4/3 proportional directional control valve, while cylinder locking is achieved through the spool positioning of the proportional valve. The characteristics of the proportional valves were taken from the manufacturer catalogues [27]. The pumping unit of solution S0 is shown in Figure 6. The displacement control unit consists of a commercial LS pump controller, whose load-pressure input is maintained at 160 bar by means of a pressure relief valve. As a result, the circuit pressure remains constant at 185 bar while the flow rate varies. Based on the flow rates required by the cylinders, the selected pump displacement is 340 cm3.
3.3 Inverter-driven System (S1)
In this solution, pump speed is adjusted by the inverter in order to maintain a constant supply pressure and a minimum rotational speed during the idle phases. This feature, together with the removal of the throttling-based pressure regulation system, is expected to reduce the overall energy consumption. The control unit remains unchanged with respect to solution S0, except for the pump, whose displacement can be reduced to 300 cm3. Also in this configuration, the circuit pressure remains constant at 185 bar as the flow rate varies.
The pumping unit is shown schematically in Figure 8. The pressure sensor measures the supply pressure and sends the corresponding signal to the PID controller, which in turn provides the command signal to the variable-frequency drive.
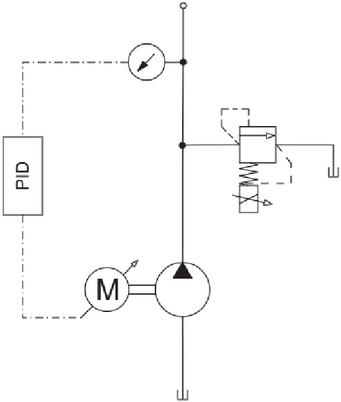
Figure 7 Power unit in the inverter-driven configuration (), regulated by a PID controller.
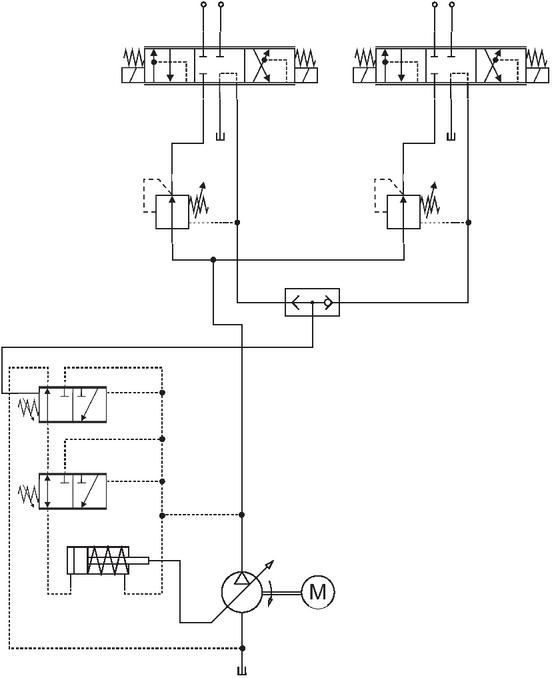
Figure 8 Power unit in the load-sensing configuration ().
3.4 Load-sensing System (S2)
The LS system aims to deliver only the required flow rate while keeping it independent of load variations. To achieve this, the pump displacement, and consequently the pump flow rate, is regulated to maintain a constant pressure drop across a restriction located between the pump and the load. As a result, the flow rate is determined solely by the restriction area, regardless of the load. In multi-actuator applications, a compensator is installed upstream of the restriction to prevent load interference between actuators. In the configuration shown in Figure 8, the compensator consists of a proportional valve with a load-pressure tap. The load-sensing pressure corresponds to the highest load pressure among all actuators and is selected through shuttle valves. The maximum pump displacement remains the same as in configuration S0.
3.5 Accumulator-based System (S3)
In this configuration, pump displacement is derived from the average flow rate over the duty cycle. For this reason, it is smaller than in the previous solutions, where pump sizing was instead based on the maximum required flow rate. The pump operates continuously, but at a lower power level than in the previous cases, thereby reducing energy consumption. The control section is the same as in solutions S0 and S1, whereas the pumping unit consists of an FP with a parallel accumulator, as shown in Figure 9. The sizing of the PU was carried out using two approaches: the traditional method and the optimization-based method, as already discussed in Section 2.3. This solution shows that the speed of some cylinders is lower than the design value because of insufficient accumulator pressure during the duty cycle. Therefore, it was necessary to modify the pre-charge pressure. This adjustment was also required to ensure that the final accumulator pressure coincided with the initial pressure at the beginning of the cycle, so that the HA would not act as a net energy supplier over a complete cycle.
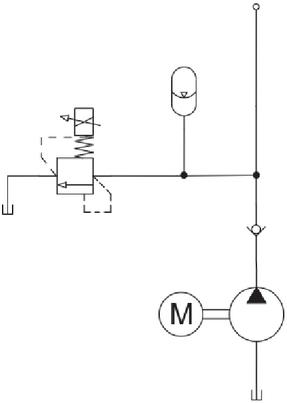
Figure 9 Power unit in the accumulator-based configuration ( and ).
Nevertheless, the traditional sizing procedure does not guarantee minimum energy consumption during execution of the prescribed cycle. In order to satisfy both the speed requirements and the objective of minimum energy consumption, this case was also formulated as an optimization problem. During the optimization, the accumulator volume was constrained not to exceed given limits, in order to avoid replacing the existing reservoir with a larger one. Considering that the original reservoir volume is 2000 L, an additional volume of 200 L was regarded as acceptable. However, a second configuration with a larger accumulator was also investigated, which would require adoption of a larger reservoir; in this case, a maximum HA volume of 500 L was assumed. Accordingly, two optimization runs were performed using two different upper bounds for the accumulator volume.
The size of the HA was determined through both the traditional approach and the two optimization runs. The resulting pump and HA sizes are summarized in Table 1.
Table 1 Resulting hydraulic accumulator and pump sizes for configuration
| Setup | Pump displacement | Accumulator volume | Pre-charge pressure |
| [cm3] | [L] | [bar] | |
| 148.3 | 179 | 185.4 | |
| Opt 1 | 136.0 | 187 | 196.0 |
| Opt 2 | 128.0 | 326 | 177.0 |
3.6 Split System (S4)
This configuration is derived from solution S3, which therefore represents the reference case for its development, and was introduced to guarantee accurate cylinder velocities. This requirement leads to an increase in pump displacement as well as in both accumulator volume and pressure, thereby partially reducing the energy advantages associated with the use of the accumulator. To overcome this drawback, the circuit was reconfigured into two parts. In the first part, the cylinders with the highest flow demand are supplied by an FP sized to meet the required velocities. In the second part, the remaining cylinders are supplied by another FP and an accumulator, both smaller than those of configuration S3. Since the PU layout is the same as in Section 3.5, except for the addition of a second pump, the power unit scheme is again shown in Figure 9.
In the first part of the system, the pump is relatively large and exhibits higher internal losses because of its displacement. However, it operates at high pressure only during the required working intervals. The actuators whose size and velocity requirements determine the displacement of the pump in part 1 are actuators 2 and 4 in Figure 5. They are connected in a regenerative configuration and form two identical groups. To guarantee the required motion velocities, these actuators are supplied by an FP with a displacement of 280 cm3.
By contrast, the pump and HA of the second part are smaller than those in the reference case and therefore generate lower losses. This second part of the system was sized using both traditional and optimization-based methods. The latter was limited to the sole constraint of a maximum accumulator volume of 200 L, since the additional energy savings achievable at larger volumes were found to be negligible. Table 2 summarizes the resulting pump and HA sizes for both the traditional and optimized cases.
Table 2 Resulting hydraulic accumulator and secondary pump sizes for configuration
| Setup | Pump displacement | Accumulator volume | Pre-charge pressure |
| [cm3] | [L] | [bar] | |
| 40 | 80 | 162 | |
| Opt | 34 | 180 | 191 |
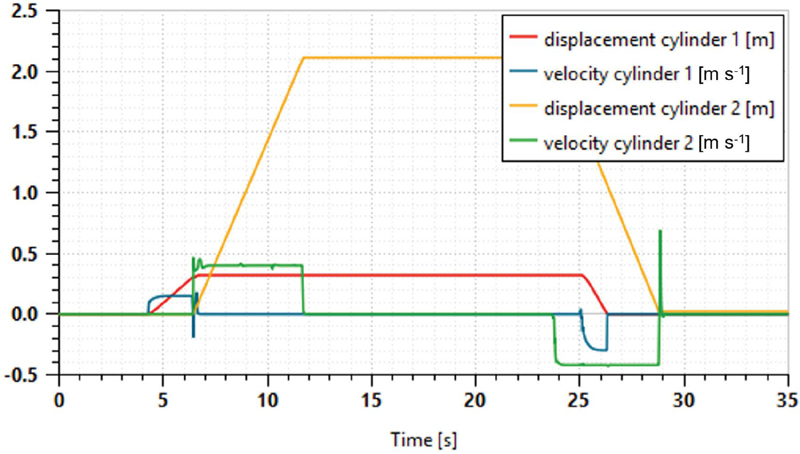
Figure 10 Representative example of the duty cycle for the most relevant actuators (1 and 2).
4 Results and Discussion
All developed solutions were simulated over the same duty cycle, while satisfying the actuator velocity requirements. Figure 10 shows an example of the duty cycle for cylinders 1 and 2. Given the large number of actuators (12 linear and 4 rotary), displaying all individual flow and pressure profiles in a single figure would significantly reduce readability. These two actuators were selected as illustrative examples: actuator 1 represents a standard linear actuator, while actuator 2 illustrates the regenerative configuration. The energy consumption over one duty cycle for configurations , , and is shown in Figure 11, while the corresponding supply pressure is reported in Figure 12.
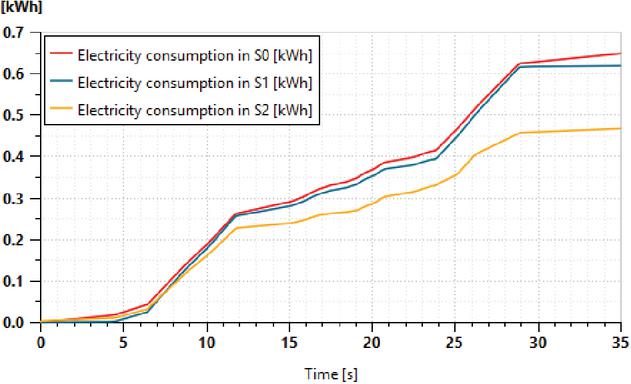
Figure 11 Energy consumption over one duty cycle for configurations (red), (blue), and (yellow).
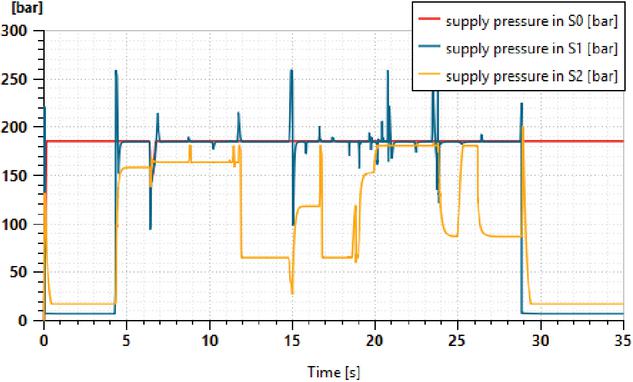
Figure 12 Supply pressure over one duty cycle for configurations (red), (blue), and (yellow).
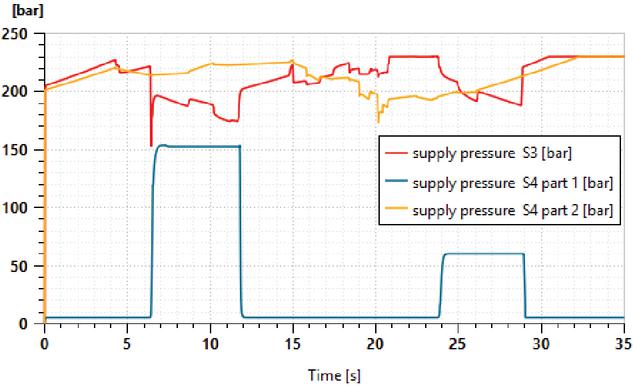
Figure 13 Supply pressure over one duty cycle for configurations and (parts 1 and 2).
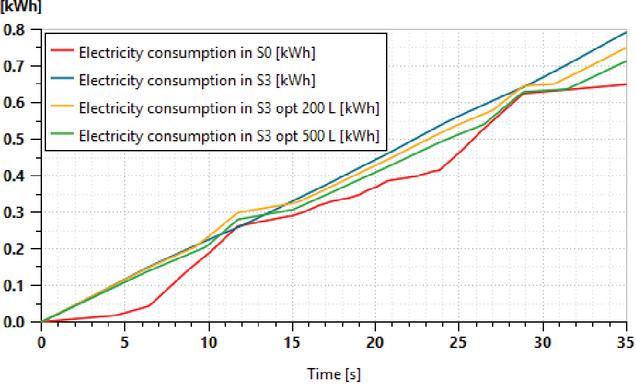
Figure 14 Comparison of energy consumption for the analyzed solutions of configuration .
The first two solutions exhibit a similar energy-consumption trend, since both maintain the supply pressure at 185 bar, except during the initial and final idle phases, where configuration reduces the pressure set-point. By contrast, solution follows the pressure level required by the load and therefore requires less power when the pressure demand is low, namely in the central and final parts of the cycle. As a result, the electrical energy consumption is reduced by almost 28% with respect to solution . Figure 14 shows the supply pressure for configurations and . Although these solutions exhibit different trends, configuration and part 1 of show a similar average pressure level, around 200 bar, although it is not constant in either case. By contrast, part 2 of is governed by the flow delivered by the accumulator at an approximately constant pressure. A specific discussion is required for solution . As shown in Figure 14, this configuration exhibits higher energy consumption than the reference solution . This result is, at first sight, counter-intuitive: the introduction of an accumulator – a standard energy-saving component – leads to increased energy consumption compared to the reference. The underlying mechanism is instructive and deserves discussion. In the conventional sizing approach, the pump is sized to the average cycle flow rate, which is significantly lower than the peak demand. To meet peak flow requirements, the accumulator must be pre-charged to a sufficiently high pressure, which in turn forces the pump to operate at a higher pressure level even during low-demand phases. Furthermore, the relief valve action required to ensure energy neutrality of the accumulator over the cycle dissipates a non-negligible amount of energy. This illustrates a fundamental limitation of conventional accumulator sizing methods: they guarantee functional correctness but not energetic optimality. The optimization results confirm this interpretation: the GA-based sizing consistently reduces energy consumption relative to the traditional approach, but the residual penalty with respect to S0 persists because the structural limitation – the need for a single pump to serve both charging and actuation – cannot be fully overcome without a circuit reconfiguration. This motivates the introduction of configuration S4.
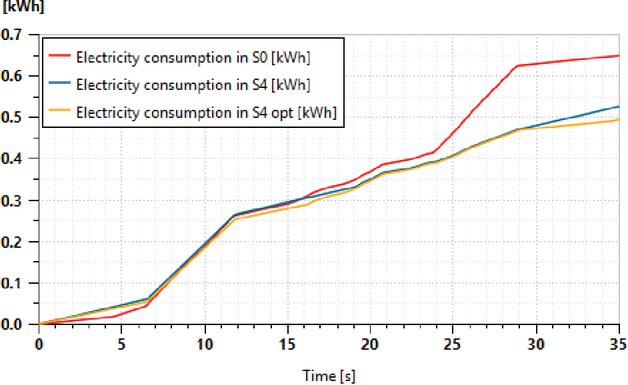
Figure 15 Comparison of energy consumption for the analyzed solutions of configuration .
The electrical energy consumption of the three -based solutions is summarized in Figure 14. Compared with the non-optimized configuration , configurations Opt 1 and Opt 2 reduce energy consumption by approximately 5.4% and 10.0%, respectively. Nevertheless, all three -based configurations exhibit higher energy consumption than the reference configuration . In particular, Opt 2 still consumes approximately 10.0% more energy than , making the additional investment associated with the larger reservoir difficult to justify. Configuration is obtained by splitting the power unit of into two parts, as described in Section 3.6. Figure 15 shows the energy consumption after this system reconfiguration. Compared with configuration , configuration reduces energy consumption by approximately 33.7%. When optimization is applied, configuration Opt achieves a reduction of approximately 37.7% relative to . Moreover, compared with the non-optimized configuration Opt provides an additional energy reduction of approximately 6.1%. The energy consumption over one duty cycle for all the analyzed configurations is summarized in Table 3 and compared with the reference solution . The table also reports the annual electricity cost for each configuration. The assumptions adopted are a constant electricity price of 0.15 € kWh-1 and the exclusion of the maintenance cost, which may affect the absolute values of the life-cycle assessment. However, a variation in electricity price does not alter the ranking of the configurations.
Table 3 Energy consumption over a single duty cycle and annual operating costs (182.5 thousand cycles). The gap between the reference condition and the other simulated configurations is also reported
| Setup | Energy consumption | Energy | Annual operating cost | Cost |
| kWh | % | k€ | k€ | |
| 0.649 | 0 | 17.766 | 0 | |
| 0.619 | 16.945 | |||
| 0.468 | 12.812 | |||
| 0.793 | 21.708 | +3.942 | ||
| Opt 1 | 0.750 | 20.531 | +2.765 | |
| Opt 2 | 0.714 | 19.546 | +1.780 | |
| 0.526 | 14.399 | |||
| Opt | 0.494 | 13.523 |
Table 4 Operating costs over 20 years, with focus on the gap between the reference condition and the other simulated configurations
| Setup | 20-year operating cost | Cost |
| k€ | k€ | |
| 355.32 | 0 | |
| 338.90 | ||
| 256.24 | ||
| 434.16 | +78.84 | |
| Opt 1 | 410.62 | +55.30 |
| Opt 2 | 390.92 | +35.60 |
| 287.98 | ||
| Opt | 270.46 |
Table 5 Initial investment cost and simple payback period of the analyzed PU configurations. A negative Cost indicates a reduction in initial expenditure. N.A. (Not Applicable) highlights the absence of a payback period – except for S0, since it is the reference configuration
| Setup | Initial investment cost | Cost | Payback Period |
| k€ | k€ | months | |
| 25.12 | 0 | N.A. | |
| 24.58 | Immediate | ||
| 31.04 | +5.93 | 14.4 | |
| 21.38 | N.A. | ||
| Opt 1 | 21.38 | N.A. | |
| Opt 2 | 31.24 | +6.12 | N.A. |
| 23.23 | Immediate | ||
| Opt | 27.83 | +2.72 | 7.7 |
Assuming an average service life of approximately 20 years for a CCTHU machine, the overall operating cost difference among the analyzed configurations becomes much more significant. Table 4 reports the operating cost over a 20-year period and compares all configurations, without considering revamping interventions during this time span. These results clearly highlight the poor economic performance of the configurations: even after optimization, and without accounting for investment costs, they still increase operating costs because of their higher energy consumption. By contrast, solution and the optimized solution appear particularly attractive because of their substantial reduction in operating costs. Another key factor in selecting a configuration is the initial investment cost. Indeed, even if a solution exhibits the lowest energy consumption, this does not necessarily imply that it is the most cost-effective option because the initial investment may be higher. Table 5 reports the investment cost of each arrangement, taking into account the average cost of the main components, including different piston pumps (VPs or FPs, with different sizes), different electric motors (same type with different sizes), motor drives, accumulators, the LS valve in the load-sensing architecture, and hydraulic fluid. In addition, it also represents the economic assessment that was performed using the simple payback method (SPP)1
| (5) |
As shown in Table 5, the least expensive solutions in terms of initial investment are the accumulator-based system and its first optimized variant. These configurations consist of a fixed-displacement pump, a fixed-speed electric motor, and an accumulator, which are among the least expensive components available on the market. By contrast, the most expensive solutions, namely the load-sensing architecture and the optimized split system, are also the most efficient ones. This result highlights that a modest increase in initial investment can lead to a substantial reduction in operating costs over the 20-year service life expected for a CCTHU.
The payback period analysis highlights the distinct characteristics for the investigated hydraulic architectures. Configurations S1 and S4 provide an immediate economic benefit, as they require a lower initial investment than the baseline system, while simultaneously reducing annual operating costs. The load-sensing architecture (S2) achieves the largest reduction in operating costs, recovering its higher initial investment in approximately 14.4 months. The optimized split architecture (S4 Opt) offers slightly lower annual savings but requires a substantially smaller incremental investment, resulting in the shortest payback period (7.7 months). In contrast, the S3 configuration and its optimized variants do not achieve investment recovery: although S3 and S3 Opt 1 reduce the acquisition cost, their higher operating costs outweigh this initial advantage, whereas S3 Opt 2 improves the operating cost, but not sufficiently to offset its higher initial investment.
5 Conclusions
The main contribution of this work lies in the integrated comparison of alternative hydraulic architectures under identical duty-cycle constraints, combining energy assessment with long-term economic evaluation for a heavy-duty industrial application. It is worth emphasizing that the reference solution already represents an advanced energy-efficient configuration, since it is based on a pressure-controlled variable-displacement pump and does not require the intervention of a relief valve, unlike more conventional circuit layouts.
Although the quantitative results are specific to the analyzed coil compactor machine, the proposed evaluation framework can be extended to other duty-cycle-driven hydraulic industrial systems.
Among the first three investigated solutions, the load-sensing configuration emerges as the most effective. This result confirms the suitability of LS architectures for multi-actuator industrial systems. At the same time, the analysis shows that meaningful energy savings, on the order of 20%, can also be achieved without resorting to excessively complex or expensive solutions. In fluid power applications, such a reduction is particularly significant and demonstrates that careful system design can substantially improve overall performance.
Although the accumulator-based circuit does not appear to be the most promising option in its initial form, the optimization of its sizing parameters highlights its potential for reducing energy consumption. Based on this finding, the final configuration combines the accumulator-based approach with a system reconfiguration strategy. In particular, the reconfiguration of the HA-based layout, together with an optimization-based design procedure, leads to a substantial reduction in energy demand, approaching the performance of the LS configuration.
The use of commercially available components represents a crucial practical aspect. Solutions and were designed to operate under optimal conditions using customized hydraulic accumulators. However, when commercially available accumulators and pumps are considered, the achievable performance may be affected, potentially reducing the overall system efficiency. This effect becomes particularly relevant when the gap between the optimal design sizes and the available catalog sizes increases. In such cases, the adoption of pumps with larger displacements may force the HA relief valve to open, causing additional energy dissipation and, consequently, higher overall energy consumption. Overall, the results show that the combined use of system reconfiguration and optimization-based design provides a practical and effective pathway toward more energy-efficient hydraulic power units in industrial machinery.
Finally, the analysis of the payback period indicates that the preferred hydraulic architecture depends on the design objective: S1 and S4 minimize both acquisition and operating costs, S2 maximizes the reduction in operating costs despite a higher initial investment, and S4 Opt provides the fastest return on investment. Conversely, the S3-based configurations do not offer a favorable economic return under the investigated conditions.
Acknowledgements
The authors gratefully acknowledge Hydroven S.r.l. for supporting this research.
Author Contributions
A.B. and A.M. contributed to the conceptualization of the study, supervision of the research activity, methodology development, and writing – review and editing. S.N. contributed to methodology, validation, and writing – review and editing. A.B. also contributed to funding acquisition. All authors reviewed and approved the final manuscript.
References
[1] NFPA and CCEFP, “Fluid power carbon emissions reduction roadmap: 2030 and 2050 outlook,” 2023. www.nfpa.com/technologyreports.
[2] M. Bhola and G. Wrat, “Energy-efficient hydraulics in heavy machinery: Technologies, challenges, and future directions,” Sustainability 2026, vol. 18, p. 302, 2026.
[3] J. L. Blackburn, G. Reethof, and J. L. Shearer, Fluid Power Control. New York and London: The Technology Press of M.I.T., John Wiley & Sons, Inc., 1960.
[4] H. E. Merritt, Hydraulic Control Systems. New York, London, Sydney: John Wiley & Sons, Inc., 1967.
[5] H. Raduenz, L. Ericson, K. Heybroek, V. J. de Negri, and P. Krus, “Extended analysis of a valve-controlled system with multi-chamber actuator,” International Journal of Fluid Power, vol. 23(1), pp. 79–108, 2022.
[6] L. Darko, K. Mitja, and U. Samo, “Electro-hydraulic load sensing with a speed-controlled hydraulic supply system on forming-machines,” Int J Adv Manuf Technol, vol. 41, pp. 1066–1075, 2009.
[7] H. H. Triet and K. K. Ahn, “Comparison and assessment of a hydraulic energy-saving for hydrostatic drives,” Proceedings of the Institution of Mechanical Engineers, Part I: Journal of Systems and Control Engineering, vol. 255(1), pp. 21–34, 2011.
[8] X. Yan, S. Nie, B. Chen, F. Yin, H. Ji, and Z. Ma, “Strategies to improve the energy efficiency of hydraulic power unit with flywheel energy storage system,” Journal of Energy Storage, vol. 59, p. 106515, 2023.
[9] L. He, Z. Xiaogang, Q. Long, and Z. Hongjuan, “Research on energy consumption of injection molding machine driven by five different types of electro-hydraulic power units,” Journal of Cleaner Production, vol. 242, p. 118355, 2020.
[10] S. Heitzig, S. Sgro, and H. Theissen, “Energy efficiency of hydraulic systems with shared digital pumps,” International Journal of Fluid Power, vol. 13(3), pp. 49–57, 2012.
[11] Y. Xiaopeng, C. Baijin, Y. Fanglong, J. Hui, M. Zhonghai, and N. Songlin, “Energy optimization of main hydraulic system in a forging press by simulation and experimental methods,” Energy, vol. 277, p. 127620, 2023.
[12] X. Lianpeng, Q. Long, G. Lei, and H. Yunxiao, “Energy efficiency analysis of integrated drive and energy recuperation system for hydraulic excavator boom,” Energy Conversion and Management, vol. 156, pp. 680–687, 2018.
[13] A. Macor, A. Benato, A. Rossetti, and Z. Bettio, “Study and simulation of a hydraulic hybrid powertrain,” Energy procedia, vol. 126, pp. 1131–1138, 2017.
[14] C. Yuan, M. Pan, and A. Plummer, “A review of switched inertance hydraulic converter technology,” Journal of Dynamic Systems, Measurement, and Control, vol. 142, p. 050801, 03 2020.
[15] A. C. Mahato and S. K. Ghoshal, “An overview of energy savings approaches on hydraulic drive systems,” International Journal of Fluid Power, vol. 21, no. 1, pp. 81–118, 2018.
[16] A. C. Mahato and S. K. Ghoshal, “Energy-saving strategies on power hydraulic system: An overview,” Proceedings of the Institution of Mechanical Engineers, Part I: Journal of Systems and Control Engineering, vol. 235, no. 2, pp. 147–169, 2021.
[17] European Commission, “Commission regulation (eu) 2019/1781: laying down ecodesign requirements for electric motors and variable speed drives pursuant to directive 2009/125/ec of the european parliament and of the council, amending regulation (ec) no 641/2009 with regard to ecodesign requirements for glandless standalone circulators and glandless circulators integrated in products and repealing commission regulation (ec) no 640/2009,” Official Journal of the European Union, vol. 62, no. L272/74, p. 74, Oct 1, 2019.
[18] G. Rampinelli, A. Krenzinger, and F. Chenlo Romero, “Mathematical models for efficiency of inverters used in grid connected photovoltaic systems,” Renewable and Sustainable Energy Reviews, vol. 34, pp. 578–587, 2014.
[19] G. K. Costa and N. Sepehri, “Understanding overall efficiency of hydrostatic pumps and motors,” International Journal of Fluid Power, vol. 19, no. 2, pp. 106–116, 2018.
[20] N. D. Manring and R. C. Fales, Hydraulic control systems. John Wiley & Sons, Inc, 2019.
[21] B. Xu, M. Xu, J.-h. Zhang, and Q. Su, “Characteristics of volumetric losses and efficiency of axial piston pump with respect to displacement conditions,” Journal of Zhejiang University-SCIENCE A (Appl Phys & Eng), vol. 17, pp. 186–201, 02 2016.
[22] J. Ivantysyn and M. Ivantysynova, Hydrostatic Pumps and Motors: Principles, Design, Performance, Modelling, Analysis, Control and Testing. Tbi edition, Tech Books International, 2003.
[23] N. D. Manring, “Friction forces within the cylinder bores of swash-plate type axial-piston pumps and motors,” Journal of Dynamic Systems, Measurement, and Control, vol. 121, pp. 531–537, 09 1999.
[24] Bosch Rexroth AG, Axial piston variable pump - A10VSO series 32, 2026. Technical Catalog n. RE 92714/2026-03-02.
[25] L. Shang and M. Ivantysynova, “An investigation of design parameters influencing the fluid film behavior in scaled cylinder block/valve plate interface,” in Proceedings of the 9th FPNI Ph.D. Symposium on Fluid Power. Florianópolis, SC, Brazil, p. V001T01A027, 10 2016.
[26] R. Dindorf, J. Takosoglu, and P. Wos, “Review of hydro-pneumatic accumulator models for the study of the energy efficiency of hydraulic systems,” Energies, vol. 16, no. 18, 2023.
[27] Bosch Rexroth AG, Proportional directional valves, pilot operated, with electrical position feedback and integrated electronics (OBE) – Type 4WRKE, 2026. Technical Catalog n. RE 29075/08.13.
Footnotes
1The SPP is defined as the ratio between the incremental capital investment and the annual operating cost difference relative to the baseline configuration ().
Biographies

Samuele Nizzardo. Ph.D. Candidate in Industrial Engineering (Curriculum Energy Engineering) at the University of Padova. He received his master’s degree in aerospace engineering from the University of Padova. His main research interests include fluid topology optimization, fluid mechanics, computational fluid dynamics, and fluid power systems.

Alarico Macor. Associate Professor of Hydraulic Systems and Fluid Machines at the Department of Engineering and Management, University of Padova. His main research interests include turbomachinery, energy conversion plants, thermoeconomic analyses, emissions in biodiesel and biogas engines and boilers, fluid power systems, and hydromechanical and hybrid transmissions.

Alberto Benato. Associate Professor of Energy Systems and Power Generation at the Department of Industrial Engineering, University of Padova. He received his Ph.D. in industrial engineering, energy engineering curriculum, from the University of Padova. His main research interests include fluid power systems, Carnot batteries, pumped hydro and hybrid storage units, and renewable-based multi-energy systems.
International Journal of Fluid Power, Vol. 27_3, 589–616
doi: 10.13052/ijfp1439-9776.2735
© 2026 River Publishers