Geometry of Ball Seat Valves
Felix Fischer*, Niklas Bauer, Hubertus Murrenhoff and Katharina Schmitz
RWTH-Aachen University, Institute for Fluid Power Drives and Systems (IFAS), Aachen, Germany
E-mail: f.fischer@ifas.rwth-aachen.de
*Corresponding Author
Received 30 November 2020; Accepted 19 February 2021; Publication 29 May 2021
Abstract
The macroscopic geometry of ball seat valves is important for the quality of the seal. This works discusses the influence of different geometric properties on the contact area, the contact pressure and their relation to the leakage. The leakage is calculated using the results of finite element method (FEM) calculations and Persson’s percolation based method. The following properties of the seat are examined: the angle, the curvature and the eccentricity.
Keywords: Ball seat valve, contact, FEM, leakage, sealing.
1 Preface
This paper presents an extension of the results shown in [1].
Metallic seals play an important role in many different fields and applications. For example, they are used in valves, inside of screw fittings, and at pistons of bent-axis-machines.
Yet there is still a lack of research on the hard-hard contact. For instance, the leakage mechanism is not fully understood and the role of plasticity needs to be determined.
Nowadays, engineers design metallic seals based on experience. They use over-designed components and contact pressures to guarantee seal tightness. An optimization of metallic seals will lead to a cost reduction and lifetime elongation.
In order to optimize metallic seals, one needs to quantify the influence of the surface and the geometry in the contact. This work is a contribution to this research. It focuses on the macroscopic effects of the geometry. They alone are not enough to calculate the leakage. However, they are a required preparation and allow on their own to predict which designs create the tightest seals. This paper discusses the geometric properties of metallic ball seat valves. The leakage is calculated based on FEM simulations of ball seat valves and an exemplary measurement of a rough surface.
2 Theoretical Concepts
In this section, there is a brief introduction into the nature of rough surfaces. There is also a summary of the leakage calculation method, which is used in this work.
2.1 Rough Surfaces
Metallic surfaces are rough on a microscopic level. Surface roughness can be described using the root mean square roughness or [2]:
| (1) |
Where is the height profile of the surface.
It has been shown that most metal’s rough surface can be described approximately as self-affine fractal. Fractal surfaces can be characterized by their Hurst exponent , also called roughness exponent [3]. is related the fractal dimension via for lines or for surfaces. describes how much the perceived dimensionality changes with a change of scale. For example, a perfect line has a dimension of 1. If this line is irregular and rough inside its embedding plane, then it starts to fill a two-dimensional structure. With increasing resolution the line approaches a two-dimensional structure. If approaches 1, the line will look more and more like a surface [4].
There are several non-equivalent definitions for the fractal dimension. One example is the Minkowski-Bouligand or box dimension. Let the plane be divided into squares with side length . is the number of squares the line passes through. In this case, D is equal to:
| (2) |
can be constructed analogous for fractal planes [5]. One of the benefits of this definition of is that it does suggest an algorithm to calculate it from data. Another one is its simplicity.
Typical values for H in the case of steel surfaces lie in between 0.90 and 0.97 [6].
Surfaces with the same nominal roughness can posses different fractal properties. This is illustrated by Figure 1. It shows two artificially generated perfectly self-affine fractal surfaces with the same roughness.

Figure 1 Two self affine fractal surfaces with different fractal properties and =.
Due to the surface roughness, two rough planes which are apparently at full contact have a reduced real contact area if they are investigated using a higher resolution. This apparent area of contact depends on the materials’ properties, the contact pressure and the magnification which is defined as the fraction up to which surface wave lengths are included compared to the length of the probe. The relationship between these quantities and the relative real contact area is [7]:
| (3a) | |
| (3b) |
Where is the Young’s modulus, the Poisson’s ratio, the surface wave number, the lower wave number cut-off and the surface roughness power spectrum which is defined as:
| (4) |
can be related to the mean square roughness via [8]:
| (5) |
In this work, has been calculated based on a surface measurement, as seen in Figure 2. If the surface was perfectly self-affine fractal, the log-log-graph would appear as a straight line. In this case, it posses a roll-off area for low wave-vectors and it cannot be described by a perfect line, either.

Figure 2 Surface roughness power spectrum of an isotropic metallic surface.
2.2 Leakage
If two rough surfaces are in contact, there are microscopic channels between the planes due to the rough microscopic structure. In case of seals, some of the channels percolate through the contact from the high pressure region to the low pressure region. The leakage of a closed valve happens through these channels. This mechanism is illustrated in Figure 3. In this figure, blue regions symbolize areas of contact between the seat and the ball and white regions symbolize areas that are not in contact.

Figure 3 Sketch of the occurrence of percolation channels with increasing magnification . Light blue regions symbolize area of contact and white regions areas of no contact.
Reference [9] describes this leakage mechanism. The flow through the system of channels can be approximated via the 2D Bruggemann effective-medium theory. In case of the geometry of a cylindrical valve, it can be formulated as:
| (6) |
Where is the density of leakage perpendicular to the contact edge at cylinder angle that is usually called the azimuthal angle, is the effective conductivity density and is the pressure drop. is the contact area in radial direction at angle . The conductivity is defined as:
| (7) |
where is a difference of pressure and is the volumetric flow rate.
can be found by solving the following equation numerically:
| (8) |
Where describes the conductivity of a percolation channel at magnification . The conductivity of a fluid with viscosity through a channel with height can be approximated using the throttle equation [10]:
| (9) |
This approximation assumes a constant normal contact pressure alongside the channel. The pressure is not actually constant alongside the contact area, but has instead a clear maximum at some point. An example for a real pressure curve can be seen in Figure 8. Thus, the heights of the channels are not actually constant. Their tightness varies with the contact pressure. Nevertheless, this approximation can still be used in most cases, because the smallest height of the channel dominates the leak tightness.
The model can be refined by choosing a more accurate description of the conductivity through such a channel. In either case, the conductivity is highly dependent on the minimal height of the channels.
The height of the channel can be found using the real area of contact and the average separation between the surfaces in contact :
| (10) |
Reference [11] shows how is derived:
| (11a) | |
| (11b) |
Where is the surface roughness power spectrum, and are the lowest and highest observed surface roughness wave numbers, is both material’s effective Young’s module.
If both materials are elastic and possess an elastic module, the effective elastic module is defined by Equation (12):
| (12) |
The most important difference between the contact mechanics of metallic seals and rubber seals is the influence of plasticity. In metallic seals, microscopic plastic deformations reduce the leakage. The industry applies this effect by impregnating metallic seals before usage. For this, a very high normal force is applied to the valve for a short time. This changes the surface’s properties at the contact area, which can be seen by the naked eye [12].
After applying a normal force or a fluid pressure to a valve, the roughness flattens out plastically on the area of contact [13]. A reduced roughness leads to a smaller , which in turn leads to smaller channels according to Equation (11) and thus to a better sealing of the valve.
One can introduce the important effects of microscopic plasticity into the calculations by reducing the spectral density of the surface by a correcting factor [14].
| (13) |
Where is the contribution to the relative contact area by plastic deformations, see [15].
The most important properties for calculating leakage, which are determined using simulations in the macroscopic scale are the contact area in radial direction and the maximum of the contact pressure distribution along the radial direction. The contact pressure determines the tightness of the microscopic channels. A higher peak of the contact pressure and a larger contact area lead to a reduction in leakage. According to Equation (9), the leak tightness is where is the radial contact area and approximately with some constant . The meaning of and is illustrated in Figure 4.
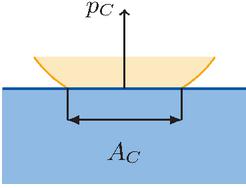
Figure 4 Sketch of the apparent contact area of a ball seat valve.
Due to their major impact on the sealing mechanism, the calculation of these quantities are subject to this paper.
In physical valves, the leakage decreases with time, because of particles in the fluid blocking the channels, so that the leakage decreases with rising contamination [12]. This effect is not included in this work.
3 Computational Methods
In this paper, the elastic problem is solved computationally using the finite element method (FEM). The numerical results are validated using an analytic approximation. Based on the contact pressure distribution and on a surface scan, the leakage is calculated using Persson’s method.
3.1 Analytic Contact Mechanics
In order to verify the results of the FEM calculation, the data has been compared with semi analytical results. Reference [16] describes how the contact problem can be solved for rotationally symmetric non-adhesive frictionless static contacts. This analytic method allows for the inclusion of plasticity, as well.
Other works have shown, that softened contact models are better in describing rough surfaces [17]. Soft contact relations assume, that some forces are compensated by elastic deformations of the surface asperities, rather than by deformations of the bulk material. Yet, there are no analytical methods to exactly calculate the contact pressure distributions using a soft contact relation. Still, good results for low contact pressures can be achieved, by assuming that only the asperities of the surfaces deform elastically excluding the bulk deformations.
In his work, Persson calculated a relation between the contact pressure and the distance of planes [18]. He found out, that there is an exponential relation between the variables: , with a constant constant which depends on . Together with the geometry of the surfaces and the total normal force, this can be used to calculate the contact pressure distribution.
For this calculation, the fact is used, that the ball is squeezed onto the seat with a force, which is equal to the area of the circle formed by the contact area times the fluid pressure:
| (14) |
For the simplicity, it is assumed that the system can be described locally as the contact between a cylinder and a flat plane. This leads to the following equations, if bulk deformations are neglected:
| (15a) | |
| (15b) | |
| (15c) |
Here, is a constant, which is . It has been shown that this simplification leads to good agreement with the numerical FEM [19]. A consequence of this simple model is, that the results do not depend on the material’s elastic properties. It is not possible to define a hard contact area using a soft contact model, because the contact pressure will never vanish completely for any point on the surface. As explained in Section 2.2, an approximation for the contact area is needed. In this case, a possible approximation would be , where is the deviation of the Gaussian bell curve in Equation (15). With this simple model, the radial contact area does not depend on the contact pressure.
How the maximal contact pressure of the fluid pressure depends and the seat’s angle can be seen in Figure 5. This graph can be used to validate the results obtained using the FEA method.
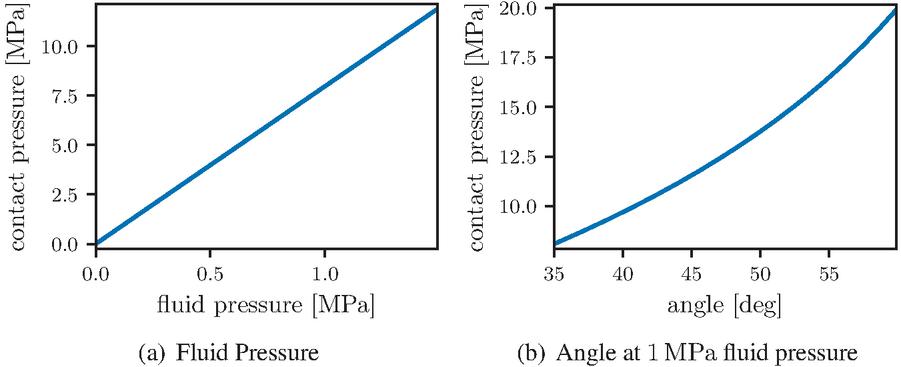
Figure 5 Approximative analytic dependency of the maximal contact pressure on different quantities.
3.2 FEM Implementation
The elastic contact problem has been solved using the Abaqus FEM suite by Simulia. Depending on the model, either a 3D model of the valve or a 2D cylindrically symmetrical model is used. A triangular or a tetrahedral mesh is used respectively. Second order elements are used in order to account for the roundness of the ball and the valve realistically. In case of the 2D model the element type CAX8R has been used; the 3D model consists of elements of the type C3D15. The deformations which are applied on the 3D model conserve some of its symmetries. Therefore, only one fourth of the model needs to be simulated.
The contact is implemented using a soft contact model in both cases, which allows an overlap of one surface plane into the other. In order to achieve convergence of the model and to allow the software to define a contact area, a cutoff of the exponential contact relation is needed. This cutoff is chosen to be .
It is important to perform a convergence test in order to ensure meaningful results. In this work, the contact area and the contact pressure are of special interest. Therefore, convergence needs to be ensured for these quantities. The convergence has been tested examining the change of the maximum of the contact pressure, see Equation (16), with increasing mesh density.
| (16) |
The contact pressure is a better variable to check for convergence than the contact area, because the contact area is linked directly to the number of elements at the contact.
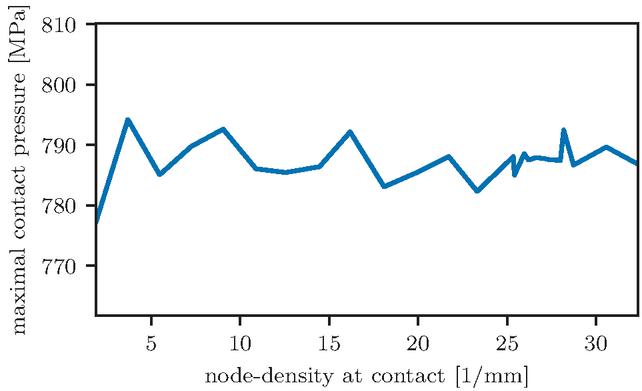
Figure 6 Convergence test for the 2D case. The maximal pressure in the contact area is converging with higher mesh-density.
An example for a convergence test is depicted in Figure 6. The fluctuations decrease with a rising number of elements in the contact area. The density of notes is illustrated in Figure 7. It shows two different meshes of the same model with a different average density of nodes.
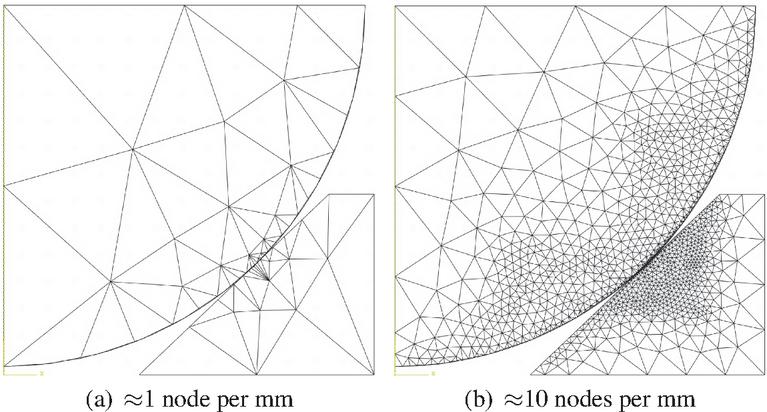
Figure 7 Meshes of the 2D FEM model with a different node-density on the edge of the seat. At the top of the ball, a uniform load has been applied. The bottom and the right edge of the seat are fixed by boundary conditions. The whole model is constrained by the rotational symmetry.
3.3 Evaluation of the Simulated Results
The leakage depends on the contact pressure and contact area. It is mainly influenced by the radial part of the contact area , the tangential part of the contact area and the maximum of the contact pressure . The tangential contact area can be calculated directly from the geometry. The other properties can be gathered from the finite element analysis.
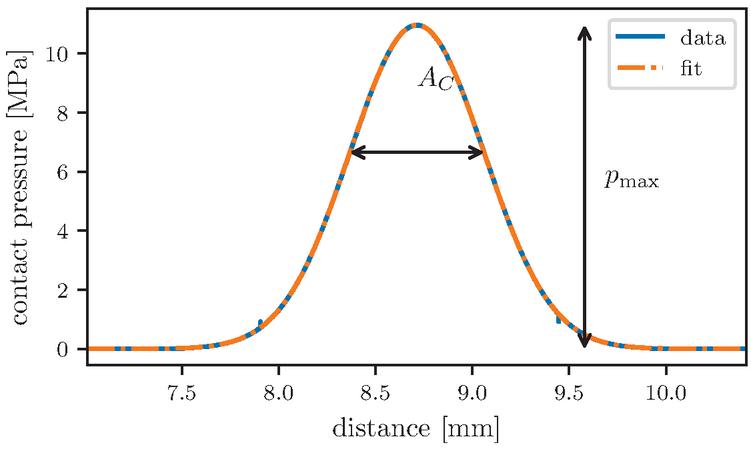
Figure 8 Gaussian fit of contact pressure in radial direction.
Figure 8 illustrates how the variables are defined and suggests how they can be obtained from the results of a simulation. The pressure distribution in radial direction has a Gaussian shape. Persson’s method is dependent on an arbitrary choice of a radial contact area. In this work, the choice has been used, where is the deviation obtained as a fitting parameter. It should be close to the analytic deviation seen in Equation (15).
4 Results
The following section shows the results of the FEM calculation. A realistic ball seat valve has been calculated. A sketch of the valve can be seen in Figure 9.
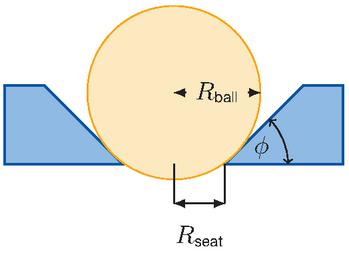
Figure 9 Sketch of the ball seat valve.
The geometric specifications listed in table 1 have been used if not stated otherwise. The listed specifications are typical for industrial ball seat valves.
Table 1 Geometric specifications of the valve
| Property | Value |
| radius of ball | |
| inner seat radius | |
| angle of slope | |
| out-of-roundness of seat | |
| fluid pressure | |
| Young’s module | |
| hardness of seat | 609 HV 0.2 |
| Poisson’s ration | 0.3 |
The elastic properties of the materials have been taken from literature. The seat’s hardness has been measured using Vicker’s method. Only the hardness of the softer body is important, which, in this case, is the seat.
4.1 Influence of the Fluid Pressure
The fluid pressure is implemented by applying a force on top of the ball. According to Equation (14), the force can be set to a value, so that it has the same effect as a static fluid pressure acting on the ball.
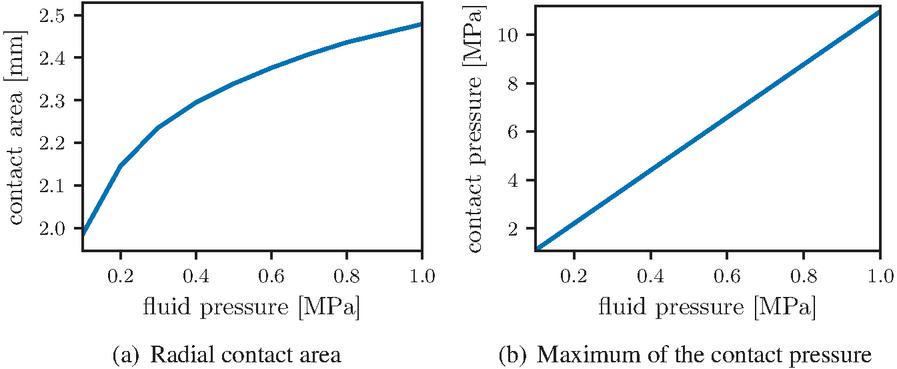
Figure 10 Influence of the fluid pressure on the maximal radial contact area and the maximal contact pressure.
Figure 10 depicts the results of the calculations with variable pressure. The calculations are in good agreement to the semi-analytic calculations seen in Figure 5. Due to the increased computational cost, the following quantities are analyzed using the axially symmetric model only.
The contact area has been set to the distance of the first and the last node of the mesh which are in contact. These values have been compared to Abaqus’ output variable CAREA which represents the whole contact area in , and they are compatible, see Figure 11.
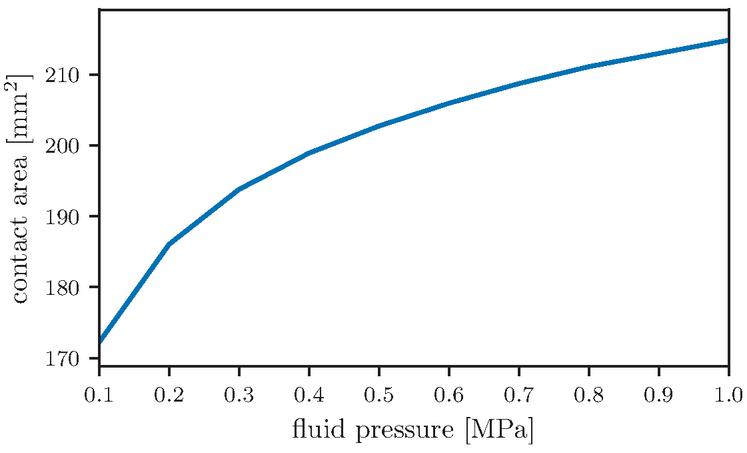
Figure 11 Influence of the fluid pressure on the total contact area.
With rising fluid pressure the normal force increases. The increased normal force leads to a larger contact area and a higher pressure peak. An increase in these quantities will lead to a reduction of the leakage according to Section 2.2. This has also been shown experimentally [12]. In this case, the pressure drop between the cavity above and below the seal increases, as well. This leads to an overall decrease in leakage for higher fluid pressures.
The calculated leakage can be seen in Figure 12. The graph shows a linear increase of the leakage for a rising fluid pressure. For very high pressures the leakage decreaes due to the dominance of plastic deformation.
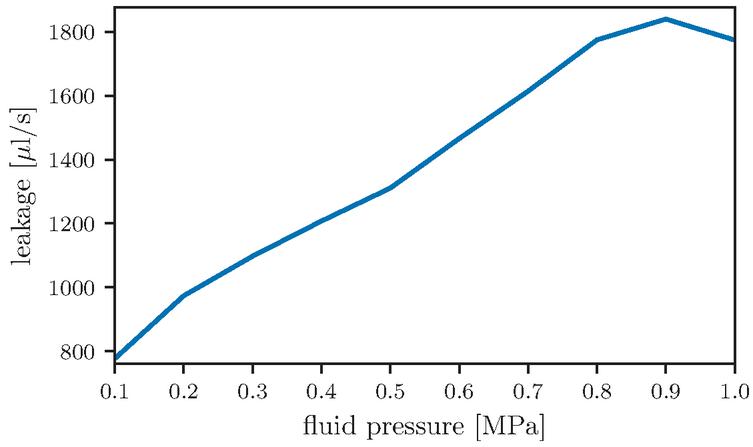
Figure 12 Influence of the fluid pressure on the leakage.
4.2 Influence of the Angle
In another series of simulations the influence of the angle of the conical seat on the contact area has been analyzed.
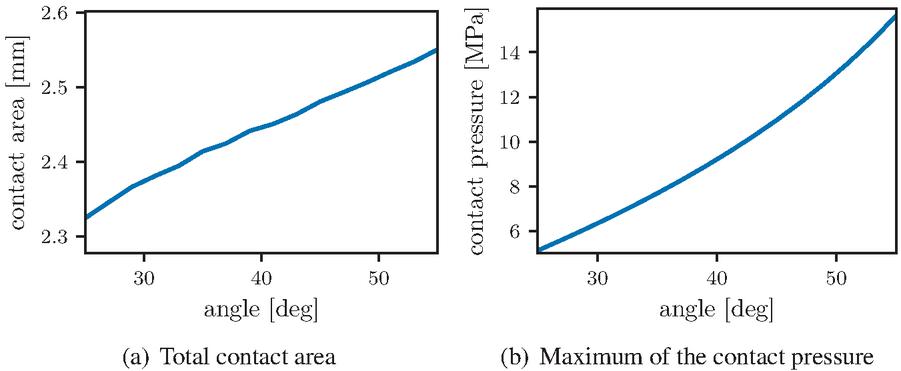
Figure 13 Influence of the angle on contact.
The results can be seen in Figure 13. With angle , both the contact area and the peak of the contact pressure increase. The fluid pressure is kept constant in this simulation. With increasing angle, the area of the circle which is bordered by the contact edge increases, as well. This leads to a rising normal force according to Equation (14). The change in normal force is most probably the reason for the rise of both quantities. In consequence, a steeper angle will lead to smaller leakage.
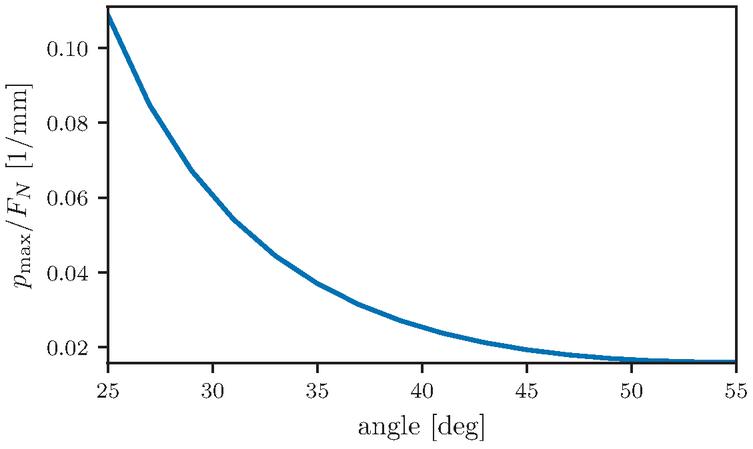
Figure 14 Relation between the maximum of the contact pressure and the effective normal force.
Figure 14 shows that for an approximately constant force very steep and very flat angles provide better sealing. The radial contact area relative to the normal force has a similar U-shape. Therefore, with constant normal force both flat angles and steep angles will increase the seal tightness.
In reality though the force is not the controlled variable, but the fluid pressure. Thus, Figure 13 gives a better overview of which geometries provide the better sealing properties. This leaves steep angles as the optimal geometry for seats with respect to sealing.
A problem with this consideration is the increased circumference of the contact circle which can also be called the tangential contact area. The leakage is going to increase linearly with the circumference and thus linearly with the circle’s radius. This is an antagonist to the increased contact pressure. Figure 15 depicts their relation. It can bee seen, that the ratio decreases with increasing values of . From this perspective we expect an increased leakage for steeper angles.
This problem can only be solved exactly by calculating the leakage based on the results under the consideration of the surfaces’ properties.
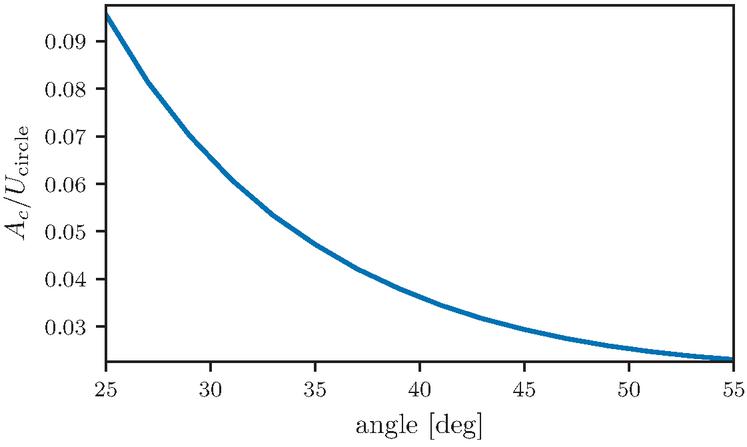
Figure 15 Relation between the radial contact area and the tangential contact area . Their influence on the leakage is approximately .
Figure 16 shows the relative change of leakage depending on the seat’s angle. It can be seen, that the leakage increases by up to 20 % for steep angles and is decreased by up to 60 % for small angles. At least for this specific surface, small angles provide a better seal tightness.

Figure 16 Influence of the seat’s angle on the leakage compared to the leakage at .
4.3 Curvature
Another possible geometric property of a ball seat valve is the curvature of a spherical seat. Let be the maximal distance between the sealing surface of the seat without curvature and the bend curvature. denotes a convex surface and a concave surface. The meaning of this variable is illustrated in Figure 17.
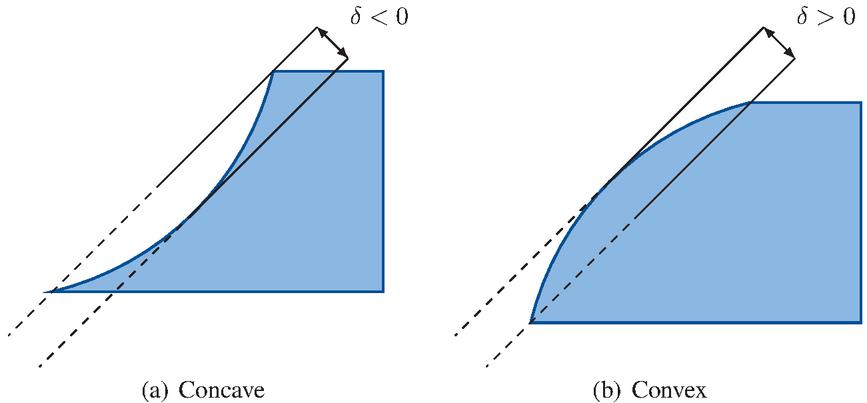
Figure 17 Seats of different curvature.
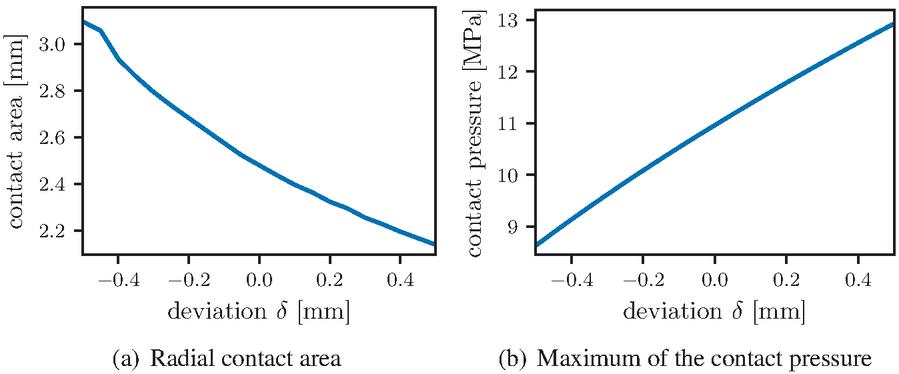
Figure 18 Influence of the seat’s curvature.
Figure 18 depicts the influence of the deviation on the contact area and the contact pressure. The contact area is higher for concave seat surfaces, whereas the maximum of the contact pressure is lower as compared to convex surfaces. A higher maximum in contact pressure suppresses leakage while a smaller radial contact area results in a higher leakage. The optimal configuration needs to be found by a concrete calculation of the leakage.
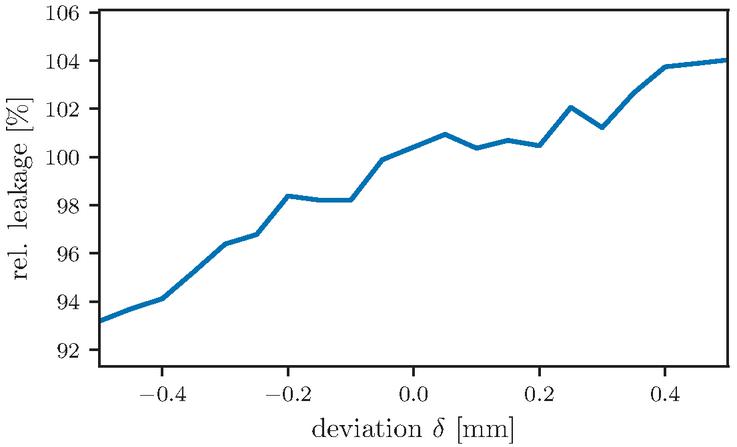
Figure 19 Influence of the curvature on the leakage compared to the leakage without curvature .
Figure 19 depicts the calculated leakage depending on the curvature. It can be seen, that convex surfaces provide a better sealing for this specific surface. The change in seal tightness has only a small dependency on the curvature as compared to the angle.
4.4 Out-Of-Roundness
The technical definition of the out-of-roundness is the difference between two radii of two circles which enclose the physical circle. The physical non-ideal circle does not leave the enclosing circles at any point. The concept of the technical out-of-roundness is illustrated by Figure 20.
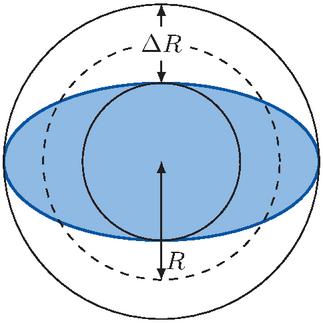
Figure 20 Illustration of out-of-roundness.
In this work, valves of are analyzed based on their eccentricity , assuming elliptic deformations. Ellipses can be created systematically to fit a given out-of-roundness. Another advantage of the eccentricity as compared to the definition of out-of-roundness is the independence of the radius. At smaller radii, the same out-of-roundness has a greater impact than for larger ones. This is especially useful for seats, because they possess a range of different radii along their surface.
The eccentricity for an ellipse with a semi-major-axis and a semi-minor-axis , see Figure 21, is defined as:
| (17) |
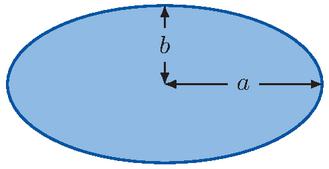
Figure 21 Sketch of an ellipse.
The eccentricity corresponding to the technical out-of-roundness at radius can be found via:
| (18) |
Measurements of the roundness of physical valves have shown that seats do indeed possess a very small elliptic deviation. In case of the physical representation of the seat, which is modeled in this work, the out-of-roundness at the lower radius is approximately . This corresponds to an eccentricity of .
Elliptic seats can only be analyzed using three-dimensional simulations. They are far more computational expensive as compared to two-dimensional calculations. This is why the following calculations are performed using a lower accuracy and fewer samples as for the 2D simulations.
The simulations revealed that the full contact between the ball and the seat is lost at an eccentricity of . This corresponds to an out-of-roundness of . At this point, no sealing at all can be provided with the given fluid pressure.
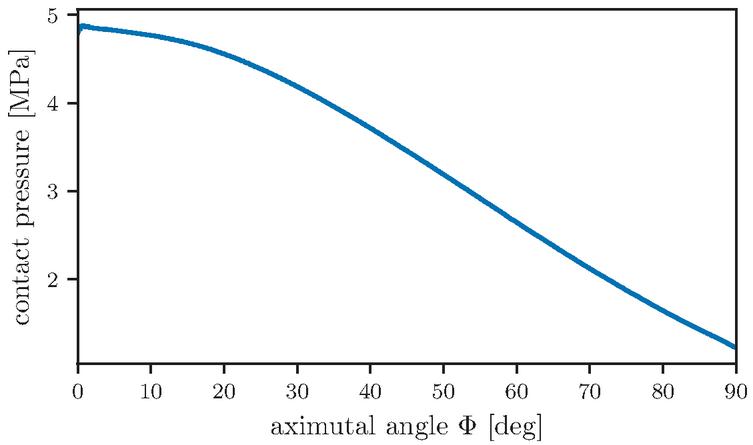
Figure 22 Curve of pressure along the horizontal contact circle for .
The point of an ellipse which is most far from its center is called the vertex. The closest point is called the co-vertex.
In Figure 22 is an example for a contact curve. The contact pressure can be seen as in relation to the azimuthal angle . equals the co-vertex and equals the vertex. The maximal contact pressure is reached at the co-vertex and the minimal contact pressure at the vertex. The coarseness of the graph is a spurious effect due to the mesh not being fine enough. It can be refined using more computing resources.
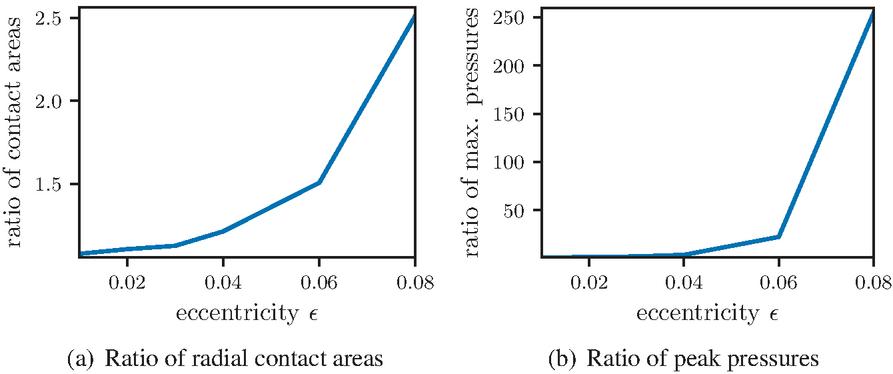
Figure 23 Change of the ratios of contact properties between the vertex and the co-vertex with increasing eccentricity.
Figure 23 shows how the contact area and the peak of the pressure of the co-vertex change with changing eccentricity relative to the vertex. The contact pressure and the radial contact area are the smallest at the edge which is formed by the vertex. This is why this point is most responsible for the leakage. The radial contact area and the contact pressure at the vertex is depicted in Figure 24.
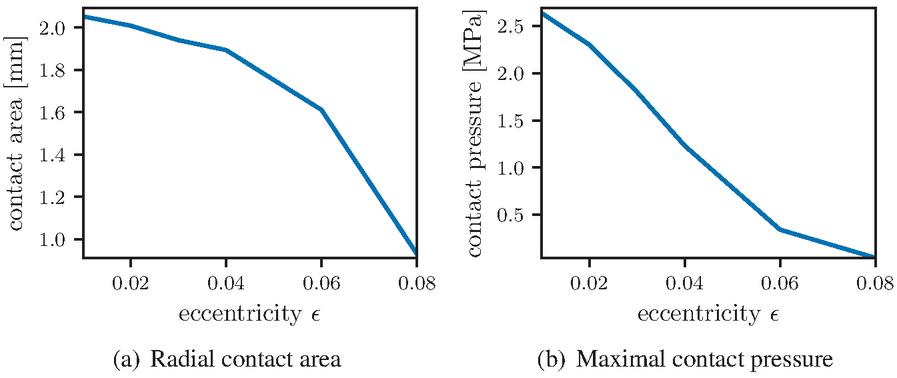
Figure 24 Influence of the seat’s eccentricity on the contact area and the contact pressure at the vertex.
Both the maximal contact pressure and the radial contact area decrease non-linearly with increasing eccentricity. This is why the eccentricity is potentially very important for the leakage. The exact influence needs to be determined by a full calculation of the leakage under the consideration of the surfaces’ properties. The results of this calculation is shown in Figure 25.
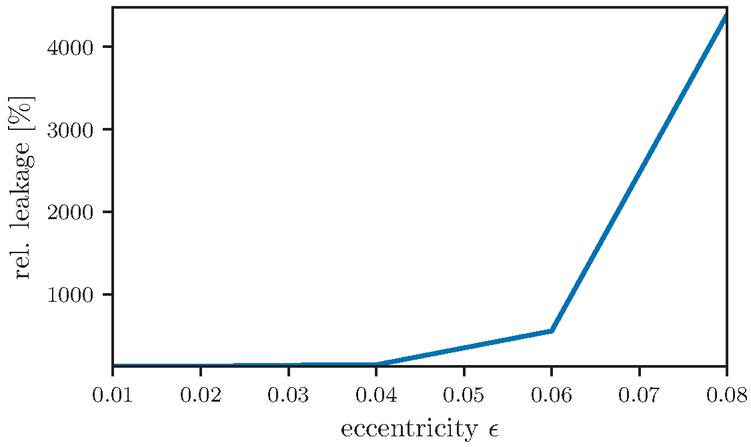
Figure 25 Influence of the seat’s eccentricity on the leakage.
For small eccentricities of below the increase in leakage is negligible. Above that, the leakage increases drastically with increasing out-of-roundness, until the ball loses contact at the vertex. Therefore, a small out-of-roundness is not important for the production of tight valves, unless the eccentricity surpasses a certain critical value, which might depend on the material’s properties and the roughness of the surface. The exact dependencies of the this threshold need further investigation.
5 Outlook and Further Considerations
The influence of the geometry on the contact pressure and the contact area can be calculated using finite element analysis. Their effects on the leakage have been calculated using an exemplary surface. The seat’s angle has a large impact on the tightness. At constant fluid pressure, smaller angles reduce the leakage. The curvature of the seat has a small impact compared to the angle. The eccentricity does not influence the leakage meaningfully up to a certain threshold.
Future works can also provide more detailed simulations of three-dimensional. This way properties which cannot be reflected in a two-dimensional model such as the out-of-roundness can be calculated more accurately. Resources can also be used to analyze the effects an eccentricity has on the influence of the angle or curvature of the seat.
The techniques which have been used in this work to analyze ball seat valves can be applied to other geometries of valves using hard-hard contact, as well.
This paper sets the first step towards a full and accurate calculation of leakage at ball seat valves. The here presented results can be used as a tool on developing an optimized seat geometry.
Acknowledgment
This work was funded by the German Research Foundation (DFG) in the scope of the Project “Modellbildung metallischer Dichtsitze” (MU1225/42-1). The authors would like to thank DFG for its support.
Simulations were performed with computing resources granted by RWTH Aachen University under project rwth0495.
References
[1] F. Fischer, N. Bauer, H. Murrenhoff, and K. Schmitz, “Finite element analysis of the hard-hard contact in seal valves,” in 2020 IEEE Global Fluid Power Society PhD Symposium, 2020.
[2] V. L. Popov, Kontaktmechanik und Reibung: Ein Lehr-und Anwendungsbuch von der Nanotribologie bis zur numerischen Simulation. Springer-Verlag, 2009.
[3] B. B. Mandelbrot and J. R. Wallis, “Noah, joseph, and operational hydrology,” Water resources research, vol. 4, no. 5, pp. 909–918, 1968.
[4] B. B. Mandelbrot, D. E. Passoja, and A. J. Paullay, “Fractal character of fracture surfaces of metals,” Nature, vol. 308, no. 5961, pp. 721–722, 1984.
[5] J. Moreira, J. K. L. da Silva, and S. O. Kamphorst, “On the fractal dimension of self-affine profiles,” Journal of Physics A: Mathematical and General, vol. 27, no. 24, p. 8079, 1994.
[6] A. Balankin, D. Morales, O. Susarrey, I. Campos, F. Sandoval, A. Bravo, A. García, M. Galicia, et al., “Fractal properties of fracture surfaces in steel 1045,” International Journal of Fracture, vol. 106, no. 2, pp. 21–26, 2000.
[7] B. Persson and C. Yang, “Theory of the leak-rate of seals,” Journal of Physics: Condensed Matter, vol. 20, no. 31, p. 315011, 2008.
[8] B. Persson, “On the fractal dimension of rough surfaces,” Tribology Letters, vol. 54, no. 1, pp. 99–106, 2014.
[9] B. Lorenz and B. Persson, “Leak rate of seals: Effective-medium theory and comparison with experiment,” The European Physical Journal E, vol. 31, no. 2, pp. 159–167, 2010.
[10] H. Murrenhoff, Fundamentals of Fluid Power: Hydraulics. Shaker Verlag Gmbh, 2014.
[11] B. N. Persson, “Fluid dynamics at the interface between contacting elastic solids with randomly rough surfaces,” Journal of Physics: Condensed Matter, vol. 22, no. 26, p. 265004, 2010.
[12] M. Schmidt, Dichtheit als Entwicklungsschwerpunkt für Sitzventile hochdynamisch schaltender Zylinderantriebe. PhD thesis, RWTH Aachen, 2009.
[13] T. Mielke, K. Schmitz, X. Ayala Galindo, and M. Rückert, “Experimental investigation of the hard-hard contact in seat valves,” in The Sixteenth Scandinavian International Conference on Fluid Power, 2019.
[14] B. Persson, “Leakage of metallic seals: role of plastic deformations,” Tribology Letters, vol. 63, no. 3, p. 42, 2016.
[15] B. N. Persson, “Theory of rubber friction and contact mechanics,” The Journal of Chemical Physics, vol. 115, no. 8, pp. 3840–3861, 2001.
[16] V. L. Popov and M. Heß, Method of dimensionality reduction in contact mechanics and friction. Springer, 2015.
[17] F. Fischer, K. Schmitz, A. Tiwari, and B. Persson, “Fluid leakage in metallic seals,” Tribology Letters, vol. 68, no. 4, pp. 1–11, 2020.
[18] B. N. J. Persson, “Relation between interfacial separation and load: A general theory of contact mechanics,” Phys. Rev. Lett., vol. 99, p. 125502, Sep 2007.
[19] F. Fischer, C. Peng, H. Murrenhoff, and K. Schmitz, “Research on leakage characteristics of metallic seals based on soft/hard contact theories.” 2020.
Biographies

Felix Fischer received the master’s degree in Physics from RWTH Aachen University in 2019, specializing on solid state physics. He is working as a scientific associate at the Institute for Fluid Power Drives and Systems (ifas). His research is focused on the simulation of metallic seals.

Niklas Bauer studied mechanical engineering at RWTH Aachen University. Before graduating with a master’s degree in 2019, he was a student research assistant at the Chair and Institute of General Mechanics and the Chair for Computational Analysis of Technical Systems. He is a member of the scientific staff at ifas. His research interest is the numerical simulation of sealing friction.

Hubertus Murrenhoff is the former director of the Institute for Fluid Power Drives and Systems (ifas), formerly named Institute for Fluid Power Drives and Controls (IFAS) at RWTH Aachen University, Germany. Main research interests cover hydraulics and pneumatics including components, systems, controls, simulation programs and the applications of fluid power in mobile and stationary equipment.

Katharina Schmitz graduated in mechanical engineering at RWTH Aachen University in 2010 with part of her studies at Carnegie Mellon University in Pittsburgh (USA) and working in Le Havre (France). In 2015, Prof. Schmitz graduated as Dr.-Ing. Since March 2018 she is full professor at RWTH Aachen University and Director of the institute for Fluid Power Drives and Systems.
International Journal of Fluid Power, Vol. 22_2, 173–198.
doi: 10.13052/ijfp1439-9776.2222
© 2021 River Publishers