Control of the Test Rig for Spring Stiffness Measurement with Hydraulic Integrated Actuator and Computer Vision
Petr Noskievič1,* and Melvin Alexis Lara De León2
1Faculty of Mechanical Engineering, VŠB-Technical University of Ostrava, Ostrava – Poruba, Czech Republic
2Faculty of Electrical Engineering and Computer Science, VŠB-Technical University of Ostrava, Ostrava – Poruba, Czech Republic
E-mail: petr.noskievic@vsb.cz; Vinmel24@gmail.com
*Corresponding Author
Received 05 December 2020; Accepted 06 December 2020; Publication 06 February 2021
Abstract
The paper deals with the control of the test rig for measurement of the stiffness of the spring. The test rig is equipped with integrated hydraulic actuator and multilayer control system with computer vision to automate the testing process and to increase the safety of the operating staff during the testing. The integrated hydraulic actuator allows to control the piston velocity and position and to produce the force needed for the spring compression and stiffness measurement. It has an integrated manifold with four proportional flow control valves connected as the full hydraulic resistance bridge. Each control valve is controlled separately using the input signal. That makes it possible to realize different connections and control strategies of the hydraulic cylinder using the different control algorithms. The hydraulic circuit was modelled and simulated, and the achieved simulation results are presented in the paper. The test rig is controlled using the microprocessor control system and is it equipped by different transducers – position transducer, pressure transducers and force transducer to be able to collect data important for the stiffness characteristic evaluation. The upper level of the control system is created by the vision control system. The goal of the implementation of the machine vision is to decrease the number of the manual operations done by the technician by the spring testing and to extend the automatic testing cycle of the automatic computer vision-controlled movement of the actuator at the beginning of the testing cycle and finally to increase the safety of the operating staff. The structure and functionality of the designed control system, experimentally obtained results and evaluated stiffness characteristic of the tested spring are presented in the following chapters.
Keywords: Integrated hydraulic actuator, spring stiffness, control, computer vision, distance measurement, human detection.
1 Introduction
High power to weight ratio, good controllability of pressure and flow, high dynamics, fast time response, simple transformation of the hydraulic power in the mechanical power of the longitudinal motion are the most important properties of the hydraulic drives determining their use in the production machines, manipulators, robots and testing equipment. The extremely high power installed in hydraulic driven machines places demands on the ensuring the safety of the operating staff during the working cycle.
The control of the power transmission in the hydraulic driven machines is realized using the controllable pumps and flow control valves. In recent years, the efficiency of the power transmission in fluid power systems has become the goal of the development of the new components and systems. The power to weight ratio of the axial piston pumps increased approximately three times, and of the pilot-operated valves approximately fifteen times (Garbacik and Stecki, 2000). Decreasing the weight of the hydraulic components is one way how to be competitive with electrical drives. Another way is the application of the control systems and the design of the hydraulic systems with controllable components. The use of the modern pumps with variable geometric volume allows to realize the displacement control, or the fix-displacement pump can be controlled by the speed controlled AC-motor and the similar control strategies leading to the higher efficiency can be applied (Watton, 1989, Murrenhoff, 2008). High dynamic hydraulic drives and control of different quantities – velocity, pressure, force – are very often done using the resistance control and flow control valves. The high dynamics, accuracy and easy integration into the control system is the advantage of the valve technology (Backé, 1984, Jelali and Kroll, 2004). The resistance control is typically realized using the spool, which is placed in the control valve and creates four synchronously operated hydraulic resistances. The losses due to the pressure drop across the valve, the control resistances, and also the asymmetric behaviour of the drive by the use of the differential cylinder are the disadvantages of the valve-controlled drives (Noskievič, P. 2018).
In order to eliminate the disadvantages of the valve-controlled cylinder, the full hydraulic resistance bridge was realized by means of the four proportional flow control poppet valves. The manifold with these four poppet valves was designed as compact as possible to the hydraulic cylinder, and in this way, the integrated hydraulic actuator was developed (Noskievič, 2018). The use of the full hydraulic bridge realized using the independently controlled four flow control valves, and the application of the integrated hydraulic actuator in the test rig for spring stiffness measurement are described in more details in the next chapters.
The control system of the test rig is a multilayer control system. The first layer connected to the hydraulic valves and transducers is realized using the programmable controller ECU-0710, which communicates with the master PC controlling the testing. The realized computer vision system is installed on the next computer and it is connected to the master PC. This machine vison system called Inspection system is working with two cameras. One camera evaluates the distance between the actuator and spring at the beginning of the testing cycle, and the second camera evaluates the human presence in the working area of the test rig. The integration of the Inspection system into the test rig control system and the data flow is shown in Figure 1.
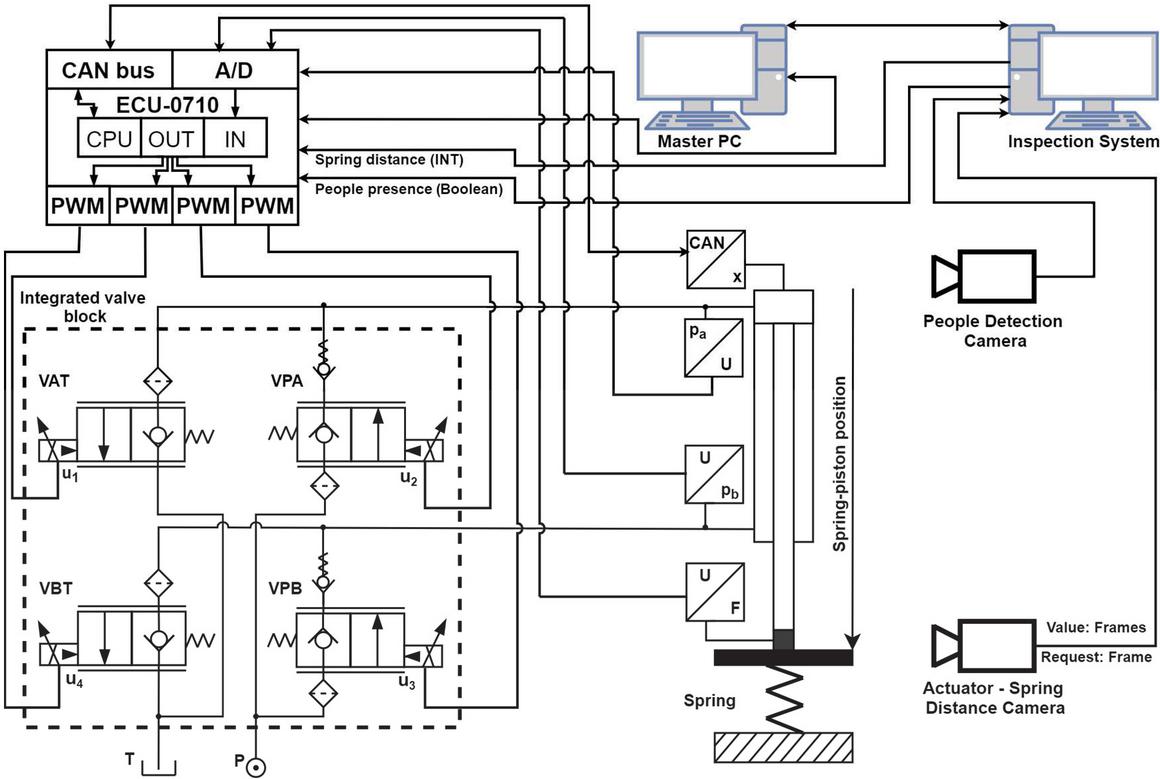
Figure 1 Structure of the control system with computer vision of the test rig with integrated hydraulic actuator.
The automatic control of the integrated hydraulic actuator in the test rig for spring stiffness measurement and the implementation of the machine vision control system allowing the improving of the automation and safety of the testing cycle are described in more details in the next chapters.
2 Test Rig Description
2.1 Structure of the Test Rig
The developed test rig with hydraulic integrated actuator for spring stiffness characteristic measurement is shown in Figure 2. The hydraulic actuator is placed in a vertical position in the frame of the test rig (Mohan, 2019). The piston of the actuator is going down by the extending motion and after achieving the upper end of the spring it starts to compress the tested spring.
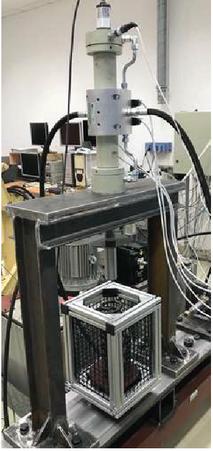
Figure 2 Test rig with the integrated hydraulic actuator for spring stiffness measurement.
The compression of the spring is done very slowly to obtain correct data for the followed evaluation of the spring characteristic and stiffness calculation. The cylinder is equipped with the integrated linear position sensor and with the pressure sensors for the measurement of the pressures in the cylinder chambers. The force transducer is installed on the piston rod.
The structure of the hydraulic circuit and the connection of the actuator to the control system is shown in Figure 1. The movement of the piston rod is controlled using the full hydraulic resistance bridge realized using four proportional solenoid – operated valves. These valves are installed in the manifold which is placed on the hydraulic cylinder very close to the chambers of the hydraulic actuator to make the hydraulic capacities as small as possible. The control valves and installed sensors are connected to the control system ECU-0710, Figure 2. The ECU-0710 is a general-purpose programmable controller and can be used as a stand-alone controller, or for integrating into a CAN network with other devices (Zaid, 2019). The ECU-0710 controller is connected to the PC, which allows to program the ECU, collect and evaluate the obtained data and finally to operate with the system in automatic testing mode.
2.2 Testing Cycle
The testing cycle starts with the placement of the spring in the spring holder by the laboratory staff. The measuring process starts with the slow movement of the piston to the upper end of the spring to touch them, next the compression of the spring and the measuring of the variables begin. The ECU reads the piston position from the position sensor (Mohan, 2019, Zaid, 2019). The spring compression required is entered by the user as an input. Using this compression required value, the controller calculates the desired piston position. Depending on the actual piston position, the ECU gives the control signal to the integrated valves accordingly. If the piston needs to move from the upper position to the lower position, Figure 2, then the ECU gives the command signal to input valve VPA and output valve VBT. If the piston needs to move upwards, then the command is given to input valve VPB and output valve VAT. This is how the piston moves to the desired position.
The goal of the implementation of the machine vision system is to observe the movement of the actuator down to the spring and using the image processing to evaluate the distance between the actuator and the spring. The obtained value is used to calculate the point where the actuator has to reduce the velocity in order to slowly compress the spring.
The next improvement is the safety. Since the human presence is necessary at the beginning of the testing cycle by the placement of the spring in the holder, it will be used the second camera to constantly evaluate if there is a human presence in the working space of the actuator during the testing cycle (Noskievič and Lara de Leon, 2020)
3 Hydraulic Drive
3.1 Hydraulic Actuator with Integrated Control Valves
The actuator is created by a differential hydraulic cylinder with one side piston rod controlled using the four proportional flow control valves connected in the full hydraulic bridge-type A+A, Figure 3 (Watton,1989, Backé, 1984, Murrenhoff, 2008, Gundlach, 2011).
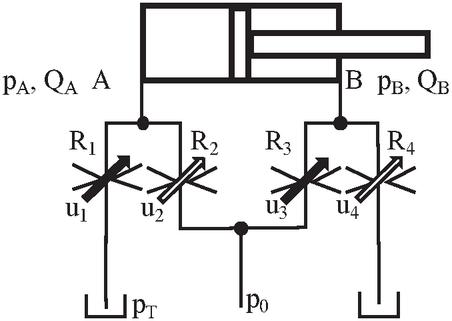
Figure 3 Hydraulic integrated actuator created from the hydraulic cylinder controlled using the full hydraulic bridge built from the four flow control valves.
These four proportional flow control valves are controlled using the four voltage inputs, i.e. using the four independent control signals u, u, u, u. This allows to use different control algorithms and optimize the behaviour of the actuator.
The disadvantage of the differential cylinder is asymmetric behaviour. The reason for that is the geometrical asymmetry due to the different areas in the piston and ringside characterized by the ratio
| (1) |
The asymmetric construction of the cylinder leads to the different hydraulic capacities of the cylinder chambers and asymmetric velocity-load force characteristic, which causes the different piston velocity by extending and retracting of the piston of the cylinder controlled in the open loop. It means that the velocity gain of the open-loop system depends on the direction of the motion – piston velocity (Watton, 1989, Murrenhoff, 2008, Noskievič, 2018). The course of the pressures in the cylinder chambers A and B and the limits for the pulling and pushing external force acting on the piston rod during the motion are next properties which should be taken into account by the design of the drive based on the differential cylinder is. The maximal allowed values of the load forces depend on the motion direction. The analysis of the static and dynamic properties of the differential actuator and their compensation by the control using the full hydraulic Wheatstone bridge was done and can be found in (Watton,1989, Murrenhoff, 2008, Noskievič, 2018, Jelali, and Kroll, 2004). The fact that each orifice in the hydraulic resistance bridge can be controlled separately allows to achieve the compensation of the pressure asymmetry in the cylinder chambers instead of using the valves with the special spool with different flow areas S, S characterized by the ratio
| (2) |
The control of the separate proportional valves using the suitable generated input signals allows to set the valve opening, i.e. cross-section areas of the corresponding valves to the given ratio or to the similar value or keep some valve fully opened and control the flow and movement only using one resistance. The full hydraulic resistance bridge offers a significant potential for different control algorithms, and improvement of the properties of the resistance controlled differential cylinder.
3.2 Simulation of the Testing Cycle
3.2.1 Simulation model of the test rig
The simulation model of the whole test rig was built in the simulation program MATLAB-Simulink. The simulation model is based on the mathematical models of the hydraulic cylinder, proportional flow control poppet valves, connections, models of the transducers and finally on the model of the tested spring. After adding the controller, it allows simulating the whole testing cycle (Noskievič, 2018, Jelali and Kroll, 2004). The hydraulic cylinder is placed in a vertical position, and the force of gravity should be considered. When the spring force acts on the piston the motion equation for the piston position x has the form
| (3) |
where is the force of spring depending on the spring stiffness k and spring compression x, F is the gravitational force, F is the Coulomb friction , m is the mass, B viscous friction coefficient, S and S are the surface area of the piston side and rode side.
Pressures p, p in the cylinder chambers are given by the differential equations for the hydraulic capacities C and C
| (4) | ||
| (5) | ||
| (6) |
The poppet valve is modelled as a variable orifice created by a cylindrical sharp-edged stem and conical seat (Mathworks, 2020). The flow through the poppet valve is proportional to the valve opening and nonlinear depending on the pressure drop p across the valve
| (7) |
where , PB, AT, BT, is the passage area depending on h. The minimum pressure for turbulent flow p is given by
| (8) |
where p is average pressure from pressures on the inlet and outlet of the valve, p is atmospheric pressure, and B is constant (Mathworks, 2020). The poppet dynamics was modelled using the second-order differential equation for the valve opening in dependence on the input voltage u.
The parametrization of each component of the simulation model was done using the available data from the datasheet of the producer.
3.2.2 Simulation of the testing cycle
Using the built and verified simulation model, the whole testing cycle was simulated. The courses of the important state variables of the hydraulic actuator – piston position x, piston velocity v, pressures p, p in the cylinder chambers and the spring force during the testing cycle by control using the same four control signals, i.e. the coefficients are equal to one for each valve, are shown in Figure 4.
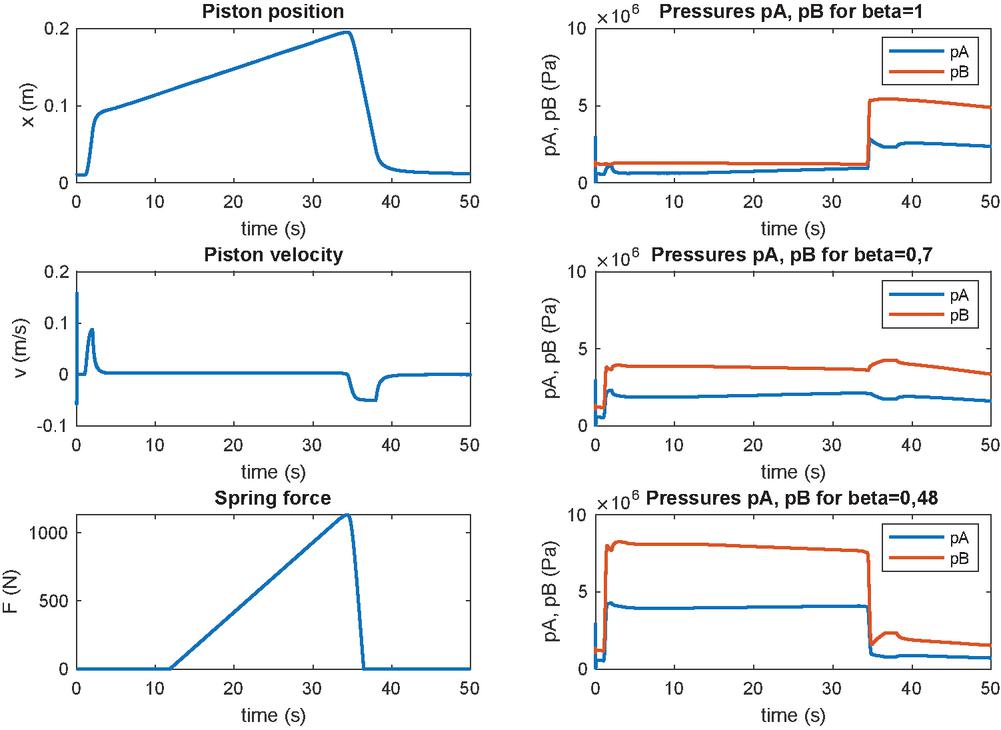
Figure 4 Simulated state variables during the testing cycle (left) and pressures p, p for , , (right).
The courses of the pressures p and p for are typical for the differential cylinder and extension motion of the piston. Especially at the beginning, when the force of gravity is pulling the piston rod and later when the additional force of the compressed spring acting in the opposite direction is small, the pressures are very low and close to zero.
The impact of the different control signals to the valves VPB and VBT for equal to is observable from the pressures p, p, whose values are significantly higher and are getting closer to the value of the system pressure, Figure 4. For higher value of equal to 0.7 the opening of the valves VPB and VBT is about 70% of the other valves, and the chamber pressures are higher than in the first case for equal to one, but the pressures did not achieve the values as in the case for equal to , Figure 4.
Separate control of each proportional flow control valve makes it possible to use different valve opening for each valve, i.e. to set different values of the ratio in specific phases of the working cycle of the machine and in this way to optimize the behaviour and also the energy efficiency of the installed hydraulic system.
4 Installed Computer Vision System
The computer vision system was developed and installed to fulfil following two goals:
• The determination of the distance between the actuator and the spring. This value is used for the evaluation of the set point of the piston rod of the hydraulic cylinder. This information, where is the upper end of the spring, is important for the initial movement of the actuator. The piston rod must achieve the upper end of the spring slowly, touch the spring softly and start the compression.
• The detection of the human in the test rig working area to increase the safety of the testing process. The actuator moves with a high power during the testing cycle. This power can be dangerous in case of a human being approaches to the actuator or to the spring while the system is running.
The testing of the spring starts with the placement of the spring into the test ring and definition of the testing cycle parameter of the compression. After installation of the computer vision system it is not necessary to type the height of the spring by the operating staff. From this information the piston position at the beginning of the testing cycle, beginning of the spring compression, was calculated. The extension of the control system of the computer vision allows now to also control this initial phase of the testing cycle fully automatically. The distance between the upper end of the spring and the end of the piston rod is evaluated using the computer vision system. The obtained value is delivered to the closed loop position control system and the desired value of the piston position is automatically computed.
The placement of the tested spring in the test rig is done by the operational staff manually. Afterwards the testing procedure is started. To guarantee the safety it is important to know, that the human is not present in the working area of the test rig.
4.1 Estimation of the Distance Between the Actuator and Tested Spring
To estimate the distance between the actuator and tested spring, it is necessary to detect the presence and location of the spring within the working region in the test rig. Two different methods for object detection were evaluated – the method using the classifier based on neuronal network and the method using the features of the object, which was finally implemented. The first mentioned method was not used, because it was important to train the classifier with thousands of models and with a huge amount of the backgrounds to get the correct results and the time for the code to obtain the object’s position was too long. The detection method based on the feature of the object – the colour was applied (Lara de Leon, 2020).
In the next step it was important to select specific colour to avoid noises and whose HSV/RGB values were not part of the rest of the scene in the laboratory. To find the most suitable colour to track, it was printed the colour spectrum and then it was placed within the working region. Using “trail/error” method it was found the proper colour to track within the laboratory frame. The most suitable color to filter is a dark blue, in the specified range: H 50,255, S 0,255, V 0,36. The actuator and the spring were painted – marked with this colour. By filtering this specific colour, now there is the possibility to track it, verify its shape, calculate its moment and calculate its area.
Figure 5 shows the painted spring and actuator and how the pixels corresponding to the actuator and end of the spring were found – filtered from the HSV frame.
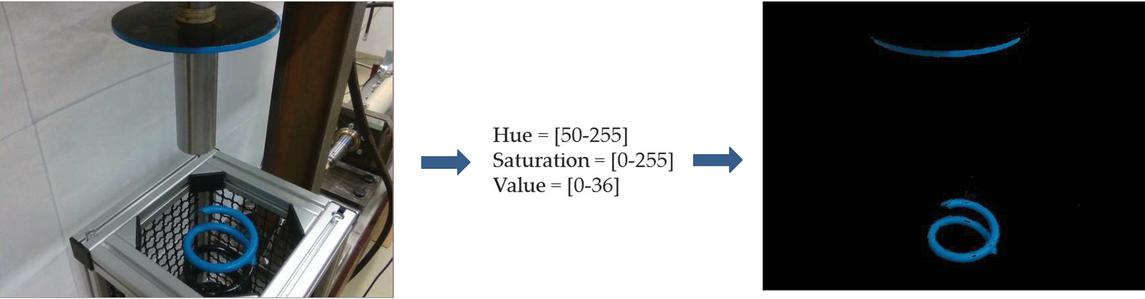
Figure 5 Painted actuator and spring and finding these objects in the filtered frame.
After the colour filtering and the proper identification of the position of the specific pixels from the depth Frame, it was necessary to track specific pixels. The used Intel Realsense Camera has different frames, in this application were used two of them, the RGB and the depth frame. These two frames are obtained from two different lenses which are in different positions in the camera. To be able to properly work with them it was necessary to align them in order to have the pixels located in the same position. The alignment process is not 100% accurate, therefore the position of pixels which are placed specially in edges will be constantly changing. To avoid any mistake, the logic to track the pixel from the spring is: Calculating the centre point within the first 50 nearest pixels to the Y axis which ensures the correct measure of the distance, Figure 6.
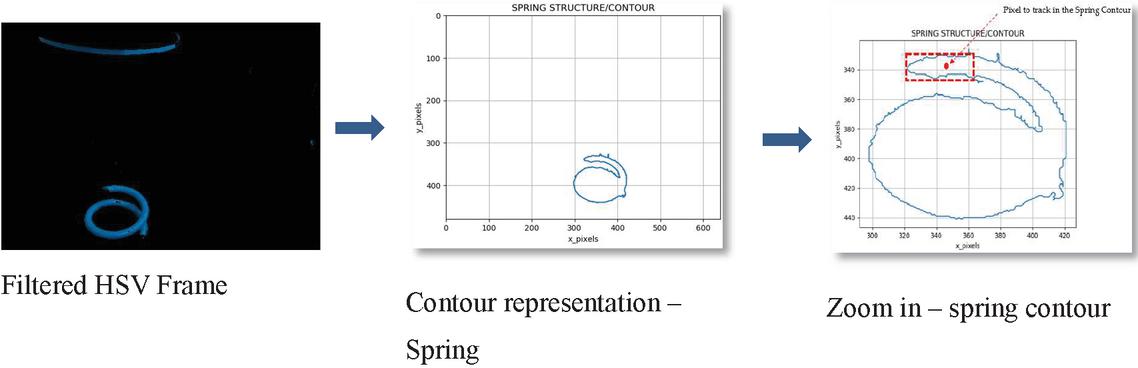
Figure 6 Contour of the spring and spring pixel selection.
The algorithm of the actuator is simpler than the spring’s one since the selection of the pixel is not nearby to any edge. Because of the shape of the actuator contour, the pixel is in the middle of X axis and in case of the Y the distance it will be taken the closest pixel to the border, Figure 7.
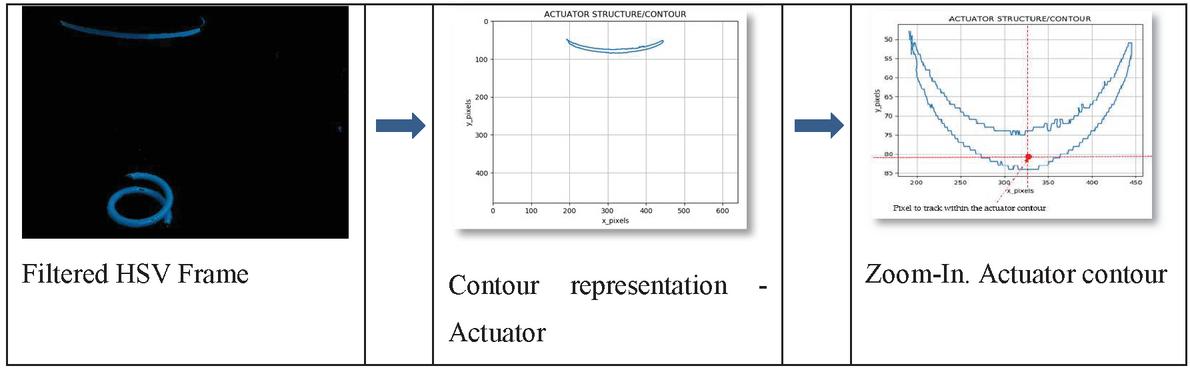
Figure 7 Actuator contour and pixel selection.
After finding this point and getting the X and Y position of this pixel in the RBG frame, the same pixel position is tracked the Depth Frame, Figure 8. The depth frame is colorized representation of the pixel distances. The infrared sensor provides the distance of a specific number of pixels (based on the selected resolution). Then, the algorithm converts these distances into a pre-defined range of colours. This depth representation ranges from Red – Blue, meaning Red close pixels, Blue far pixels. After getting the X, Y position of the pixels in the HSV frame, the algorithm looks for the same pixels in the depth frame and extracts the X, Y, Z distance in the camera coordinate axis.
Coordinate axis transformation is performed to match with the actuator coordinate system.
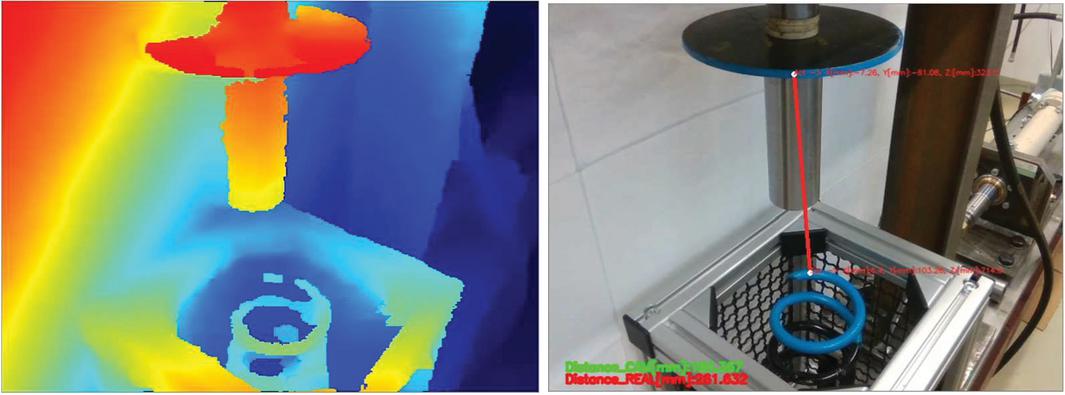
Figure 8 Depth Frame and distance evaluation.
The library of the camera allowed to obtain the space position of the pixel from the camera coordinate system. The X, Y and Z position of the pixels are obtained from the camera coordinate system. The actuator moves in another coordinate system; therefore, it was necessary to transform the points to make them matched with the actuator coordinate system.
The movement of the actuator occurs in the Y axis, therefore, the equation to be used will calculate the rotation of the point in the X axis, uniquely, since this is the only axis we need to match. The angle is equal to 12 degrees, approximately, and it is given by the installation of the camera. If the spring position is given by the coordinates [X Y Z] and the actuator position is described by the coordinates [X Y Z] the final position of the spring is given by (Acosta, 2016)
| (9) |
and the final actuator position is given by
| (10) |
The distance d between the actuator and piston rod, i.e. between these two pixels is
| (11) |
4.2 Human Detection within the Operating Space of the Test Rig
The algorithm to detect any human presence within the working space is evaluating the data from the second camera placed accordingly in front of the test rig. The idea was to cover an area wide enough to protect the user from any injury. It was verified experimentally, then if the user is at least 1.15 meters away from the camera, he is safe and the machine can run, otherwise if the user is less than 1.15 meters away, the actuator must stop the movement (Lara de Leon, 2020).
The used algorithm is based on the neuronal network (NN) doing the Single Shot Detection (SSD). SSD speeds up the process by eliminating the need of the region proposal network. To recover the drop-in accuracy, SSD applies a few improvements including multi-scale features and default boxes. These improvements allow SSD to match the Faster R-CNN’s accuracy using lower resolution images, which further pushes the speed higher. According to the following comparison, it achieves the real-time processing speed and even beats the accuracy of the Faster R-CNN. Accuracy is measured as the mean average precision map: the precision of the predictions (Liu et al., 2015).
SSD has two components: a backbone model and SSD head. Backbone model usually is a pre-trained image classification network as a feature extractor. This is typically a network like ResNet trained on ImageNet from which the final fully connected classification layer has been removed.
We are thus left with a deep neural network that can extract semantic meaning from the input image while preserving the spatial structure of the image albeit at a lower resolution (Faugeras, 1993).
It was not necessary to train the NN for itself, since it was taken the already trained file from the SSD paper, however it was necessary to adapt the neural network file to be used the python script. The script passes the frames through the NN and it obtains the corresponding class, location and accuracy, within. To determine the pixel to track, it will be used the location output, since it is composed by 4 points around the detected object. The centre point is calculated from the location array. After finding the corresponding pixel, then an algorithm is used to obtain the distance of the very same pixel but in the Depth Frame, Figure 9.
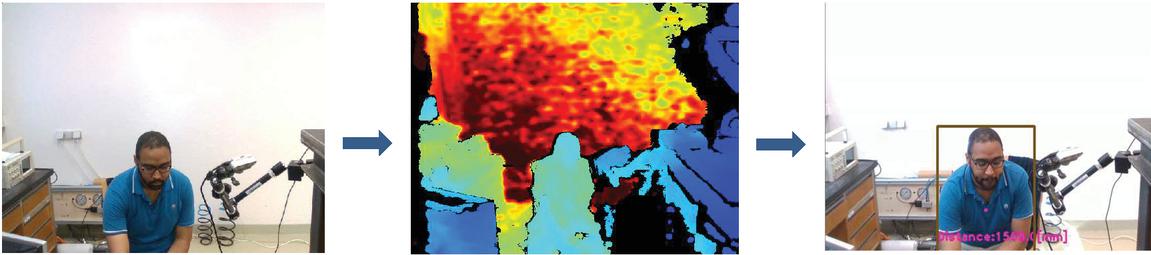
Figure 9 Human detection frames.
4.3 Technical Realization of the Computer Vision System
Technical realization of the computer vision system is based on the installation of two cameras type Intel RealSense depth camera D435. The camera system has two main components, Vision processor D4 and Depth module. The Depth module incorporates left and right imagers for stereo vision with the optional IR projector and RGB colour sensor. The installation of the cameras was done as it is shown in the Figure 10. The camera for the inspection system was located to capture as best as possible the depth and RGB frames.
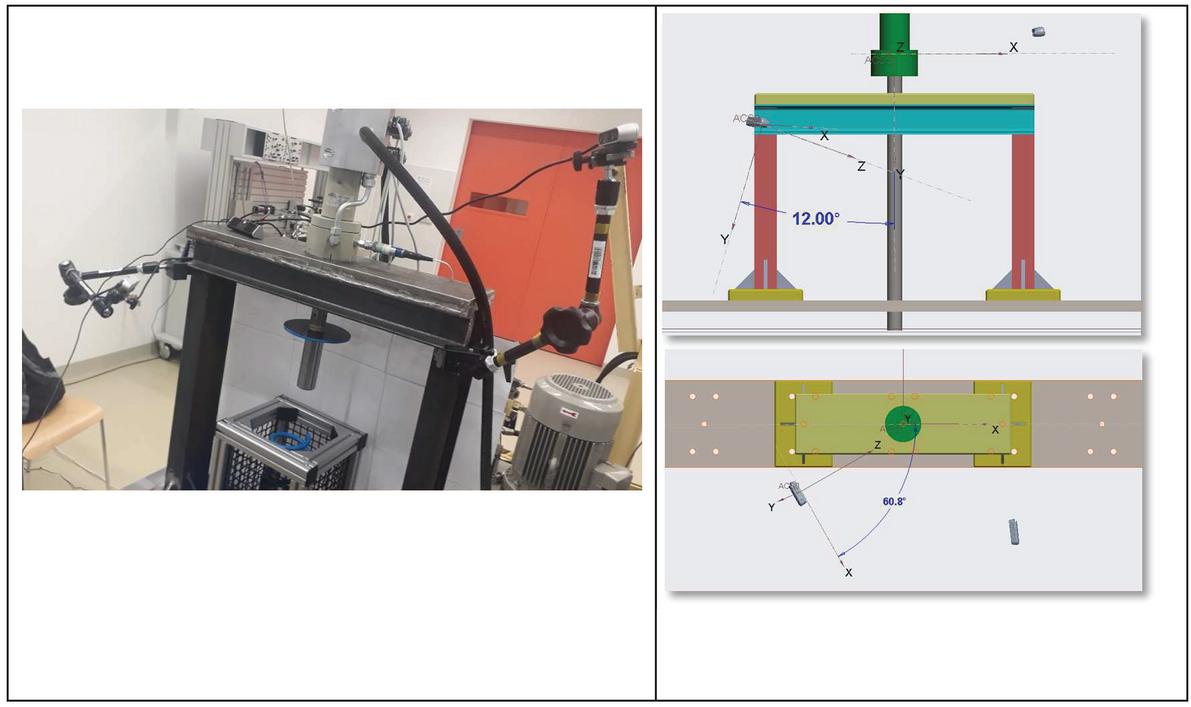
Figure 10 Installation of the cameras on the test rig – left, placing of the cameras in the coordinate system – right.
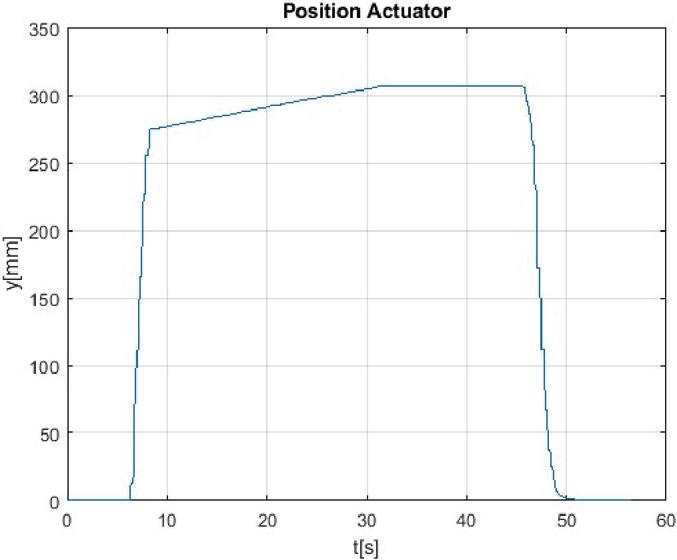
Figure 11 Measured actuator-piston position due to the testing cycle.
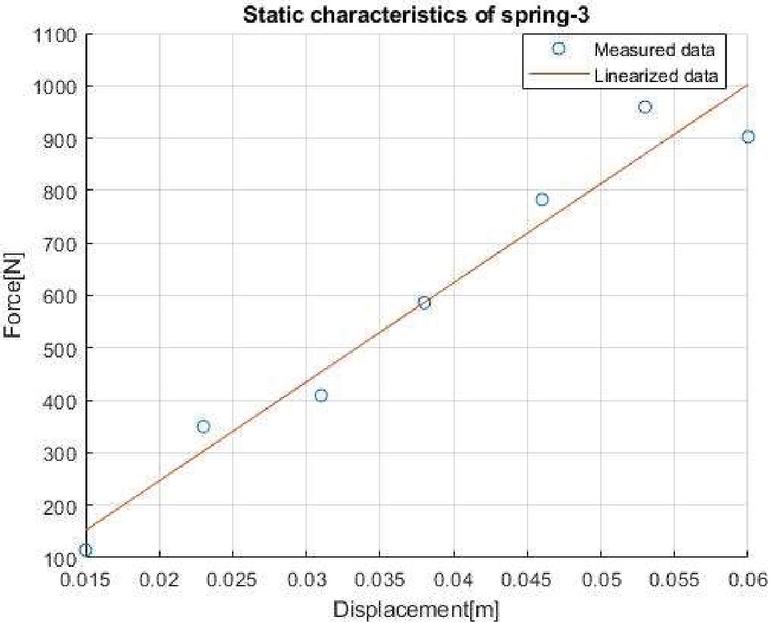
Figure 12 Measured values of the spring force in the dependence on the spring compression and calculated stiffness characteristic of the spring.
One important factor in the whole vision system is the cycle time, specially how long it takes to send the value to the controller for the use. Of course, the cycle time depends on the used resolution. The cycle time of the actuator-spring distance estimation was evaluated for three resolutions , or pixels. For the applied resolution pixels the cycle time was 0.103 s. The achieved accuracy of the estimated distance is for the given camera position 0.78 mm/pixel. These values are acceptable for the control of the actuator movement. The cycle time of the people detection was 1.3616 s for the same resolution pixels. The accuracy of the depth frame is 1 % of the distance from the object that the camera is seeing. This value is acceptable for both applications.
Both mentioned parameters the cycle time and the accuracy, depending also on the camera resolution, depends on the used hardware – the computer and cameras. The industrial cameras can have higher resolution as well as shorter cycle time, but there are more expensive. Also, the industrial control system can evaluate the obtained data faster and offer shorter cycle time. The presented computer vision system was developed and realized at the laboratory conditions with the affordable equipment, which allowed the verification of the designed algorithms and used methods.
5 Measurement Results
An example of the achieved results by the testing of the car springs is shown in Figures 11 and 12. The graph in Figure 11 is showing the piston displacement and in Figure 12 the evaluated spring characteristic is presented. The stiffness constant N/m was evaluated from the measured data using the linear regression as a slope of the obtained spring characteristic.
6 Conclusions
The test rig controlled by the control system equipped with the computer vision system and the automatic testing cycle for the evaluation of the spring characteristic and the spring stiffness constant was introduced in the paper. The tested spring is compressed using the hydraulic actuator with integrated full hydraulic resistance bridge realized using the proportional flow control valves. The fact that the control of the movement of the piston is done using the four independent control signals instead of one input signal in case of the use of the traditional 4/3 proportional flow control valve allows to optimize the allowed pulling force and the course of the pressures in the cylinder chambers. This is the advantage of the use of the full hydraulic bridge of A-A type. The control of the drive was realized using the ECU-071 controller, which was connected to the master PC where the final evaluation of the spring characteristic and the calculation of the stiffness constant were done. The master PC is communicating with the Inspection system PC where the developed computer vision system has been installed.
The computer vision application ensures the measuring of the distance between the actuator and the spring and the people detection in the working space of the test rig. For the evaluation of the measured distance the colour-filtering method was used. The selected blue colour allowed to decrease noises around the area and to avoid wrong structure/pixel detection during the routine. The achieved accuracy a cycle time allowed to automate the testing cycle especially at the starting phase when the actuator is touching the spring. Thanks to the installed machine vision the control system can navigate the actuator fully automatically, without knowledge of the length of the tested spring and entering this value into the control system and the actuator is able to touch the end of the spring softly. The second developed and installed function of the vision system, i.e. the people detection, helps to increase the safety of the testing. The Single Shot Detection method was used for the people detection in the working area of the test rig. The actuator runs only if there is not person presence within the selected region. Also, by this application the achieved cycle time for the selected resolution allowed to fulfil the task and increase the safety of the testing process. The computer vision system was realized in the laboratory using two cameras and PCs and the achieved results confirmed the functionality of the developed algorithms. To improve the achieved parameters, i.e. the cycle time and accuracy, it is necessary to use the computer with better processor or a processor itself which can be dedicated only to work the image processor algorithms. The use of industrial cameras can offer also higher resolution and finally higher accuracy.
The presented results of the fully automated testing of the car spring confirm the functionality of the designed and realized test rig and control system with computer vision.
Acknowledgment
This work was supported by the European Regional Development Fund in the Research Centre of Advanced Mechatronic Systems project, CZ.02.1.01/0.0/0.0/16_019/0000867 within the Operational Programme Research, Development and Education and the project SP2020/57 Research and Development of Advanced Methods in the Area of Machines and Process Control supported by the Ministry of Education, Youth and Sports.
References
Acosta, J. C. 2016. Astronomía de Posición – Cambios del Sistema de Coordenadas. Transformación de Coordenadas. Retrieved from https://silo.tips/download/astronomia-de-posicion-localizacion-astronomica-y-geodesica-definicion-de-geodes
Backé, W. 1984. Servohydraulik. RWTH Aachen.
Faugeras, O. 1993. Three-dimensional computer vision: a geometric viewpoint. Cambridge: MIT Press.
Garbacik, A., Stecki, J. 2000. Developments in Fluid Power Control of Machinery and Manipulators. Fluid Power Net Publication. Cracow. ISBN 83-86219-71-8.
Gundlach, M. 2011. Efficient Regeneration. In: Proceedings of the 21 International Conference on Hydraulics and Pneumatics. June 1–3 2011, Ostrava, Czech Republic, pp. 21–28. ISBN 978-80-248-2430-7.
Intel Realsense Technology. 2019. Intel Realsense Technology. Retrieved 01 2020, from Intel Realsense Technology: https://www.intelrealsense.com/wp-content/uploads/2019/10/Intel-RealSense-D400-Series-Datasheet-Oct-2019.pdf
IntelRealsense Technology. (n.d.). Intel Realsense Technology. Retrieved from Intel Realsense Technology: https://www.intelrealsense.com/depth-camera-d435/
Jelali, M., Kroll, A. 2004. Hydraulic Servo-systems: Modelling, Identification and Control. Springer, ISBN 1852336927.
Lara de Leon, M.,A. 2020. Design of the Vision Control System for the Mechatronic System. Diploma thesis, Faculty of Mechanical Engineering, VŠB-Technical University of Ostrava.
Liu, W., Anguelov, D., Erhan, D., Szegedy, C., Reed, S., Fu, C.-Y., & Berg, A. C. 2015. SSD: Single Shot MultiBox Detector. Cornell University.
Mathworks. 2020. Poppet valve. https://www.mathworks.com/help/physmod/hydro/ref/poppetvalve.html. R2020a.
Mohan, Y.S.C., 2019. Design of the Test Rig of the integrated Actuator. Diploma thesis, Faculty of Mechanical Engineering, VŠB-Technical University of Ostrava.
Murrenhoff, H. 2008. Servohydraulik - Geregelte hydraulische Antriebe. IFAS RWTH Aachen. Shaker Verlag GmbH. ISBN 978-3-8322-7067-4.
Noskievič, P. 2018. Control of Linear Hydraulic Actuator using the full Hydraulic Bridge, 6p. In: Proceedings of the 19 International Conference on Research and Education in Mechatronics. June 7–8, 2018, Delft.
Noskievič, P., Lara de Leon, M.,A. 2020. Design of the Vision Control System for the Laboratory Test Rig. In: paper approved for the 21 International Conference on Research and Education in Mechatronics. December 9–11, 2020, Cracow.
Noskievič P., Zaid A.A., Mohan Y.S.C. 2021. Control of the Test Rig with Hydraulic Integrated Actuator for Spring Stiffness Measurement. In: Stryczek J., Warzyńska U. (eds) Advances in Hydraulic and Pneumatic Drives and Control 2020. NSHP 2020. Lecture Notes in Mechanical Engineering. Springer, Cham. https://doi.org/10.1007/978-3-030-59509-8_15
Watton, J. 1989. Fluid power systems. Modelling, Simulation, Analog and Microcomputer control. Prentice Hall International (UK) Ltd. ISBN 0-13-323197-6.
Zaid, A.A., 2019. Control Design of the Hydraulic Actuator with Integrated Control Valves. Diploma thesis, Faculty of Mechanical Engineering, VŠB-Technical University of Ostrava.
Biographies

Petr Noskievič born 1959 in Ostrava, Czech Republic. After dissertation (1987) he worked for 8 years in the industry in control of hydraulic drives. Since 2001 he is a professor at the VŠB-Technical University of Ostrava. He delivers lectures from Modelling and Simulation of Mechatronic system, System Identification and Control of Fluid Power Drives. He introduced bachelor and master study programme Mechatronics and is a supervisor and guarantor of the doctoral study programme Control of Machines and Processes at the Faculty of Mechanical Engineering. His main research areas are modelling, simulation and control of hydraulic drives.

Melvin Alexis Lara De León born in San Cristobal, Dominican Republic. Studied his bachelor’s degree at the Institute of Technology of Santo Domingo. After 4 years of work experience moved to Ostrava, Czech Republic to course a master’s degree in Mechatronics at the VŠB-Technical University of Ostrava (VŠB-TUO), focused his studies on Computer Vision and its integration with mechatronic System. Currently, he is coursing a PhD in “Decision-making support based on machine learning methods in industrial control systems” at the VŠB-TUO and working as a Computer Vision Specialist.
International Journal of Fluid Power, Vol. 21_3, 305–326.
doi: 10.13052/ijfp1439-9776.2131
© 2020 River Publishers