Framework for Simulation-Based Simultaneous System Optimization for a Series Hydraulic Hybrid Vehicle
Katharina Baer, Liselott Ericson and Petter Krus
Division of Fluid and Mechatronic Systems, Department of Management and Engineering, Linköping University, SE-581 83 Linköping, Sweden
E-mail: katharina.baer@liu.se; liselott.ericson@liu.se; petter.krus@liu.se
Received 25 September 2017; Accepted 04 September 2018; Publication 12 April 2019
Hybridization of hydraulic drivetrains offers the potential of efficiency improvement for on- and off-road applications. To realize the advantages, a carefully designed system and corresponding control strategy are required, which are commonly obtained through a sequential design process. Addressing component selection and control parameterization simultaneously through simulation-based optimization allows for exploration of a large design space as well as design relations and trade-offs, and their evaluation in dynamic conditions which exist in real driving scenarios. In this paper, the optimization framework for a hydraulic hybrid vehicle is introduced, including the simulation model for a series hybrid architecture and component scaling considerations impacting the system’s performance. A number of optimization experiments for an on-road light-duty vehicle, focused on standard-drive-cycle-performance, illustrate the impact of the problem formulation on the final design and thus the complexity of the design problem. The designs found demonstrate both the potential of energy storage in series hybrids, via an energy balance diagram, as well as some challenges. The framework presented here provides a base for systematic evaluation of design alternatives and problem formulation aspects.
Keywords: Simulation-based optimization, hydraulic hybrid vehicle, series hybrid, simultaneous design and control optimization, Hopsan.
1 Introduction
In the quest for increased energy efficiency in vehicular transmissions to lower fossil fuel consumption, hybridization is generally seen as a viable solution. A hybrid transmission contains at least two power sources and typically allows for storage of recuperated energy. In vehicular hybrid drivetrains, the traditional internal combustion engine (primary power source) is combined with a mechanical (flywheel), an electric (battery) or a hydraulic secondary energy storage (hydraulic accumulator). Hybrid electric vehicles are already found in many commercial applications, such as passenger vehicles (Yang et al., 2016). The hydraulic alternative is interesting for a number of reasons, the higher power density of hydraulic components compared to their electric counterparts in particular. Consequently, hydraulic hybridization of drivetrains lends itself most easily to existing hydraulic transmissions (off-road machinery), or to high power transient applications, such as city buses, (inner-city) delivery trucks and refuse collecting vehicles, whose usage profile is characterized by frequent braking and acceleration manoeuvres.
The main components of a traditional vehicle transmission, combustion engine and mechanical gearbox, are typically dimensioned according to maximum performance requirements (Guzzella and Sciarretta, 2005). This approach is usually applied to (hydraulic) hybrid transmissions as well (e.g. Surampudi et al., 2009), at times supported by parameter studies (e.g. Bowns et al., 1981). Research then focuses on determining optimal or nearoptimal control strategies for fuel efficiency and other targets (e.g. Filipi et al., 2004, Stelson et al., 2008).
Alternatively, the sizing of the system’s components and the control strategy can be viewed as a more integrated optimization problem (Reyer 2000), ranging from the previously described sequential approach to an entirely simultaneous design process. Typically, a variant of the bi-level optimization is employed: Karbaschian (2014) for example separates sizing and control aspects of a series transmission and initiates a new design iteration based on a final objective function evaluation. Li and Peng (2010) conduct a three-step process including feasibility check, control strategy and component optimization for a hydraulic power-split transmission. An example of simultaneous optimization is described by Kim (2008), where optimal control is applied to previously optimized designs in a second step. While traditional engineering approaches undoubtedly lead to solid designs, optimization can be used to explore, for example, design trade-offs (especially between component sizing and control parameters) and the impact of various design problem formulations in terms of variables, objectives and constraints.
This study addresses simultaneous component and control design for a hydraulic hybrid vehicle through simulation-based optimization (Carson and Maria, 1997, Krus, 2003). Simultaneous component and control optimization for (hydraulic) hybrid transmissions is computationally expensive and therefore often used only for systems with problems of reduced complexity, limiting the amount of detail and design parameters of the mathematical model used to evaluate a system. For the same reason, gradient-based optimization algorithms are frequently used; they are however more likely than, for example, population-based methods to end in locally optimal solutions. This paper describes a general simulation-based optimization framework, and implements as an example a series hydraulic hybrid vehicle (SHHV) transmission. It uses a dynamic simulation model, includes a rule-based control strategy and optimizes nine design parameters primarily for fuel economy subject to additional constraints, using a non-gradient-based optimization algorithm.
2 Optimization Framework
The general structure of the simulation-based optimization framework is shown in Figure 1. At the core of the framework is the simulation model with its modelling assumptions and parameters (independent system parameters), described in Chapter 3. The model is embedded in an optimization routine, which determines the design parameter values according to the optimization algorithm used. These are to be tested through simulation for the specified application. Explicit design relations capture properties derived from these design parameters, such as effects of component scaling (derived system parameters). The results of the simulation (system characteristics) are evaluated with regard to the fulfilment of specified performance requirements and the objective function. Chapter 4 details how the optimization aspects are implemented for the example application.
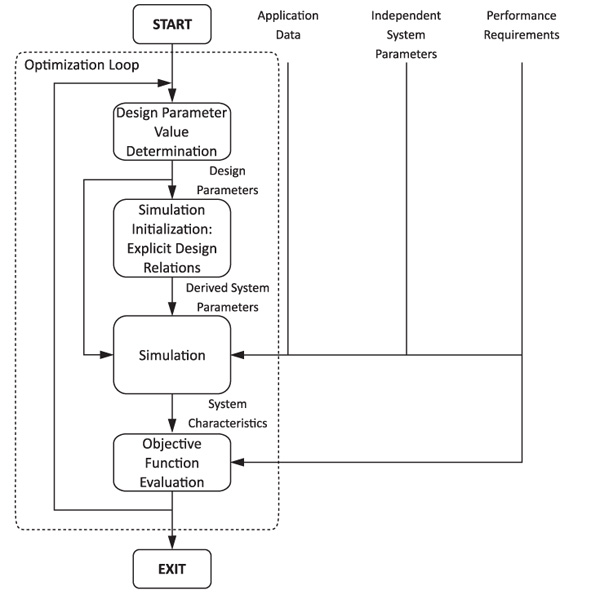
Figure 1 Simulation-based design optimization procedure (adapted from Krus, 2003).
3 System Modelling
At the centre of this study is a forward-facing simulation model of a series hydraulic hybrid transmission in Hopsan. Hopsan is a free simulation tool for multi-domain systems, developed at Linköping University (Eriksson et al., 2010).
3.1 System Architecture
Three basic configurations (topologies) are common for combining the different power sources in hybrids (Stelson et al., 2008). In a series hybrid as used in this study, the secondary technology is placed between primary source (engine) and power outtake (vehicle). Despite inherent power conversion losses, the decoupling of engine and vehicle operation offers a high potential for energy efficiency improvements by balancing the engine load and allowing engine shut-down if sufficient energy is stored.
The hydraulic hybrid vehicle is modelled as a generic, one-dimensional road vehicle, experiencing aerodynamic drag and rolling resistance, both assuming constant coefficients, and additional load for uphill driving. The vehicle is driven by a series hybrid architecture (Figure 2), containing a full hybrid hydraulic transmission with final drive between a diesel engine and the vehicle. The hydrostatic transmission consists of a variable hydraulic pump, driven by the diesel engine, a variable hydraulic pump/motor for power transfer to and from the vehicle, and a hydraulic accumulator for temporary energy storage, modelled as an open-circuit arrangement. The hydraulic circuit contains two pressure relief valves, and a check valve to prevent back flow from the accumulator to the pump, but also eliminating the possibility of starting the combustion engine from the energy storage (Kargul et al., 2015). The accumulator is permanently connected to the hydraulic circuit. A friction brake is implemented, which is only to be used when the braking capacity of the system is limited due to high system pressure.
For the system design optimization it is necessary to consider how to scale the major vehicle components. Variation of the component sizes affects both power properties and other attributes and thus the performance of the entire transmission. To ascertain the scaling relationships for the hydraulic components, published data from major manufacturers of components suitable for the desired pressure range were analysed (see Baer, 2018, for more details).
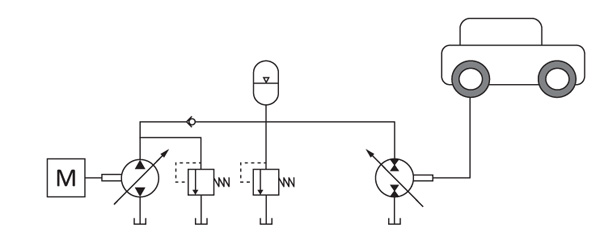
Figure 2 Basic system layout (simplified).
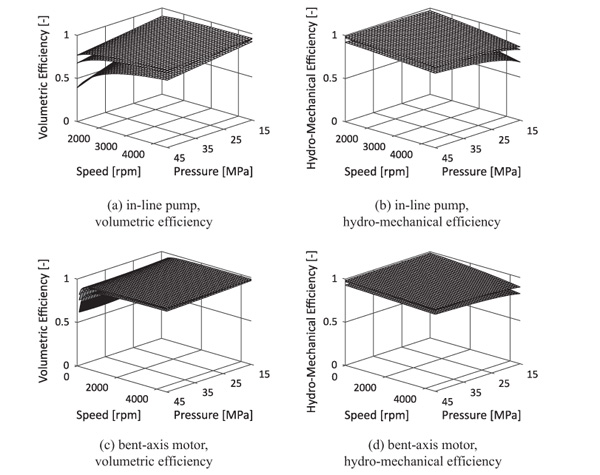
Figure 3 Efficiency maps for in-line pump and bent-axis motor with displacement settings of 1.0, 0.67 and 0.33.
3.1.1 Hydraulic pump and pump/motor
Both hydraulic pump and pump/motor are axial piston machines, the pump being of in-line type, whereas the pump/motor is of bent-axis design. Volumetric and hydro-mechanical losses are captured through efficiency models. Rydberg’s (1983) steady-state efficiency model has been parameterized to represent measurements made foran in-line pump and a bent-axis motor (Figure 3). For the pumping mode of the pump/motor the motor coefficients are reused, an assumption agreeing with trends in measurements made by Kargul et al. (2015). Dynamics for the displacement actuators are modelled with first-order low-pass filters.
The maximum speed-volumetric displacement relationship obtained for component scaling matches previous studies (e.g. Manring et al., 2014, see for example Figure 4 for the pump); overspeed operation under less-than-maximum displacement setting (Macor and Rossetti, 2011) is analysed for one machine of each type due to varying manufacturer specifications. Efficiency model adjustments are not considered during scaling. The hydraulic pump/motor scaling is based on data for hydraulic motors as suitable mass-produced component data is unavailable, with an adjusted component mass to take more complex component design into account.
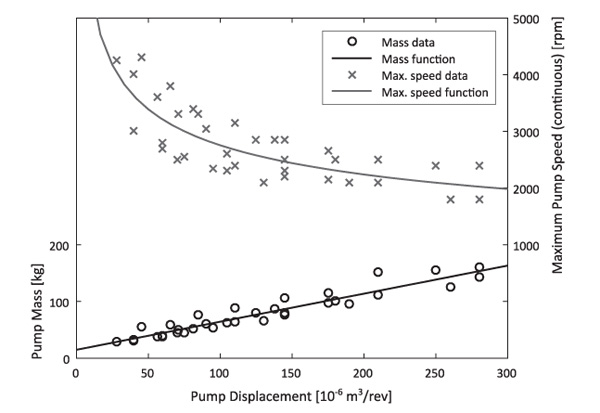
Figure 4 Pump scaling relationships for component mass and maximum continuous speed as functions of component displacement.
3.1.2 Hydraulic accumulator
In the hydraulic accumulator, the state of the compressed gas (nitrogen) is central in modelling the component’s behaviour. To capture the behaviour more accurately than through a polytropic process, the Benedict-Webb-Rubin equation is implemented. While heat transfer from the nitrogen to the oil is not modelled directly, the heat exchange with the accumulator’s environment is characterized by the accumulator’s thermal time constant.
The selection of accumulators focused on standard bladder-type accumulators, based on their favourable power density over piston accumulators. An experimentally obtained accumulator time constant (Nyman and Rydberg, 2001) is scaled to take into account variations in the accumulator surface area and the gas mass, the latter depending on the pre-charge conditions. A second accumulator is considered for the transmission mass as oil reservoir. Reduced weight using carbon-fibre and improved heat retention through fillings (most commonly foam, Otis and Pourmovahed, 1984) are beyond the scope of this study.
For the fuel consumption evaluation, the simulation of the SHHV assumes a fully discharged accumulator at the beginning of a driving mission, but ends with residual charge after the final braking. To take this asymmetry into account, the accumulator’s energy content Eacc for a given charge pressure can be determined approximately based on a polytropic process assumption as
where n is the polytropic exponent, V0,acc the accumulator volume, p0 the pre-charge pressure, and p1 the minimum operating pressure (Bowns al., 1981), with an assumed isotherm process between p0 and p1. p2 is for this estimation the accumulator pressure after full heat exchange between accumulator content and environment. Considering the wide pressure range necessary for hydraulic transmissions and variable ambient temperatures, the polytropic exponent is obtained from interpolation between Korkmaz’ (1975) tabular values. The accumulator energy content is then converted into an equivalent amount of diesel fuel based on its lower heating value.
3.1.3 Four-stroke diesel engine
For diesel engines, high-fidelity, but often computationally heavy, models based on the thermodynamic and combustion processes are available in literature (e.g. Assanis and Heywood, 1986, Wahlström and Eriksson, 2011), including aspects such as dynamics for fuel injection, the modelling and dynamics of a possible turbocharger, and temperature effects on the engine. Instead, the model is simplified here (similar to, for example, Kumar et al., 2007) to a speed-controlled engine, with internal first-order dynamics to take combustion dynamics into account (Tsai and Goyal, 1986). A steady-state map of the Brake Specific Fuel Consumption (BSFC, Digeser et al., 2005) is used to determine torque limitations (wide open throttle curve) and fuel consumption based on the current operating conditions. The inertia of the engine’s moving parts and flywheel is modelled as lumped inertia on the pump component.
The engine model assumes the fuel consumption during start-up to be equivalent to ten seconds of idle operation (Burgess et al., 2009) and acceleration time to idling speed to be 0.5 s (Kim, 2008). The start-up behaviour is simplified to a start-up torque matching the flywheel inertia and desired acceleration.
The diesel engine’s power is considered to be directly proportional to its maximum (rated) torque, as the speed range for a line of combustion engines is typically fairly similar, and assumed to be constant here. The engine’s wide open throttle curve is scaled in accordance with the rated engine torque. The fuel consumption of the diesel engine is captured through a scaled BSFC map without considering component-size-dependent adjustment. Assanis et al. (1999) discuss the shortcomings of this method, though their simulation experiments illustrate limited impact of more accurate scaling on final results. For the engine mass, data for various diesel engines were analysed; the inertia of the moving parts is scaled according to mass and geometry considerations.
3.2 Control Strategy
3.2.1 Control approaches
Besides dimensioning the main components of the hydraulic hybrid transmission, their appropriate control is of utmost importance for realizing a good fuel economy via energy recuperation or load balancing. In the supervisory control, control concepts address the power split between prime mover, secondary storage, and vehicle, explicitly or implicitly defining modes of operation for the hybrid. The lower level control deals with the operation of individual transmission components.
Control strategies can for example be classified according to their optimality and their online and real-time applicability (Karbaschian and Söffker, 2014). For globally optimal power management, perfect information about the driving sequence is required. The optimization of all control variables results in high computational load. Consequently, optimal control cannot be implemented online, and serves best as a benchmark or basis for other approaches.
Rule-based control strategies offer a simpler implementation at the expense of sub-optimality. For hydraulic hybrid drives, these typically entail a formulation of different operation modes and operating points based on the current power demand (e.g. Buchwald et al., 1979, Wu et al., 2002). More advanced power management approaches optimize the control for a limited prediction horizon (e.g. Deppen et al., 2010), or use an algorithm for power management that imitates previously derived optimal control (Sprengel and Ivantysynova, 2016).
3.2.2 Implemented control concept
For the present study, a simple yet robust power management strategy is required for the simultaneous component and control optimization. As general, supervisory control, the so-called thermostatic state-of-charge control is implemented, where predefined state-of-charge levels in the accumulator trigger specific engine operation modes (Wu et al., 1985), here with a pressure-based definition of the state-of-charge.
Following a similar control strategy as suggested by Kim (2008), the system’s state-of-charge triggers engine operation at either a target speed (corresponding here to the engine’s sweet spot) between a lower and upper limit, SoClow and SoChigh, or at a speed corresponding to the maximum power below SoClow. If the accumulator is sufficiently charged, the engine is switched off or set to idle. The general control strategy is extended to allow smoother operation and more flexibility with potentially higher performance:
- A dynamic definition of the state-of-charge limits considers the current acceleration demand and vehicle speed. This improves vehicle performance and controller robustness, while taking increased energy recuperation potential at high speeds into account. The parameter psplit characterizes the pressure level between the corresponding state-of-charge pressures towards which the limits converge at high speed.
- The initially discontinuous transition between different reference speed levels results in a so-called ‘bang-bang’ control characteristic. It is replaced through gradual transition in an interval around the state-of-charge limits to obtain smoother engine operation.
- At higher vehicle speeds, engine on/off operation becomes less desirable due to the time delay in power supply introduced by a start-up process. Consequently, total engine shutdown is prevented above a predefined speed, and the engine operates at the idling point instead if the accumulator is sufficiently charged.
The pump displacement setting is modulated to ensure engine operation close to the fuel-consumption-minimal line when transitioning between the target operating points, and limits the load on the engine if necessary to prevent stalling of the engine, but otherwise operates at full displacement to allow high efficiency. The pump load can lead to undesirably slow engine acceleration, which can be reduced by lowered pump displacement setting when accelerating.
As the pump/motor displacement setting determines the power transfer from transmission to vehicle, its controller is equivalent to a simple driver model. Its basic structure consists of a PI-controller, taking the reference speed from the drive cycle as well as the current vehicle speed into account. To prevent system failure, the pump/motor displacement setting is reduced – despite any current driver request – with the net flow out of the transmission relative to a design-dependent constant qref.
4 Implementation and Application of Optimization Framework
4.1 Vehicular Application
As example vehicle, a compact truck or light commercial vehicle is chosen (Table 1). This vehicle category allows for a gross vehicle weight of up to 3500 kg. For fuel consumption evaluations, the vehicle will be considered to be half-loaded.
The vehicle performance requirements in the following design optimization experiments are largely determined by standard drive cycles, the Urban Dynamometer Driving Schedule (UDDS), the New European Driving Cycle (NEDC) and the Worldwide harmonized Light vehicles Test Procedure (WLTP3), see Table 2. These speed profiles are closer to actual driving conditions in that they typically do not require extreme acceleration and maximum vehicle speeds, but remain for example within common legal speed limits. The three cycles utilized here have different countries of origin, but all include both inner-city and suburban driving. Both NEDC and WLTP3 also reach European highway speeds. While the drive cycles also differ with regard to testing procedure, for example in terms of cold or hot start of the engine, these aspects are not addressed. Limits on the trace error are also specified but could be systematically exploited for favourable fuel consumption.
For that reason, as main performance measure the total absolute deviation between reference and actual vehicle speed, vref(t) and vveh(t), relative to the total distance covered in the drive cycle, xcycle, is defined as Average Relative Velocity Deviation, ARVD:
Table 1 Basic vehicle data
| Kerb weight | 1800 kg |
| Load considered | 850 kg |
| Effective front area | 1.3 m2 |
| Effective wheel radius (incl. final drive) | 0.1m |
| Rolling resistance coefficient | 0.02 [-] |
| Default diesel engine | |
| Maximum torque | 367 Nm |
| Maximum power | 130 kW |
Table 2 Drive cycle comparison (Barlow et al., 2009, Tutuianu et al., 2013)
| Drive Cycle | tcycle [s] | xcycle [km] | vmax [km/h] | [m/s2] |
|---|---|---|---|---|
| UDDS | 1369 | 12.0 | 91.1 | 1.5 |
| NEDC | 1220 | 11.0 | 120.0 | 1.0 |
| WLTP3 (v5) | 1800 | 23.3 | 131.3 | 1.6 |
As this measure will lead to drive-cycle-specific optimized designs, maximum speed and acceleration requirements will be reintroduced later to obtain more flexible designs.
4.2 Optimization Problem Formulation
4.2.1 Design Parameters
In a basic design optimization, the main hydraulic components as well as the diesel engine plus its flywheel are considered on the hardware side. As the main defining control parameters, the stationary state-of-charge limits, defined through reference pressures phigh and plow, are included. The reference flow limit, qref, and the high-speed operating point, characterized through the target pressure level psplit, are also added as they depend on the general system design parameters. Wide design parameter limits (Table 3) are chosen to aim for convergence within the design space.
4.2.2 Optimization objectives
The optimization focuses primarily on the vehicle’s fuel consumption (FC (x)) over a given drive cycle. The total fuel consumption considers engine start-ups, engine operation, and for comparability also an approximated fuel equivalent to the accumulator state-of-charge after driving and standstill.
Secondary design objectives include the performance, ARVD, over the studied drive cycle, the fulfilment of external performance requirements where applicable, the avoidance of system failure, indicated through cavitation in the system, inadmissible design parameter constellations, or a violation of the hydraulic machines’ speed limitations. These are formulated as constraints C(x), resulting in penalties of varying weight cp if violated. For the ARVD performance, a level of 1.0 % is targeted.
Table 3 Design parameter limits
| Design Parameter | Unit | Lower Limit | Upper Limit |
|---|---|---|---|
| (1) Adjusted to max. (phigh –5·106 ) Pa. | |||
| Pump displacement Dp | 10–6 m3/rev | 25 | 250 |
| Pump/motor displacement Dpm | 10–6 m3/rev | 25 | 250 |
| Flywheel inertia JFW | kgm2 | 0 | 1 |
| Maximum engine torque TICE, max | Nm | 75 | 400 |
| Accumulator volume V0,acc | 10–3 m3 | 10 | 100 |
| Upper state-of-charge limit phigh | 106 Pa | 15 | 45 |
| Lower state-of-charge limit plow | 106 Pa | 12.5 | 44(1) |
| Target pressure level psplit | 106 Pa | plow | phigh |
| Reference flow qref | m3/s | 0 | 0.05 |
The optimization problem with m secondary objectives becomes then
where x is the vector containing all design parameters xi with the limits [xi,min, xi,max].
4.3 Optimization Algorithm
For the optimization, the Complex-RF algorithm is used. This is a nongradient-based method and an extension of Box’ Complex algorithm. The Complex-RF contains random noise and a forgetting factor as extensions, aiming to prevent premature convergence on a possibly local optimum and favour results of recent iterations (Krus 2003). This method can provide a compromise between computational burden and a sufficient performance (Fellini, 1998). By selecting a number of random starting parameter sets, the probability of exploring a major part of the design space is increased. The optimization algorithm is integrated in the Hopsan simulation tool, which allows for optimization experiments to be run in parallel in a Linux cluster configuration (Nordin et al., 2015). The algorithm parameters follow the values obtained through meta-optimization by Krus and Ölvander (2013). An optimization is run with a maximum of 4000 iterations, and aborted if a convergence of 0.001 is reached for all design parameters.
4.4 Optimization Experiments
Two sets of optimization experiments are conducted for this study, each optimizing the SHHV transmission over the three drive cycles presented above.
- Case I: Designs are obtained focusing on a single drive cycle for driving performance requirements and fuel consumption evaluation.
- Case II: The resulting designs from the previous case are expected to be inflexible with regard to changes in usage profile. For more robust performance, drive-cycle-independent requirements are introduced. The targeted limits (an acceleration to 100 km/h in 15 s or less and a maximum continuous speed of 130 km/h) aim for real-life driving. The performance is measured for optimal operating conditions, i.e. considering only the vehicle’s kerb weight and a fully charged accumulator.
5 Optimization Results
To increase the probability of successful optimization leading to a close-to-optimal solution given the optimization-algorithm-inherent stochastic elements, each individual experiment is run multiple times. No exact duplicate results were obtained, indicating the complexity of the design problem. In this chapter, for each case and drive cycle the best result obtained is considered, summarized in Figure 5. The optimizations converged on average within 1930 function evaluations, each taking approximately 30 s on a typical desktop computer.
Considering for example the optimized design obtained for the UDDS in Case I, a very small engine (here: 121 Nm) delivers a sufficient performance for this optimization’s objectives. The engine operates largely in its most fuel-efficient region during propulsion, and in transition between target speed levels at maximum torque (see Figure 6).
An energy perspective (Figure 7) during the first 400 s of the UDDS illustrates the system’s operation further:
Figure 7b shows the energy balance diagram for the system including the total combined energy, both kinetic and potential (accumulator). In an ideal, loss-less case without restriction on energy storage the total energy should be constant, and there will solely be exchange between kinetic and potential energy. The figure verifies that the optimized system behaves as expected within the existing limitations: low accumulator charge triggers energy input via diesel engine and hydraulic pump. Once the engine has been shut down, vehicular and transmission losses cause a reduction in total energy despite relatively constant driving speed. In the high-speed part of the drive cycle, the engine’s operation becomes more dynamic due to speed- and acceleration-dependent state-of-charge limit adjustments, and the prevented engine shutdown. The accumulator in this optimized design is capable of capturing approximately 57% of the vehicle’s maximum kinetic energy during this drive cycle, the rest being lost through vehicle and transmission losses during braking, the hydraulic system’s pressure relief valve and the friction brake. In comparison to a hypothetical non-hybrid case, the hydraulic hybrid vehicle’s mean total energy content is increased through the addition of the hydraulic accumulator as energy buffer, but a lower standard deviation indicates how hybridization helps even out drive cycle peak demands (Table 4).
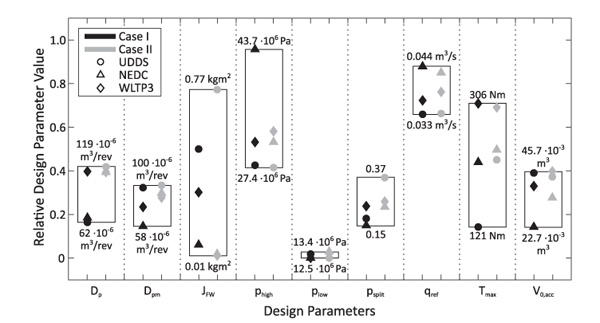
Figure 5 Distribution of design parameters within design range (relatively) for different drive cycles and cases. Minimum and maximum for each design parameter given as absolute values (psplit is per definition relative).
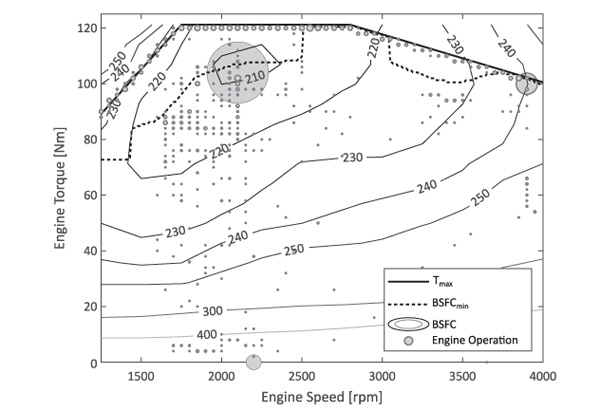
Figure 6 Bubble plot of engine operating points for Case I, UDDS-optimized design, together with wide open throttle curve (maximum torque), scaled BSFC-map and fuel-consumption-minimal operating points (BSFCmin ).

Figure 7 Reference velocity, energy content in system and instantaneous rate of fuel consumption for Case I, UDDS-optimized design during first 400 s of UDDS.
The same optimization experiment for the other drive cycles leads to differences in the designs obtained (see Figure 5). For the NEDC, a smaller pump/motor and smaller accumulator are sufficient. A higher upper state-of-charge limit results from less recuperation potential and moderate accelerations but requires a bigger engine. For the higher power requirements of the WLTP3, pump and engine need to be even bigger. A bigger accumulator and lower upper state-of-charge limit compared to the NEDC design allow more energy recuperation. For all designs, plow is close to the lower design parameter limit, indicating that the dynamic state-of-charge definition limit regulates increased power demand sufficiently.
Introducing additional performance requirements in Case II has more effect on the UDDS- and NEDC-based designs than for the WLTP3-based one (see Figure 5 and Table 5). For WLTP3, the design parameters are not much affected by the additional requirements, indicating that the specified acceleration and speed targets come close to the performance required in this drive cycle. The fuel economy is even slightly improved compared to Case I.
Table 4 Comparison of system’s energy content for non-hybrid (kinetic energy of vehicle and flywheel) and hybrid case (kinetic energy of vehicle and flywheel plus energy content accumulator) for Case I, UDDS-optimized design
| Mean Energy Content | Standard Deviation | |
|---|---|---|
| Non-hybrid | 1.8 · 105 J | 2.2·105 J |
| Hybrid | 4.4 · 105 J | 1.7·105 J |
Table 5 Optimized vehicle designs’ fuel consumption [g]
| Drive Cycle | UDDS | NEDC | WLTP3 |
|---|---|---|---|
| Case I | 814 | 844 | 2072 |
| Case II | 888 | 874 | 2066 |
This is due to the particular solutions the optimization algorithm converged on in each case; apparently the additional performance requirements helped guide the optimization to this solution.
For the other drive cycles, larger components are required than in Case I to fulfil the performance requirements: pump and pump/motor are similarly sized now for all designs, the engine in the UDDS test case and the accumulator in the NEDC case are larger than before to meet the increased power requirements. The overall larger and heavier transmission with control strategies in part tuned to meet performance requirements yield comparably higher fuel consumption than before (Table 5).
A test of each design over the non-optimized drive cycles helps to distinguish the results with regard to robustness to different driving conditions (Table 6). A number of these ’cross-tests’ lead to a violation of the pump speed constraint, typically when a design is faced with more demanding drive cycles than optimized for. This indicates that diesel engine and pump operating speed range need to be matched better. Otherwise, the expected improvement in driving performance over varying driving missions, expressed as ARVD, can be observed for designs obtained with additional driving performance requirements (Case II ).
Table 6 Comparison of ARVD for different designs and drive cycles
| Case | Drive Cycle | UDDS | Test Cycle NEDC | WLTP3 |
|---|---|---|---|---|
| (1) Pump speed constraint violated | ||||
| I | UDDS | (1.0 %) | 3.9 % (1) | 8.4 % (1) |
| NEDC | 2.3 % | (1.0 %) | 1.7 % (1) | |
| WLTP3 | 1.9 % | 0.6 % | (1.0 %) | |
| II | UDDS | (1.0 %) | 0.6 % (1) | 1.5 % (1) |
| NEDC | 0.7 % | (0.5 %) | 0.9 % (1) | |
| WLTP3 | 0.8 % | 0.4 % | (0.8 %) |
6 Discussion
The results from the simulation-based optimization framework of several design experiments with various target driving scenarios illustrate how sensitive the final design is to the optimization problem formulation.
Brake energy recuperation aims to improve fuel economy. The results in Table 5 do not support that yet compared to typical vehicle data. This can be attributed to a number of factors:
- The optimization is based on limited and available component and efficiency data, where alternative and targeted choices might yield performance and efficiency gains. Static efficiency maps, as utilized here, are only partially representative. As in a series hybrid architecture all power is transmitted through the hydraulic transmission path, which is less efficient than its mechanical counterpart, highly efficient machines are needed (see e.g. Kargul et al., 2015), and their accurate modelling is of great importance.
- The system architecture in this example does not include design options such as additional gearing and valves. Similarly, the hydraulic pump and pump/motor’s operating efficiency can be improved by considering multiple smaller components in sequential control (see e.g. Kim, 2008).
- A rule-based control strategy does not yield globally optimal control. While the basic control strategy has been extended, a number of its refining parameters are set, but not optimized simultaneously.
However, the energy balance diagram (Figure 7b) indicates that the optimized system utilizes the energy storage as expected.
The design experiments presented here focused on variations in the optimization problem by studying various target drive cycles and by including acceleration and maximum speed performance requirements suitable for typical drive cycles. Post-optimization gradeability simulations for the designs obtained showed that moderate slopes could be driven by a fully-loaded vehicle at constant medium-high speeds, while steeper climbs were possible at lower speeds. The framework can be extended to include additional, more exceptional driving conditions.
Further research can examine other design problem variations for the given system architecture, for example in terms of design objectives (costs and business case (Kargul et al., 2015) and emissions (Tikkanen et al., 2017)) and additional parameters. It is possible to include and compare different architecture-enhancing features.
7 Conclusions
This paper introduced a simulation-based optimization framework applied to a series hydraulic hybrid vehicular transmission. The simulation-based approach allows to evaluate the transmission performance under instantaneous power demand and reserve conditions, and the corresponding system dynamics. Through numerical optimization, a large design space can be explored, including trade-offs between components and control parameters. The optimization problem formulation including the driving mission, the optimization objectives and boundary conditions, as well as the application under consideration and modelling assumptions thereby have a large impact on the results. The energy balance diagram was used as an indicator that the optimized system operates as could be expected.
Disclosure Statement
No potential conflict of interest was reported by the authors.
Acknowledgements
The authors would like to thank Lic. Eng. Peter Nordin for his continued support with the Hopsan cluster.
References
[1] Assanis, D., et al., 1999. Optimization Approach to Hybrid Electric Propulsion System Design. Journal of Mechanics of Structures and Machines, 27(4), 393–421.
[2] Assanis, D. and Heywood, J., 1986. Development and Use of a Computer Simulation of the Turbocompounded Diesel System for Engine Performance and Component Heat Transfer Studies. In: Proceedings of the SAE International Congress and Exposition, 24-28 February 1986, Detroit, MI, USA.
[3] Baer, K., 2018. Simulation-Based Optimization of a Series Hydraulic Hybrid Vehicle. Thesis (PhD). Linköping University.
[4] Barlow, T.J., et al., 2009. A Reference Book of Driving Cycles for Use in the Measurements of Road Vehicle Emissions. Project Report PPR354. Department for Transport, UK.
[5] Bowns, D.E., Vaughan, N.D., and Dorey, R.E., 1981. Design Study of a Regenerative Hydrostatic Split Power Transmission for a City Bus. In: IMecE Hydrostatic Transmissions for Vehicle Applications, 1981, Coventry, UK, 29–38.
[6] Buchwald, P., et al., 1979. Improvement of Citybus Fuel Economy using a Hydraulic Hybrid Propulsion System – A Theoretical and Experimental Study. In: Proceedings of the SAE Congress and Exposition, 26 February– 2 March 1979, Detroit, MI, USA.
[7] Burgess, E., Peffers, M., and Silverman, I., 2009. Idling Gets You Nowhere. The Health, Environmental and Economic Impacts of Engine Idling in New York City. Technical Report, Environmental Defense Fund.
[8] Carson, Y. and Maria, A., 1997. Simulation Optimization: Methods and Applications. In: Proceedings of the 1997 Winter Simulation Conference, 7–10 December 1997, Atlanta, GA, USA.
[9] Deppen, T.O., et al., 2010. Predictive Energy Management for Parallel Hydraulic Hybrid Passenger Vehicle. In: Proceedings of the ASME 2010 Dynamic Systems and Control Conference, 12–15 September 2010, Cambridge, MA, USA.
[10] Digeser, S., et al., 2005. Der neue Dreizylinder-Dieselmotor von Mercedes-Benz für Smart und Mitsubishi. Motortechnische Zeitschrift, 66(1), 6–12.
[11] Eriksson, B., Nordin, P., and Krus, P., 2010. Hopsan NG, A C++ Implementation using the TLM Simulation Technique. In: Proceedings of the 51st Conference on Simulation and Modelling, 14–15 October 2010, Oulu, Finland.
[12] Fellini, R.A., 1998. Derivative-free and Global Search Optimization Algorithms in an Object-oriented Design Framework. Thesis (MSc). University of Michigan.
[13] Filipi, Z., et al., 2004. Combined Optimisation of Design and Power Management of the Hydraulic Hybrid Propulsion System for the 6×6 Medium Truck. International Journal of Heavy Vehicle Systems, 11(3/4), 372–402.
[14] Guzzella, L. and Sciarretta, A., 2013. Vehicle Propulsion Systems. 3rd ed. Berlin/Heidelberg: Springer.
[15] Karbaschian, M.A., 2014. Improving System Design and Power Management for Hybrid Hydraulic Vehicles Minimizing Fuel Consumption. Thesis (PhD). University of Duisburg-Essen.
[16] Karbaschian, M.A. and Söffker, D., 2014. Review and Comparison of Power Management Approaches for Hybrid Vehicles with Focus on Hydraulic Drives. Energies, 7(6), 3512–3536.
[17] Kargul, J., et al., 2015. Design and Demonstration of EPA’s Integrated Drive Module for Commercial Series Hydraulic Hybrid Trucks and Buses. SAE International Journal of Commercial Vehicles, 8(2), 549–567.
[18] Kim, Y.J., 2008. Integrated Modeling and Hardware-in-the-Loop Study for Systematic Evaluation of Hydraulic Hybrid Propulsion Options. Thesis (PhD). University of Michigan.
[19] Korkmaz, F., 1975. Verbrennungshydraulischer Hybridantrieb für Stadtfahrzeuge. Thesis (PhD). Technical University of Berlin.
[20] Krus, P., 2003. Simulation Based Optimisation for System Design. In: Proceedings of the 14th International Conference on Engineering Design, 19–21 August 2003, Stockholm, Sweden.
[21] Krus, P. and Ölvander, J., 2013. Performance Index and Meta-Optimization of a Direct Search Optimization Method. Engineering Optimization, 45(10), 1167–1185.
[22] Kumar, R., Ivantysynova, M., and Williams, K., 2007. Study of Energetic Characteristics in Power Split Drives for On Highway Trucks and Wheel Loaders. In: Proceedings of the Commercial Vehicle Engineering Congress and Exhibition, 30 October–1 November 2007, Rosemont, IL, USA.
[23] Li, C.-T. and Peng, H., 2010. Optimal Configuration Design for Hydraulic Split Hybrid Vehicles. In: Proceedings of the 2010 American Control Conference, 30 June–2 July 2010, Baltimore, MD, USA.
[24] Macor, A. and Rossetti, A., 2011. Optimization of Hydro-Mechanical Power Split Transmissions. Mechanism and Machine Theory, 46(12), 1901–1919.
[25] Manring, N.D., et al., 2014. Scaling the Speed Limitations for Axial-Piston Swash-Plate Type Hydrostatic Machines. Journal of Dynamic Systems, Measurements, and Control, 136(3), 031004.
[26] Nordin, P., Braun, R., and Krus, P., 2015. Job-Scheduling of Distributed Simulation-Based Optimization with Support for Multi-Level Parallelism. In: Proceedings of the 56th Conference on Simulation and Modelling, 7-9 October 2015, Linköping, Sweden.
[27] Nyman, J. and Rydberg, K.-E., 2001. Energy Saving Lifting Hydraulic Systems. In: Proceedings of the Seventh Scandinavian International Conference on Fluid Power, 30 May–1 June 2001, Linköping, Sweden.
[28] Otis, D.R. and Pourmovahed, A., 1984. Improving Performance of Gas-Charged Accumulators Using Elastomeric Foams. In: Proceedings of the International Symposium on Advanced and Hybrid Vehicles, 17–19 September 1984, Glasgow, Scotland, UK.
[29] Reyer, J.A., 2000. Combined Embodiment Design and Control Optimization: Effects of Cross-Disciplinary Coupling. Thesis (PhD). University of Michigan.
[30] Rydberg, K.-E., 1983. On Performance Optimization and Digital Control of Hydrostatic Drives for Vehicle Applications. Thesis (PhD). Linköping University.
[31] Sprengel, M. and Ivantysynova, M., 2016. Neural Network Based Power Management of Hydraulic Hybrid Vehicles. International Journal of Fluid Power, 18(2), 79–91.
[32] Stelson, K.A., et al., 2008. Optimization of a Passenger Hydraulic Hybrid Vehicle to Improve Fuel Economy. In: Proceedings of the 7th JFPS International Symposium on Fluid Power, 15–18 September 2008, Toyama, Japan.
[33] Surampudi, B., et al., 2009. Design and Control Considerations for a Series Heavy Duty Hybrid Hydraulic Vehicle. In: Proceedings of the SAE 2009 Powertrains Fuels and Lubricants Meeting, 2–4 November 2009, San Diego, CA, USA.
[34] Tikkanen, S., et al., 2017. Emission Reduction of Mobile Machines by Hydraulic Hybrid. In: Proceedings of the 15th Scandinavian International Conference on Fluid Power, 7–9 June 2017, Linköping, Sweden.
[35] Tsai, S.-C. and Goyal, M., 1986. Dynamic Turbocharged Diesel Engine Model for Control Analysis and Design. In: Proceedings of the SAE International Congress and Exposition, 24–28 February 1986, Detroit, MI, USA.
[36] Tutuianu, M., et al., 2013. Development of a World-wide Worldwide harmonized Light duty driving Test Cycle (WLTC). Technical Report GRPE-68-03, UN/ECE/WP.29/GRPE/WLTP-IG, DHC subgroup.
[37] Wahlström, J. and Eriksson, L., 2011. Modelling Diesel Engines with a Variable-Geometry Turbocharger and Exhaust Gas Recirculation by Optimization of Model Parameters for Capturing Non-linear System Dynamics. Proceedings of the Institution of Mechanical Engineers, Part D: Journal of Automobile Engineering, 225(7), 960–986.
[38] Wu, B., et al., 2002. Optimization of Power Management Strategies for a Hydraulic Hybrid Medium Truck. In: Proceedings of the 2002 Advanced Vehicle Control Conference, 9–13 September 2002, Hiroshima, Japan.
[39] Wu, P., et al., 1985. Fuel Economy and Operating Characteristics of a Hydropneumatic Energy Storage Automobile. In: Proceedings of the SAE Passenger Car Meeting, 23–26 September 1985, Dearborn, MI, USA.
[40] Yang, Y., et al., 2016. State-of-the-Art Electrified Powertrains – Hybrid, Plug-in, and Electric Vehicles. International Journal of Powertrains, 5(1), 1–29.
Biographies

Katharina Baer received her Ph.D. at the division of Fluid and Mechatronic Systems at Linköping University, Sweden, in 2018. She has since joined the division of Machine Design at Linköping University. Her interests lie in system modelling, simulation and optimization, in particular concerning hydraulic hybrid systems.

Liselott Ericson received a D.Sc. degree at Linköping University, Sweden, in 2012. The topic of her thesis is related to noise reduction in hydraulic pumps and motors. She is a research fellow at Fluid and Mechatronic Systems at LiU. The areas of interest include control design, modelling, simulation and noise in fluid power systems.

Petter Krus is a professor and head of division of Fluid and Mechatronic Systems at Linköping University in Sweden. He is also holder of the Swedish Endowed Chair in Aeronautics at “Instituto Technólogico Aeronáutica”, ITA in Brazil. His field of research is in fluid power systems, aeronautics, systems engineering, modelling and simulation and design optimization.
International Journal of Fluid Power, Vol. 20 1, 27–52.
doi: 10.13052/ijfp1439-9776.2012
© 2019 River Publishers