NFB in Intrinsic and Cell Autonomous Regulation of Mesenchymal Stem Cell Multipotency
Lauren S. Sherman1,*, Jad A. Jihayel1, Juliana Correa-Velloso2, Sophia P. Lukac1, Cassie Y. Liu1, Steven J. Greco1, Clara B. Harby1, Henning Ulrich3 and Pranela Rameshwar1,*
1Rutgers New Jersey Medical School, Department of Medicine, Newark, NJ
2Department of Pharmacology, Physiology and Neuroscience, Rutgers New Jersey Medical School, Newark, NJ
3Department of Biochemistry, Institute of Chemistry, University of São Paulo, São Paulo, SP, 05508-000, Brazil.
E-mail: shermala@njms.rutgers.edu; rameshwa@njms.rutgers.edu
*Corresponding Authors
Received 18 September 2025; Accepted 25 October 2025
Abstract
Mesenchymal stem cells (MSCs) are multipotent stromal cells that can differentiate into cells of the three germ layers. MSCs exhibit immune plasticity and this property is guided by the inflammatory tissue niche. Importantly, MSCs can be licensed as immune suppressor cells within an inflammatory niche. Since MSCs are approved by the food and drug administration for particular inflammation, it is important to determine how these cells maintain multipotency, in particular, the fate of these cells in vivo when they become located within a varied tissue niche. More importantly, the molecular mechanisms by which MSCs maintain multipotency will improve clinical applications. The focus of this study is particularly important since MSCs are available off the shelf, indicating allogeneic differences between the recipient and donor. We studied the transcription factor NFB since it is a central regulator of inflammation. NFB also links intrinsic stem cell signaling and extrinsic inflammatory cues. We used in silico analyses and determined that NFB could regulate the major stem cell genes such as Octamer 4A (Oct4A). We confirmed a canonical pathway using an NFB array that dissected the intracellular pathway. Additionally, we used specific small molecules to inhibit NFB subunits. Using published RNA-Seq data, we showed a potential role for the purinergic receptors with a key role for ADORA2B. Similar to the licensing of MSCs by inflammatory mediators, ADORA2B appeared to be regulated by growth factors, including those linked to inflammation. In total, NFB regulates MSC multipotency in a cell-autonomous manner, explaining the licensing properties within an inflammatory microenvironment. We also showed that the purinergic receptors could be involved in intrinsic and extrinsic regulation of MSC multipotency.
Keywords: Mesenchymal stem cells, bone marrow, cytokines, purinergic receptors, bone marrow, NFB.
Introduction
Mesenchymal stem cells (MSCs) are multipotent stromal cells. MSCs can differentiate into cells of all germ layers [1–5]. MSCs exhibit immune plasticity, based on the differential response in a specific inflammatory microenvironment [6]. The immune plasticity of MSCs is explained as follows: In the presence of an inflammatory milieu, MSCs become licensed into immune suppressor cells [6]. However, it remains unclear how the MSCs behave after they have mitigated the inflammation. Thus, the question is how the MSCs react to a niche without inflammatory mediators. The answer to this question is important since MSCs might continue to linger in the tissue, perhaps to differentiate, or undergo senescence and cell death. We studied the transcription factor NFB since it is a central regulator of inflammation, and links intrinsic stem cell signaling and extrinsic inflammatory cues [7].
Canonical NFB signaling involves IKK complex activation, IB degradation, and nuclear translocation of NFB dimers [8–12]. These processes allow direct transcriptional regulation of genes linked to inflammation and stemness. Previous studies have associated NFB activity with the preservation of multipotency, while also suggesting that its dysregulation can drive differentiation [7]. An understanding of how MSCs respond to a particular tissue microenvironment requires studies to discern cell-autonomous regulation and extrinsic cures with respect to MSC function.
We and others have identified the transcription factor NFB as an important regulator of multipotency [13, 14]. MSCs can be expanded easily in culture due to their ability to retain multipotency across multiple passages [15]. Based on this observation, we propose that MSCs exhibit cell-autonomous methods to maintain multipotency. This premise forms the basis of this study to examine the mechanism by which NFB contributes to multipotency in a cell-autonomous manner. We report on a canonical NFB pathway and also show that the purinergic receptors could be involved in intrinsic and extrinsic regulation of MSC multipotency.
Material and Methods
Reagents
DMEM, RPMI-1640, L-glutamine, penicillin-streptomycin, geneticin, a platinum SYBR Green qPCR Supermix-UDG Kit, Supersignal West Femto Maximum Sensitivity Substrate, and a High-Capacity cDNA Reverse Transcription kit were purchased from Thermo Fisher Scientific (Waltham, MA); NP-40, an EDTA-free protease inhibitor, fetal bovine sera (FBS), Ficoll Hypaque and Triton-X100 from Millipore-Sigma (St. Louis, MO); protein loading dye, Bradford protein reagent, and sodium dodecyl sulfate from BioRad (Hercules, CA); acryl/Bis Solution (30%) 37.5:1 from VWR (Radnor, PA); RelA-Ser529/536 and RelA-Ser276 from Novus Biologicals (Centennial, CO); BMS 345541 and TPCA1from Tocris (Minneapolis, MN); and phalloidin red from Invitrogen
Antibodies
FITC conjugated rabbit anti-Ki67 (1:250 dilution), goat anti-Oct4a and rabbit anti-Sox2 were purchased from Abcam (Waltham, MA); murine anti-Rel A from Cell Signaling; HRP anti--actin from ThermoFisher.
Cell Line
MDA-MB-231 breast cancer cells were obtained from the American Type Culture Collection and expanded as per their instructions. Briefly, cells were propagated in DMEM with 10% FBS, 2 mM L-glutamine, 100 IU/ml penicillin, 100 g/ml streptomycin and 1% non-essential amino acid.
MDA-MB-231 cells with stable pOct4a-GFP were described [16]. Fluorescence intensities correlated with the expression of the stem cell gene, Oct4a [16]. The transfectants were maintained with 500 g/ml of geneticin. Cancer stem cells (CSCs) were reported within the top 5% fluorescence, termed Oct4a hi [16].
Human Subjects
Rutgers Institutional Review Board (IRB) approved the use of bone marrow aspirates from healthy donors, ages 20–35 yrs.
Culture of Mesenchymal Stem Cells (MSCs)
MSCs were cultured from bone marrow aspirate healthy donors, age 20–30 yrs, as described [17, 18]. Briefly, unfractionated aspirates were diluted in DMEM with 10% FBS, 1% P-S and 1% L-glutamine (MSC media) and then added to vacuum gas plasma-treated plate. After 3 days, red blood cells and granulocytes were removed by Ficoll-hypaque density gradient centrifugation and the mononuclear fractions replaced in the plates with fresh MSC media. At weekly intervals, fresh media replaced 50% of the culture media. The adherent cells were serially passaged at 70–80% confluence. At passage 3, the cells were analyzed by phenotype and function. Phenotypic analyses were conducted by flow cytometry, which showed the cells as negative for CD34, CD45 and CD14; and positive for CD29, CD73, CD90, CD105 and CD44. Functionally, the MSCs differentiated into adipogenic and osteogenic cells [19].
Adipogenic and Osteogenic Differentiation
MSCs were studied for osteogenic and adipogenic differentiation with kits from ThermoFisher. After differentiation, cultures were washed with PBS and then fixed with 10% formalin for 7 min. Osteogenic differentiation was assessed with 2% silver nitrate solution followed by exposure to UV light for 15 min. Adipogenic differentiation was determined with Oil Red O staining. Images were captured under bright field microscopy on a Nikon TMS microscope at 10 magnification.
Sorting of MDA-MB-231 Cell Subsets
MDA-MB-231cells with stable pOct4-GFP were sorted, based on GFP expression, as described [16]. The top 5% GFP (Oct4ahi) cells were determined to be CSCs [16]. This was followed by Oct4amed and Oct4alo [20].
Array Analysis
MSCs were transfected with the reporter pNFB-luc as described [21]. A SureSilencing siRNA array was purchased from Qiagen and then analyzed as per the manufacturer’s instructions. Briefly, each well of the 96-well plate contained gene-specific siRNA (Supplemental Table 2). SureFECT transfection reagent and media were added to the plate, followed by adding the MSCs for reverse transfection. After 24 h, the media were evaluated for relative luminescence as a measure of NFB activity. Enzyme activity was quantitated using the Dual Luciferase Reporter Assay System. The relative luminescence unit (RLU) for luciferase values were normalized to its control luciferase vector (pMetLuc2). Identification and analysis of significant cellular pathways from the dataset were performed using ingenuity pathway analysis (IPA; fold change 1.75, FDR 0.05).
NFB Inhibition
NFB was inhibited with specific small molecules. MSCs were transfected with RelA siRNA using Lipofectamine 3000 per the manufacturer’s instructions to inhibit RelA. IB phosphorylation was inhibited with decoys of the RelA-Ser529/536 phosphorylation (P1; 50 M) and RelA-Ser276 (P2; 150 M) sites per the manufacturer’s recommendations. IKK activity was inhibited with an IKK dominant negative (P3; 100 M) according to the manufacturer’s recommendations. Dual inhibition of IKK and IKK was accomplished with BMS 345541 (0.4 M) and IKK alone with TPCA1 (0.1 M) per the manufacturer’s recommendations. Each inhibitor was allowed to incubate overnight under normal tissue culture conditions.
Real-time PCR
Real-time PCR was performed with total RNA from MSCs. The RNA was isolated with TRIzol as per manufacturer’s instruction. RNA was quantified with QIAxpert and then converted to cDNA with the High-Capacity cDNA Reverse Transcription Kit. Real time PCR used Platinum SYBR Green qPCR SuperMix-UDG Kit and the 7300 Real-Time PCR System. All primers, including those for the housekeeping GAPDH, were purchased from Sigma (Supplemental Table 2).
The PCR data were analyzed by calculating the expression values of the experimental samples, relative to the housekeeping control using the following method (experimental sample value ): The PCR readouts that were 40 or higher were considered as zero and not assessed for differential expression. The fold change in gene expression was calculated by first dividing the mean of technical experimental replicates by the mean of the technical control. The control biological replicates were then normalized to 1 to determine the fold change of the biological experimental replicates.
Immunocytochemistry
MSCs transfected with RelA siRNA or scrambled siRNA were seeded in 1 mL chamber slides at /mL in media. At adherence, the media were aspirated and then washed with PBS. The cells were fixed with 4% paraformaldehyde for 10 min and then permeabilized with 0.05% Triton-X100 in PBS for 10 min at room temperature. The slides were incubated for 1 h with 0.1% BSA and 10% non-immune goat serum (blocking solution). Next, the cells were incubated overnight with anti-Ki67 (1/500 dilution) in blocking serum. After this, the cells were washed four times with PBS for 5 min. The cells were subjected to another 10 min incubation with blocking solution and then incubated for 1 h with PE anti--actin (1/1000 dilution). Cells were washed and then imaged immediately using the EVOS Fl imager.
Western Blot
MSC cell extracts were prepared by lysing the cells with ice-cold lysis buffer containing the following: 50 mM Tris HCl (pH 7.4), 100 mM NaCl, 2 mM MgCl2, 10% glycerol, 1% NP-40 and 1x protease inhibitor cocktail. Immediately before cell lysis, a protease inhibitor cocktail was added at 1:100 final dilution. Total protein was determined with Bradford reagent. Extracts (15 g) were electrophoresed on SDS-PAGE (10–12%) at 125 V, followed by transfer onto PVDF membranes at C using 100 V for 90 min. The membranes were incubated overnight at C with primary antibodies in 1% non-fat milk in PBS containing 0.1% TWEEN. The primary antibodies were used at 1:1000 final dilution. The following day, membranes were developed with HRP-conjugated anti-IgG (1:2000) at C for 2 h followed by HRP detection with SuperSignal West Femto Maximum Sensitivity Substrate. Bands were detected on the ChemiDoc XRS system. Molecular weights of bands were compared with Kaleidoscope pre-stained standards. Membranes, required for reprobing with other antibodies, were stripped with Restore Western Blot Stripping Buffer followed by washing four times with PBS containing 0.1% TWEEN. Band densities were normalized to housekeeping protein (-actin) bands.
Transcription Factor Binding Prediction (ConSite)
Potential transcription factor binding sites were analyzed using the ConSite software. The software requires input of the regulatory region of a gene; if the regulatory region is unknown, phylogenetic footprinting can be used to determine the likely regulatory region. The software uses the known DNA binding motif and binding profile model of the selected transcription factor to identify predicted transcription factor binding sites [22].
Statistical Analysis
Statistical analyses were performed with analysis of variance and the Tukey–Kramer multiple comparisons test. was considered significant.
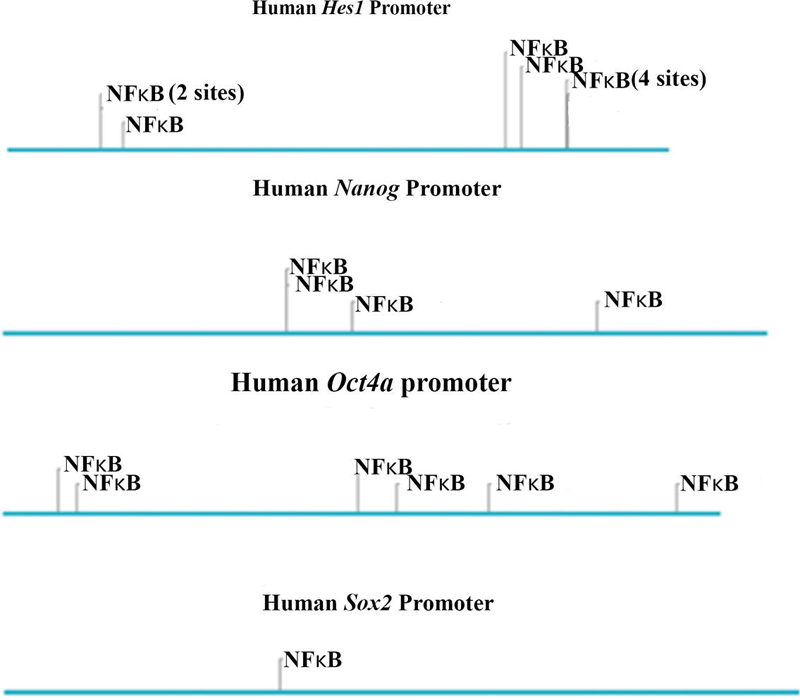
Figure 1 Putative NFB binding sites. Schematic illustration of the regulatory regions of Hes1, Nanog, Oct4a, and Sox2. Each of these regulatory regions contains putative NFB binding site(s), as identified through ConSite transcription factor prediction [22].
Results
Predicted NFB Binding Sites on Stem Cell-associated Genes
An understanding of how NFB regulates multipotency requires examining the interacting sites of key stem cell-associated genes. To this end, we used in silico analyses for NFB binding sites on Hes1, Nanog, Oct4a, and Sox2. Using ConSite transcription factor binding predictor program, we identified multiple binding sites for NFB on the regulatory regions of Hes1. Nanog and Oct4a (Figure 1). Sox2 showed one potential interacting site (Figure 1). These predicted findings provided confidence that NFB could be a key regulator of multipotency.
RelA Knockdown (KD) in MSCs Decreased Stem Cell-associated Proteins
To test the role of NFB in multipotency, we used KD on the NFB subunit, RelA with siRNA. Control MSCs were transfected with scrambled siRNA. The cell extracts of these cells were analyzed for stem cell genes using western blots. The efficiency of RelA KD was confirmed by an undetectable band (Figure 2A). Oct4a protein was undetectable after 24 h whereas Sox2 decrease was delayed up to 48 h (Figure 2A).
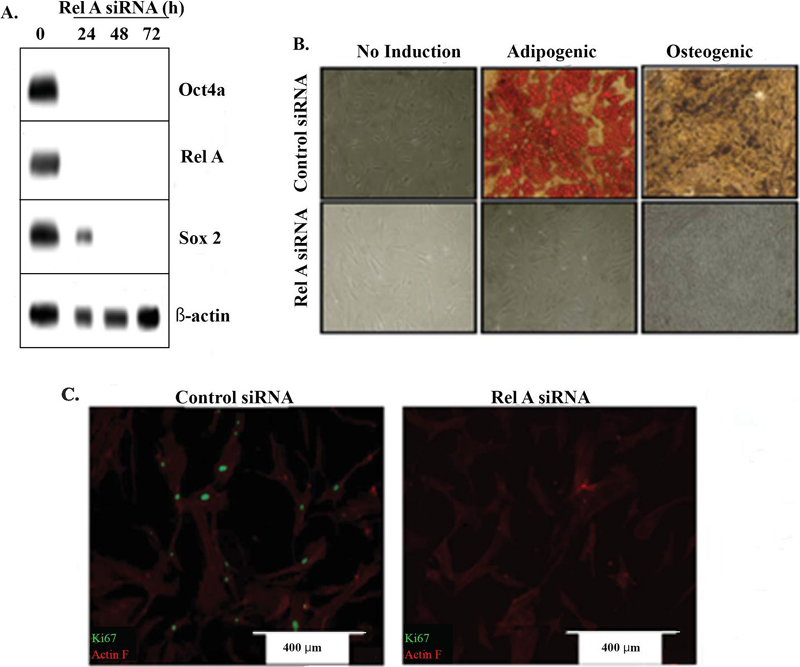
Figure 2 Stem cell associate gene expression in RelA KD MSCs. MSCs were transfected with RelA siRNA or scrambled control. (A) Western blot analysis confirmed RelA knockdown and reduction of stem cell-associated proteins Oct4a and Sox2 after 48–72 h . (B) Multilineage differentiation capacity of MSCs was assessed by induction into adipocytes (red) or osteocytes (dark brown/black) . (C) Ki67 (green) expression was evaluated as a marker of proliferation, counterstained with actin filaments (Phalloidin (Actin F), red) .
We asked if the decreased levels of Oct4a and Sox2 could affect MSC multipotency. This was addressed by subjecting the RelA KD MSCs to adipocyte and osteocyte differentiation. While control (scramble) siRNA showed greater than 90% differentiation towards both cell lineages, the RelA KD cells failed to show lineage differentiation (Figure 2B).
If RelA KD induced differentiation of MSCs, the cells are expected to have decreased proliferation. We addressed this by labeling the KD and scrambled siRNA cells for Ki67. Immunocytochemical labeling indicated decreased Ki67 relative to scrambled siRNA (Figure 2C). These findings supported terminal differentiation and/or senescence in the MSCs that were KD for RelA. The findings supported a requirement of RelA in stem cell maintenance.
IKK in RelA-mediated Multipotency
The IKK complex is composed of two catalytic subunits, IKK and IKK, which can form homodimers or heterodimers, along with its regulatory subunit NFB essential modulator (IKK) [23–25]. In canonical NFB signaling, activated IKK complex phosphorylates specific serine residues on the N terminus of IB, leading to ubiquitin-dependent degradation of IB by the 26s proteasome and subsequent nuclear translocation of the NFB dimer [9, 24]. Thus, to investigate how NFB is sequestered in the cytoplasm of MSCs, we used small molecule inhibitors to target different IKK subunits and used an inhibitor specific for serine phosphorylation sites on IB. Figure 3A shows how we used the available pharmacological agents to inhibit NFB at various points. We inhibited IKK to prevent IB phosphorylation, inhibited the proteasome to prevent IB degradation, inhibited nuclear translocation, and inhibited DNA-binding to prevent target gene transcription.
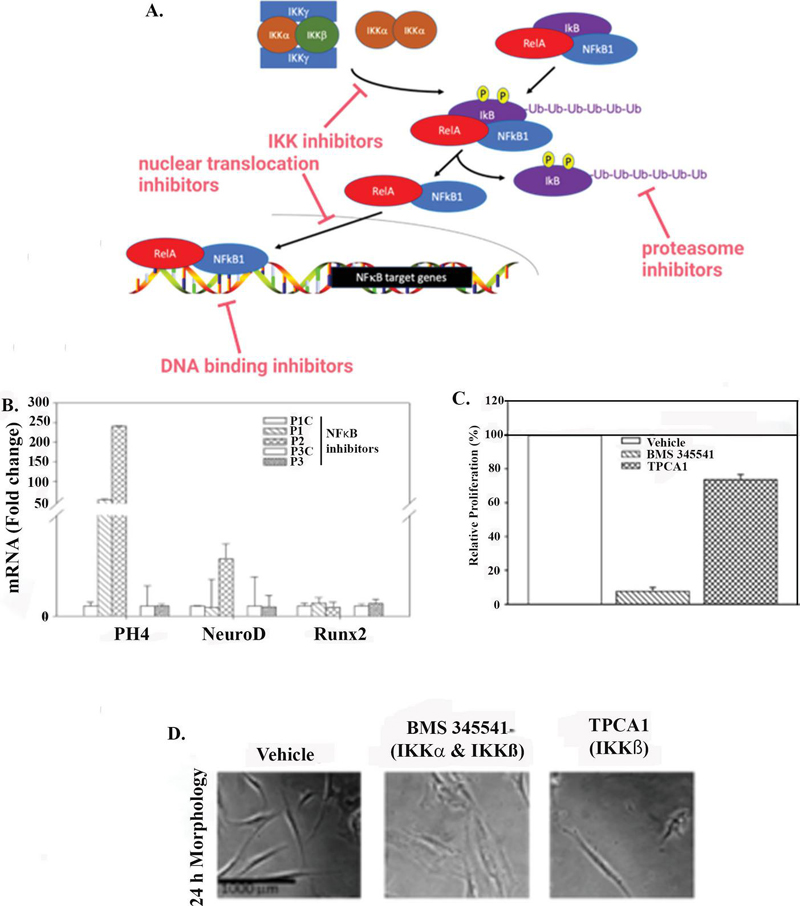
Figure 3 Canonical signaling and cytoplasmic sequestration of NFB by IKK. (A) Small molecule inhibitors P1 and P2 were used to block phosphorylation of IB, characteristic of canonical NFB signaling. P3 was employed as a dominant negative control for inhibition of IKK. (B) Following treatment with P1, P2, or P3, MSCs were assessed by qPCR for differentiation markers including PH4, NeuroD, and Runx2. These markers are typically expressed at low levels in MSCs but increase during lineage differentiation. (C,D) MSCs were treated with either a dual IKK/IKK inhibitor (BMS 345541) or an IKK-specific inhibitor (TPCA1). Proliferation was monitored over 5 days (C) and morphology was evaluated following overnight exposure (D) .
IB activity was inhibited through competitive inhibition using P1 or P2 peptides, which block phosphorylation at Ser529/536 and Ser276, respectively (Figure 3A, red arrows). Treatment was with peptide promoted MSC differentiation into fibroblasts, as indicated by increased PH4 expression (Figure 3B). These findings suggested a key role for IB in MSC multipotency.
To determine which IKK family members were responsible for sequestering NFB in the cytoplasm, experiments employed a dominant negative IKK (P3) and pharmacological inhibitors of IKK (TPCA1) or both IKK and IKK (BMS 345541). An inhibitor targeting IKK alone was excluded due to its toxicity to MSCs. Inhibition of IKK was insufficient to disrupt MSC multipotency, as indicated by the continued low expression of the fibroblastic marker PH4, and other differentiation markers (Figure 3B). In contrast, treatment with the dual IKK/IKK inhibitor blocked MSC proliferation after 5 days, whereas inhibition of IKK alone produced only a mild decrease in proliferation (Figure 3C). The reduced proliferation with the dual inhibitors correlated with the loss of symmetry with the morphology of the fibroblast, suggesting MSC differentiation (Figure 3D). Collectively, these findings identify a central role for IKK in sequestering NFB in the cytoplasm.
NFB Signaling Pathway in MSCs
The network among RelA, IB, and IKK supported canonical NFB signaling in MSC multipotency (Figure 3). We verified a canonical pathway to include other molecules involved in NFB activation. We used an siRNA array with the final readout of luciferase activity. The MSCs were transfected with a plasmid containing tandem repeats of RelA (pRelA-luc). Control MSCs were transfected with the empty vector. Thus, if the siRNA was important to NFB activity, this would be reflected in luciferase activity.
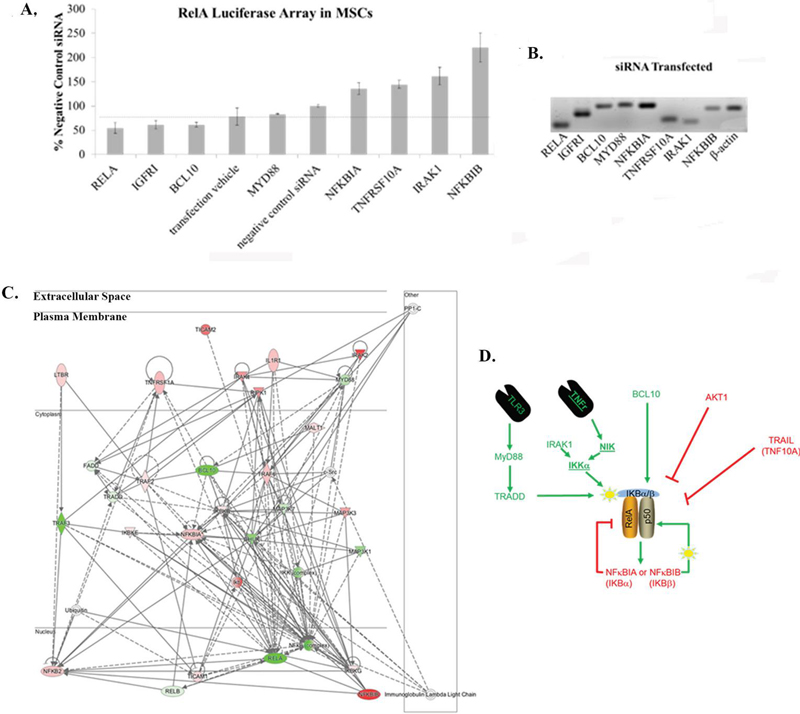
Figure 4 Upstream activators and inhibitors of NFB signaling in MSCs. MSCs were transfected with pRelA-luc as an indicator of NFB activity. Following this, cells were transfected with individual members of an siRNA array according to the manufacturer’s protocol (Supplemental Table 1) or with a vector control. NFB activity was quantified as a percentage relative to the negative control vector. (A) Genes producing the most significant effects on NFB activity were identified. Genes with activity greater than 100% were classified as NFB inhibitors, whereas those with activity less than 100% were considered NFB activators. For each gene shown, versus negative control siRNA. The horizontal line represents the transfection control . (B) Semi-quantitative PCR confirmed the expression of all genes identified in panel A within MSCs. (C) The genes shown in A and B were analyzed by IPA. (D) To determine how these pathways regulate NFB in maintaining MSC multipotency, the data were compared with established canonical NFB activation pathways.
The changes in NFB activity are summarized in Supplemental Table 1 and Figure 4A. The latter depicts the genes with significant changes in NFB activity. The genes identified in the array were confirmed by PCR (Figure 4B). The significant genes, both upregulated and downregulated, were analyzed on IPA to determine how the genes were linked to NFB signaling (Figure 4C). The results showed a network of the genes identified within the NFB pathway, including MyD88, which is associated with the Toll receptors and the IL-1 receptor. In total, these findings confirmed a canonical NFB pathway.
Role of ADORA2B in Cell Autonomous Regulation of MSC Multipotency
The role of NFB in maintaining multipotency indicated that MSCs could be regulated autonomously and by extrinsic factors (Figure 3). Extrinsic mechanisms could explain how MSCs behave in an inflammatory niche. However, studies require expanding MSCs in culture without exogenous factors. We therefore investigated whether the cultured cells could employ a cell autonomous method to maintain multipotency. An autonomous system could occur with energy utilization. Specifically, cells import ATP, ADP, and adenosine, which can bind to the purinoreceptors to regulate cellular processes, including those related to stem cell function and inflammation [26, 27].
The purinoreceptor ADORA2B was of particular interest because of its association with MSC differentiation, and its roles in pro- and anti-inflammatory functions [28–33]. MSCs express CD73, which is an ectonucleotidase responsible for converting AMP to adenosine, the substrate for ADORA2B [34–37]. Although the precise role of CD73 in maintaining MSC multipotency remains unclear, evidence suggests that CD73 contributes to anti-inflammatory functions. Specifically, CD73high MSCs display greater anti-inflammatory function relative to CD73low MSCs [38]. Furthermore, increased CD73 expression has been correlated with elevated NFB levels in MSCs from patients with myeloproliferative neoplasms [39, 40]. Based on the reports cited, we proposed dual roles for CD73 in MSC multipotency (Figure 5A).
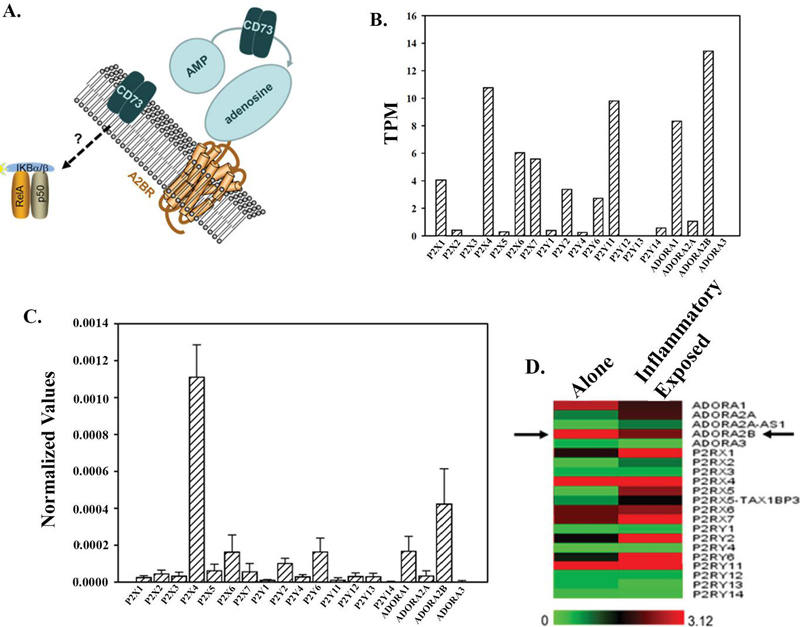
Figure 5 CD73–NFB correlation. (A) CD73 converts AMP to adenosine, thereby generating the adenosine substrate required to bind the ADORA2B receptor. CD73 expression has been reported to correlate with NFB activation in MSCs derived from the bone marrow of patients with myeloproliferative neoplasms [40]. (B) The transcripts per million (TPM) of purinoreceptors in MSCs were obtained from RNA sequencing data (GEO. GSE138435) [17]. (C) The findings in B were verified by qPCR. The results are presented as the mean SD of three biological replicates. (D) Influence of BCC secretome (model of inflammation) on the expression of purinoreceptors. Data were taken from RNA-Seq results in which MSCs were cultured alone or in a Transwell culture with MDA-MB-231 breast cancer cells.
We analyzed the RNA-Seq data from unstimulated expanded bone marrow-derived MSCs [17]. The data indicated an increase in ADORA2B (Figure 5B). We validated the RNA-Seq data by qPCR (Figure 5B). In particular, the results confirmed ADORA2B as the highest purinergic receptor on MSCs.
Decrease of ADORA2B within an Inflammatory Microenvironment
To investigate if ADORAB is regulated by extrinsic factors, we accessed the GEO database of MSCs within an inflammatory microenvironment [41]. The MSCs were exposed to the secretome of breast cancer cells (MDA-MB-231) in a Transwell system [41]. Since MDA-MB-231 cells produce several inflammatory mediators, these factors crossed the membrane to the MSCs [17]. There was a decrease in ADORA2B in the activated MSCs (Figure 5D). Other changes included increases in P2X1, 2, 5, 6, and 7; P2Y1, 2, 4, 6, 11, and 12; and ADORA2A. In contrast, P2X3, P2Y13, P2Y14, as well as ADORA1, ADORA2B, and ADORA3 were decreased, while P2X4 remained unchanged (Figure 5D). Together, these studies suggested that while ADORA2B could be involved in cell autonomous regulation of MSCs, this could be expanded to extrinsic influence when MSCs are within an inflammatory niche. In the latter scenario, ARORS2B was decreased. This led us to ask if cells with high levels of inflammatory mediators could decrease ADORA2B (next section).
ADORA2B on Breast Cancer Cell Subsets
In this set of studies, we used a breast cancer cell line (MDA-MB-231) to determine if subsets of the breast cancer cells show varied expression of ADORA2B. This question was relevant because it might determine if ADORA2B is involved in differentiation and dedifferentiation of cells. The selected MDA-MB-231 was relevant to address this question because this cell line has been shown to dedifferentiate from progenitors to cancer stem cells [41].
To demarcate subsets of MDA-MB-231, we applied a reported hierarchy of breast cancer cells in which subsets were sorted based on Oct4a expression. The three major subsets were designated Oct4a hi, Oct4a med and Oct4a lo [16]. The cancer stem cells are mostly in the Oct4a hi subset [16]. We analyzed each cell subset for ADORA2B using qPCR and western blot. The results showed the least level of ADORA2B in CSCs with the highest level in the Oct4a lo subset, which is the relatively differentiated subset (Figures 6A and 6B). The results of these findings are discussed in the next section.
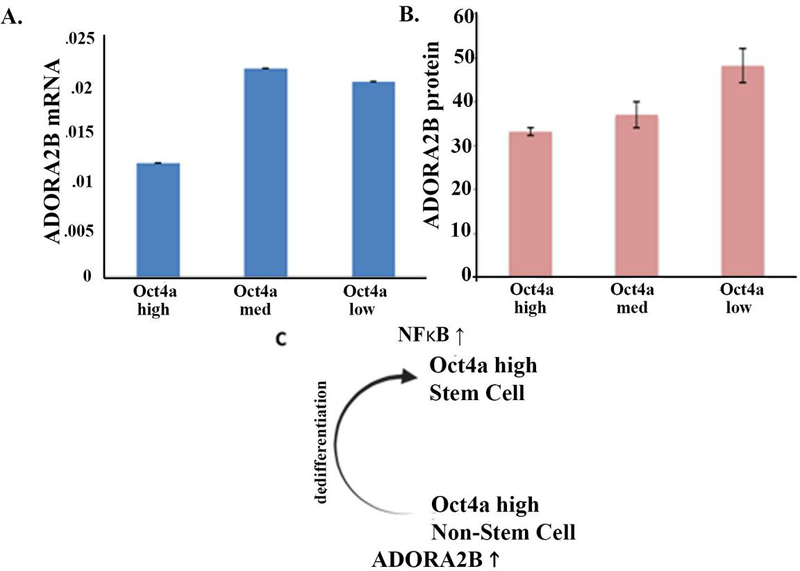
Figure 6 Expression of ADORA2B in BCC subsets. Breast cancer cells were sorted based on Oct4a expression [16]. ADORA2B levels were quantified in each subset by (A) qPCR and (B) western blot . The data in B and C were normalized with housekeeping control. (C) Shown is the graphical representation of a role of ADORA2B in dedifferentiation, after which NFB maintains multipotency.
Discussion
This study presents a framework for understanding how MSCs maintain multipotency. We reported on extrinsic and intrinsic factors. The results showed a critical role for NFB signaling to maintain MSC multipotency (Figures 1 and 2). Rel A siRNA was able to KD Oct4a within 24 h but showed a delay in reducing Sox2 (Figure 2). This delay is in line with the single Rel A predicted sited on the Sox2 regulatory region (Figure 1). Although in silico analysis showed potential binding sites for Rel A on stem cell-linked genes, other experiments confirmed the validity of the predicted outcome (Figures 1 and 2A). Specifically, the delayed decrease in Sox2 could be due to the single Rel A site on the regulatory region (Figure 1). Additionally, the decrease in the stem cell genes in Rel A KD MSCs correlated with loss of MSCs to differentiate into osteogenic and adipogenic cells, indicating loss of multipotency (Figure 2B). While control siRNA did not affect MSC proliferation, as determined by immunocytochemistry for Ki67, Rel A KD MSCs showed undetectable Ki67 (Figure 2C). The latter confirms differentiation when Rel A was decreased.
Canonical signaling emerged to be relevant to NFB signaling in MSCs. Using pharmacological inhibition of NFB associated molecules, the studies showed that IKK activity, in cooperation with IKK, was required for Rel A function and maintenance of multipotency (Figure 3). The information was determined at the level of gene transcript using real time PCR. Due to the lack of protein data, we were confident that the findings affected multipotency due to the change in morphology of the MSCs (Figure 3D). Overall, the data indicated that MSC stemness depends on the canonical NFB pathway.
Equally important is the influence of the inflammatory niche. Our unpublished studies showed that exposure to pro-inflammatory environments restored survival and promoted a more primitive phenotype. In an inflammatory environment there is a survival advantage of the MSCs with respect to viability and multipotency. This paradoxical support of stemness by inflammation highlights the importance of considering the host tissue environment when evaluating MSC behavior. This study showing a critical role for canonical NFB supports our unpublished studies since this transcription factor is activated by several inflammatory mediators (Figure 4).
Data from RNA-Seq of unstimulated MSCs showed an increase in ADRA2B, which was validated by real time PCR (Figures 5B and 5C). This contrasted with a decrease of ADORA2B in activated MSCs (Figure 5D). This was an interesting observation since ADORA2B is associated with the family of purinergic receptors that can be activated by energy. The extrinsic factors that regulate MSCs multipotency have been studied, especially by cytokines. The findings of ADORA2B were important since MSCs have paths to the clinic. This finding has implication for intrinsic regulation of MSCs. This finding is impactful for expansion of MSCs to the clinic because these stem cells will need to be available for off-the-shelf application. Since MSCs are provided with minimal growth promoting factors in cultures, we propose that ADORA2B could be a mechanism for self-autonomous regulation of multipotency.
The study expands to CSCs and its differentiated form. We premised that ADORA2B might be across all stem cells, including the CSCs. The results interestingly showed that Oct4a lo breast cancer cells show the highest level of ADORAB2 (Figures 6A and 6B). This was an insightful finding since Oct4a lo breast cancer cells have been shown to dedifferentiate into CSCs [17]. Thus, in healthy MSCs, ADOR2B could be linked to cell autonomous regulation to maintain multipotency and breast cancer, and ADORAB2 might be involved in dedifferentiation to CSCs. This finding is important to understand CSCS and therefore requires follow-up studies. We propose that ADOR2B might mediate dedifferentiation to CSCs and, at this time, stemness is maintained through NFB signaling (Figure 6C). Although we did not link NFB to ADORA2B, they could be linked since both were shown to be increased in MSCs.
Taken together, the insights of the study highlight NFB as a central integrator of stem cell biology, balancing internal signaling with external cues to ensure both survival and plasticity. Clinically, this dual regulation offers opportunities and risks; while it enhances the therapeutic utility of MSCs in inflammatory conditions, it also raises important questions about their long-term fate, including potential senescence, immune activation, or unintended differentiation. Future studies should focus on dissecting these long-term outcomes to ensure safe and effective clinical applications.
Funding
HU’s research on purinergic signaling has been supported by the National Council for Scientific and Technological Development (CNPq), such as the CNPq-funded National Institute of Science and Technology (INCT) for Purinergic Signaling: Challenges for 21st Century Health (CNPq, Grant No. [409156/2024-8])
References
[1] Aggarwal, S., and M. F. Pittenger. 2005. Human mesenchymal stem cells modulate allogeneic immune cell responses. Blood 105: 1815–1822.
[2] Barry, F. P., and J. M. Murphy. 2004. Mesenchymal stem cells: clinical applications and biological characterization. Int J Biochem Cell Biol 36: 568–584.
[3] Caplan, A. I., and S. P. Bruder. 2001. Mesenchymal stem cells: building blocks for molecular medicine in the 21st century. Trends Mol Med 7: 259–264.
[4] Sherman, L. S., M. P. Romagano, S. F. Williams, and P. Rameshwar. 2019. Mesenchymal stem cell therapies in brain disease. Semin Cell Dev Biol 95: 111–119.
[5] King, C., S. A. Patel, and P. Rameshwar. 2011. The role of human postnatal bone marrow-derived mesenchymal stem cells and their importance in growth, spinal cord injury and other neurodegenerative disorders. In Handbook of Growth and Growth Monitoring in Health and Disease. Springer. 1273–1287.
[6] Sherman, L. S., M. D. Castillo, M. H. Johnson, and P. Rameshwar. 2025. An Overview of the Biological Processes of Mesenchymal Stem Cells and Their Response to an Inflammatory Milieu. Intl J Transl Sci 2025: 25–68.
[7] Sherman, L. S., S. A. Patel, M. D. Castillo, R. Unkovic, M. Taborga, M. Gergues, S. Patterson, J. P. Etchegaray, M. Jaloudi, A. Hooda-Nehra, J. Kra, D. P. Rojas, V. T. Chang, and P. Rameshwar. 2021. NFB Targeting in Bone Marrow Mesenchymal Stem Cell-Mediated Support of Age-Linked Hematological Malignancies. Stem Cell Rev Rep 17: 2178–2192.
[8] Zhang, H., and S. C. Sun. 2015. NF-B in inflammation and renal diseases. Cell Biosci 5: 63.
[9] Liu, T., L. Zhang, D. Joo, and S. C. Sun. 2017. NF-B signaling in inflammation. Signal Transduct Target Ther 2: 17023–.
[10] Zuckerman, S. H., G. F. Evans, and L. Guthrie. 1991. Transcriptional and post-transcriptional mechanisms involved in the differential expression of LPS-induced IL-1 and TNF mRNA. Immunology 73: 460–465.
[11] Foxwell, B. M., J. Bondeson, F. Brennan, and M. Feldmann. 2000. Adenoviral transgene delivery provides an approach to identifying important molecular processes in inflammation: evidence for heterogenecity in the requirement for NFkappaB in tumour necrosis factor production. Ann Rheum Dis 59 Suppl 1: i54–59.
[12] Johnson, D. R., I. Douglas, A. Jahnke, S. Ghosh, and J. S. Pober. 1996. A sustained reduction in IkappaB-beta may contribute to persistent NF-kappaB activation in human endothelial cells. J Biol Chem 271: 16317–16322.
[13] Greco, S. J., S. V. Smirnov, R. G. Murthy, and P. Rameshwar. 2007. Synergy between the RE-1 silencer of transcription and NFkappaB in the repression of the neurotransmitter gene TAC1 in human mesenchymal stem cells. J Biol Chem 282: 30039–30050.
[14] Chan, Y. H., Y. C. Lee, C. Y. Hung, P. J. Yang, P. C. Lai, and S. W. Feng. 2021. Three-dimensional Spheroid Culture Enhances Multipotent Differentiation and Stemness Capacities of Human Dental Pulp-derived Mesenchymal Stem Cells by Modulating MAPK and NF-kB Signaling Pathways. Stem Cell Rev Rep 17: 1810–1826.
[15] Greco, S. J., K. Liu, and P. Rameshwar. 2007. Functional similarities among genes regulated by OCT4 in human mesenchymal and embryonic stem cells. Stem Cells 25: 3143–3154.
[16] Patel, S. A., S. H. Ramkissoon, M. Bryan, L. F. Pliner, G. Dontu, P. S. Patel, S. Amiri, S. R. Pine, and P. Rameshwar. 2012. Delineation of breast cancer cell hierarchy identifies the subset responsible for dormancy. Sci Rep 2: 906.
[17] Sandiford, O. A., R. J. Donnelly, M. H. El-Far, L. M. Burgmeyer, G. Sinha, S. H. Pamarthi, L. S. Sherman, A. I. Ferrer, D. E. DeVore, S. A. Patel, Y. Naaldijk, S. Alonso, P. Barak, M. Bryan, N. M. Ponzio, R. Narayanan, J. P. Etchegaray, R. Kumar, and P. Rameshwar. 2021. Mesenchymal Stem Cell-Secreted Extracellular Vesicles Instruct Stepwise Dedifferentiation of Breast Cancer Cells into Dormancy at the Bone Marrow Perivascular Region. Cancer Res 81: 1567–1582.
[18] Bliss, S. A., G. Sinha, O. A. Sandiford, L. M. Williams, D. J. Engelberth, K. Guiro, L. L. Isenalumhe, S. J. Greco, S. Ayer, and M. Bryan. 2016. Mesenchymal stem cell–derived exosomes stimulate cycling quiescence and early breast cancer dormancy in bone marrow. Cancer Res 76: 5832–5844.
[19] Potian, J. A., H. Aviv, N. M. Ponzio, J. S. Harrison, and P. Rameshwar. 2003. Veto-like activity of mesenchymal stem cells: functional discrimination between cellular responses to alloantigens and recall antigens. J Immunol 171: 3426–3434.
[20] Bliss, S. A., S. Paul, P. W. Pobiarzyn, S. Ayer, G. Sinha, S. Pant, H. Hilton, N. Sharma, M. F. Cunha, D. J. Engelberth, S. J. Greco, M. Bryan, M. J. Kucia, S. S. Kakar, M. Z. Ratajczak, and P. Rameshwar. 2018. Evaluation of a developmental hierarchy for breast cancer cells to assess risk-based patient selection for targeted treatment. Sci Rep 8: 367.
[21] Tibrewal, N., Y. Wu, V. D'Mello, R. Akakura, T. C. George, B. Varnum, and R. B. Birge. 2008. Autophosphorylation docking site Tyr-867 in Mer receptor tyrosine kinase allows for dissociation of multiple signaling pathways for phagocytosis of apoptotic cells and down-modulation of lipopolysaccharide-inducible NF-kappaB transcriptional activation. J Biol Chem 283: 3618–3627.
[22] Sandelin, A., W. W. Wasserman, and B. Lenhard. 2004. ConSite: web-based prediction of regulatory elements using cross-species comparison. Nucleic Acids Res 32: W249–252.
[23] Sun, S. C., and S. C. Ley. 2008. New insights into NF-kappaB regulation and function. Trends Immunol 29: 469–478.
[24] Israël, A. 2010. The IKK complex, a central regulator of NF-kappaB activation. Cold Spring Harb Perspect Biol 2: a000158.
[25] O'Mahony, A., X. Lin, R. Geleziunas, and W. C. Greene. 2000. Activation of the heterodimeric IkappaB kinase alpha (IKKalpha)-IKKbeta complex is directional: IKKalpha regulates IKKbeta under both basal and stimulated conditions. Mol Cell Biol 20: 1170–1178.
[26] Huang, Z., N. Xie, P. Illes, F. Di Virgilio, H. Ulrich, A. Semyanov, A. Verkhratsky, B. Sperlagh, S. G. Yu, C. Huang, and Y. Tang. 2021. From purines to purinergic signalling: molecular functions and human diseases. Signal Transduct Target Ther 6: 162.
[27] Franczak, S., H. Ulrich, and M. Z. Ratajczak. 2025. Hematopoietic stem cells on the crossroad between purinergic signaling and innate immunity. Purinergic Signal. 21.1: 3–9.
[28] Sattler, C., M. Steinsdoerfer, M. Offers, E. Fischer, R. Schierl, K. Heseler, W. Däubener, and J. Seissler. 2011. Inhibition of T-cell proliferation by murine multipotent mesenchymal stromal cells is mediated by CD39 expression and adenosine generation. Cell Transplant 20: 1221–1230.
[29] Eltzschig, H. K., J. C. Ibla, G. T. Furuta, M. O. Leonard, K. A. Jacobson, K. Enjyoji, S. C. Robson, and S. P. Colgan. 2003. Coordinated adenine nucleotide phosphohydrolysis and nucleoside signaling in posthypoxic endothelium: role of ectonucleotidases and adenosine A2B receptors. J Exp Med 198: 783–796.
[30] Kaebisch, C., D. Schipper, P. Babczyk, and E. Tobiasch. 2015. The role of purinergic receptors in stem cell differentiation. Comput Struct Biotechnol J 13: 75–84.
[31] Sun, Y., W. Hu, X. Yu, Z. Liu, R. Tarran, K. Ravid, and P. Huang. 2016. Actinin-1 binds to the C-terminus of A2B adenosine receptor (A2BAR) and enhances A2BAR cell-surface expression. Biochem J 473: 2179–2186.
[32] Zhao, N., G. Xia, J. Cai, Z. Li, and X. W. Lv. 2022. Adenosine receptor A2B mediates alcoholic hepatitis by regulating cAMP levels and the NF-KB pathway. Toxicol Lett 359: 84–95.
[33] Murphy, P. S., J. Wang, S. P. Bhagwat, J. C. Munger, W. J. Janssen, T. W. Wright, and M. R. Elliott. 2017. CD73 regulates anti-inflammatory signaling between apoptotic cells and endotoxin-conditioned tissue macrophages. Cell Death Differ 24: 559–570.
[34] Dominici, M., K. Le Blanc, I. Mueller, I. Slaper-Cortenbach, F. Marini, D. Krause, R. Deans, A. Keating, D. Prockop, and E. Horwitz. 2006. Minimal criteria for defining multipotent mesenchymal stromal cells. The International Society for Cellular Therapy position statement. Cytotherapy 8: 315–317.
[35] Sherman, L. S., M. Shaker, V. Mariotti, and P. Rameshwar. 2017. Mesenchymal stromal/stem cells in drug therapy: New perspective. Cytotherapy 19: 19–27.
[36] Le Blanc, K., C. Tammik, K. Rosendahl, E. Zetterberg, and O. Ringdén. 2003. HLA expression and immunologic propertiesof differentiated and undifferentiated mesenchymal stem cells. Exp Hematol 31: 890–896.
[37] Allard, B., M. S. Longhi, S. C. Robson, and J. Stagg. 2017. The ectonucleotidases CD39 and CD73: Novel checkpoint inhibitor targets. Immunol Rev 276: 121–144.
[38] Tan, K., H. Zhu, J. Zhang, W. Ouyang, J. Tang, Y. Zhang, L. Qiu, X. Liu, Z. Ding, and X. Deng. 2019. CD73 Expression on Mesenchymal Stem Cells Dictates the Reparative Properties via Its Anti-Inflammatory Activity. Stem Cells Int 2019: 8717694.
[39] Yang, J., X. Liao, J. Yu, and P. Zhou. 2018. Role of CD73 in Disease: Promising Prognostic Indicator and Therapeutic Target. Curr Med Chem 25: 2260–2271.
[40] Ramos, T. L., L. I. Sánchez-Abarca, B. Rosón-Burgo, A. Redondo, A. Rico, S. Preciado, R. Ortega, C. Rodríguez, S. Muntión, Á. Hernández-Hernández, J. De Las Rivas, M. González, J. R. González Porras, C. Del Cañizo, and F. Sánchez-Guijo. 2017. Mesenchymal stromal cells (MSC) from JAK2+ myeloproliferative neoplasms differ from normal MSC and contribute to the maintenance of neoplastic hematopoiesis. PLoS One 12: e0182470.
[41] Sandfeld-Paulsen, B., N. Aggerholm-Pedersen, R. Bæk, K. R. Jakobsen, P. Meldgaard, B. H. Folkersen, T. R. Rasmussen, K. Varming, M. M. Jørgensen, and B. S. Sorensen. 2016. Exosomal proteins as prognostic biomarkers in non-small cell lung cancer. Mol Oncol 10: 1595–1602.
International Journal of Translational Science, Vol. 2, 131–152
doi: 10.13052/ijts2246-8765.2025.022
© 2026 River Publishers