Fake News Detection by Image Montage Recognition
Martin Steinebach*, Karol Gotkowski and Huajian Liu
Fraunhofer SIT, Darmstadt, Germany
E-mail: steinebach@sit.fraunhofer.de
* Corresponding Author
Received 28 November 2019; Accepted 28 November 2019; Publication 28 January 2020
Abstract
Fake news have been a problem for multiple years now and in addition to this “fake images” that accompany them are becoming increasingly a problem too. The aim of such fake images is to back up the fake message itself and make it appear authentic. For this purpose, more and more images such as photo-montages are used, which have been spliced from several images. This can be used to defame people by putting them in unfavorable situations or the other way around as propaganda by making them appear more important. In addition, montages may have been altered with noise and other manipulations to make an automatic recognition more difficult. In order to take action against such montages and still detect them automated, a concept based on feature detection is developed. Furthermore, an indexing of the features is carried out by means of a nearest neighbor algorithm in order to be able to quickly compare a high number of images. Afterwards, images suspected to be a montage are reviewed by a verifier. This concept is implemented and evaluated with two feature detectors. Even montages that have been manipulated with different methods are identified as such in an average of 100 milliseconds with a probability of mostly over 90%.
Keywords: Fake news, montage, collage, image, feature matching.
1 Introduction
“Fake News” is a term familiar to most people today. Coined by the American President Donald Trump during his election campaign [2], the term [17] describes the spread of manipulative false information through social media, but also through traditional media. Social media in particular can lead to a rapid spread of fake news. Many people pass them on to friends and contacts without trying to verify them. This rapid spread and frequency of fake news has become a growing problem in recent years. If the false news is also supported by corresponding false images, fake news can be much more convincing for many people leading to an even faster spread.
Images used in fake news can be unedited. They can come from a completely different context or another time and have been picked out by the originator of the fake news to support its message. To identify misuse in this case, inverse image search or a local image database can be applied. In both ways the strategy is to find the original context of the image and thereby to show that the image does not come from the context stated in the fake news.
Another way to misuse images in fake news is digital processing. One variant of digital processing is photo-montage, where image content is composed of several other images, and to look as real as possible. Others include intra-image manipulations like copy-move or cropping.
Recognizing a photo montage in order to assist in identifying fake news is challenging due to the vast amount of traffic created by Internet news portals and social media. A review by human observers would be expensive and time consuming. And as digital processing of images is so advanced today, the human eye would not be able to identify manipulations.
Therefore automation is the only chance to fight fake news and misuse of images within it. There are multiple approaches for manipulation and detection which we will briefly discuss in the following chapters. In our paper we show how image montages can be identified based on the knowledge about images previously used in news and therefore available to the attackers, as the example shown in Figure 1. As the number of test data for evaluation is limited, we also introduce a concept for automated image montages.
2 State of the Art
Identifying image manipulations is a complex field, especially when one also considers re-use of images already as a potential attack. On the one hand, there are methods for image manipulation which change the meaning of an image. Then there are re-uses of images which are not modified, but used in a different context. Image montages are a combination of both approaches: An existing image is used out of context but is also manipulated by adding one more objects from other images to change its meaning.
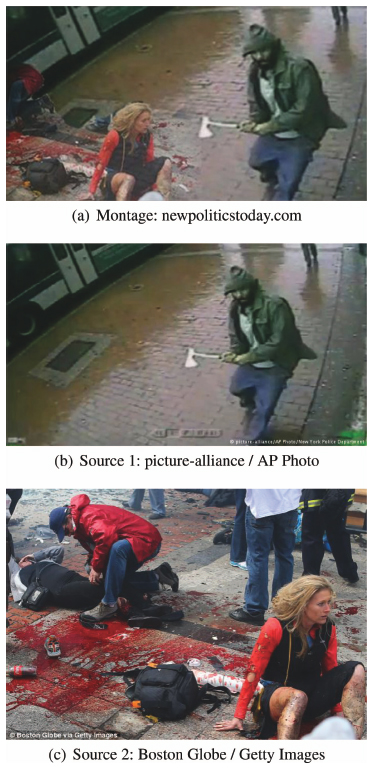
Figure 1 Example of image montage from 2017. Sources of the image (a) are (b) and (c).
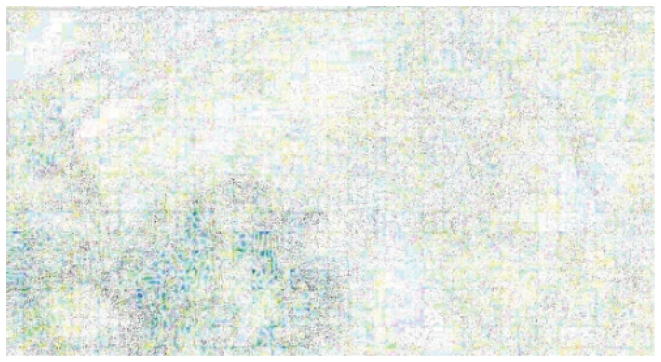
Figure 2 Error level analysis of Figure 1(a).
2.1 Image Manipulation Detection
There are many methods for manipulation detection in digital images. Today they can roughly be assigned to two classes: methods based on models and patterns defined by humans and methods based on supervised machine learning. For the first group there are already multiple survey papers [6, 8] available. A generic approach is to calculate error level differences caused by different compression histories of areas, as for example discussed in [14]. The results of this analysis can be hard to interpret. Figure 2 shows an example for the manipulated image of Figure 1(a).
2.2 Image Re-Identification
Image re-identification is a domain where robust hashing [16] or perceptual hashing [15] have shown best results in the past. The challenge with re-identification is to identify images which are copies of a known source without being too sensitive to reject image changes caused by usual image processing, e.g. lossy compression. On the other hand one needs to avoid identifying similar images as duplicates because similarity does not qualify for an actual recognition of re-use.
2.3 Feature Detection
Feature detection consists of detecting so-called keypoints at several locations in an image using a detector and extracting descriptors using a feature extractor. In a further step, the feature comparison, the found features are compared with features of another image. If both images now contain the same object, the features should ideally be measurably similar. A feature itself is defined as an “interesting” part of the image. What exactly is understood as an “interesting” part of the image varies depending on the feature detector. The image part, where a feature is extracted, is often either an isolated point, a continuous curve, or a connected region.
SIFT The Scale Invariant Feature Transform (SIFT) [13] algorithm is probably one of the best known and most widely used feature detectors. SIFT finds keypoints in an image using the Difference-of-Gaussian (DOG) operator. DOG is used to search for local extrema over several image sizes. Thus keypoints can be found which are preserved even if the image size changes. For each of these keypoints the strongest orientation from the neighborhood is then assigned.
SURF The Speeded Up Robust Features (SURF) detector [5] is partly inspired by SIFT and is an attempt to be faster and more robust than SIFT. Like SIFT, SURF is based on the Difference-of-Gaussian (DOG). To detect keypoints, SURF uses an integer approximation of the Hessian Blob detector. The feature extractor uses the sum of the hair wavelet response around the keypoint from which a 64 D vector is calculated.
AKAZE The Accelerated-KAZE (AKAZE) Feature detector [1] is based on the KAZE detector and also uses non-linear diffuse filtering with the difference that the non-linear scale space is created using Fast Explicit Diffusion (FED). The feature detector is based on the Hessian Blob Detector. The rotation invariance is improved compared to KAZE by using Scharr filters. Extrema of the detector are used as keypoints. The descriptor is based on the Modified Local Difference Binary (MLDB) algorithm, which is also very efficient.
2.4 Feature Filtering
Since most feature detectors detect too many keypoints per image the number of keypoints can be reduced by filtering. In most cases, TopN is used, which simply retains only the strongest features. Another possibility is ANMS (Adaptive non-maximal suppression). ANMS aims to keep only the best keypoints in an image, but at the same time ensures that they are equally distributed over the entire image. Several approaches have been developed to implement ANMS filtering, with the first ANMS-Filter being from M. Brown [9]. However, with a quadratic complexity the runtime was too high. As an alternative, faster methods were proposed, such as the approach of Z. Cheng [11] who uses KD trees for acceleration or the SDC (Suppression via Disk Covering) approach by S. Gauglitz [12].
2.5 Indexing
Annoy [7] (Approximate Nearest Neighbors Oh Yeah) is a fast and memory efficient nearest neighbor search algorithm based on binary trees. Annoy is able to index and search data represented as points. Indexing is done by splitting the set of points recursively with random hyperplanes. The result is a binary tree that can be searched quickly. To increase accuracy multiple trees of the same set of points can be created.
3 Approach
For the montage detection task, an approach was chosen that compares images using features. Since features can be detected across the entire image content, a feature-based approach makes it relatively easy to compare the similarity of entire images or even individual image parts with each other.
3.1 Structure
The montage recognition itself is divided into two main components. The first main component is initialization, in which an image database is processed once into a searchable index. The second main component is the query, in which an input image is processed and compared with the index. These two main components are in turn divided into several processing steps, some of which are common. The individual processing steps are:
- Feature Detection: The image is examined for key-points of features using a feature detector.
- Filtering: Found features are filtered using a filtering method to reduce the number of features.
- Feature Extraction: The feature descriptors are created using a feature extractor.
- Indexing: The feature descriptors are indexed and saved as a database.
- Matching: The feature descriptors of an input image are compared with the descriptors in the database and grouped into matches.
- Verification: The structure of the features of the matches is compared with each other.
3.1.1 Initialization
The following processing steps are used for initialization: first, a database is created for feature storage. Using a selected feature detector, the keypoints for each image are created. This is followed by filtering which reduces the number of keypoints to be used. Then the descriptors of the individual keypoints are determined. An index is then created from the descriptors using a selected indexing method. For feature generation, we use a GPU version of SIFT [10] and SURF. AKAZE was not included as we could not find a stable GPU implementation.
3.1.2 Query
The query is processed as follows: First, an input image is provided where a feature detection is performed. As with initialization, filtering is then performed and the descriptors extracted. This is followed by matching the descriptors with the descriptors in the index using the indexing procedure. The result is a set of matches that assign descriptors to each other. A match consists of a descriptor from the initial image and the most similar descriptor from an image in the database. If enough matches were found that refer to the same image, it is likely that an object is recognized. In an additional step, however, this is checked again.
3.2 Key Elements
In the following subsections, we discuss some key elements of our approach in more detail.
3.2.1 Feature detection and filtering
A montage consists of one or more objects from different images. The recognition of the individual objects takes place by means of feature detection. Feature detectors usually respond particularly to inhomogeneous surfaces and find features on images without homogeneous surfaces over the entire image. Homogeneous surfaces are monotonous surfaces without structure, such as a cloudless sky or a low-resolution image of a road. The widely used feature detector SIFT can find 30,000–40,000 features on a 1000 × 1000 pixel image without homogeneous areas. Such a high number of features is unnecessary in our application case and would cause the image index to grow to a point which would render the memory usage unacceptable.
Therefore we use a filtering method to select only a small amount of features and discard the rest. Feature detectors evaluate the strength of the features found. With an appropriate filtering procedure, it can be ensured that in both images only the strongest features will be selected and the matching quota is not reduced.
A common method to reduce the number of features and is TopN filtering. This filtering method leads to a problem in connection with montage detection. If only the strongest features are retained, there are often no or very few features left in parts of an image, even if this part of the image is inhomogeneous [3]. In the case of a montage, it can now happen that there are no or not enough features on an object and that this object can no longer be recognized as copied image content. In order to solve this problem, a ANMS filtering method [4] is applied which guarantees an equal distribution of the features over the entire image after filtering. By distributing features equally, it is very likely that enough features will still remain on the object after filtering. Ideally, this reduces the number of features without causing a decreased recognition rate.
3.2.2 Matching
The matching of features from the input image is conducted by searching the most similar features in the computed index. For indexing the nearest neighbor algorithm Annoy is used.
3.2.3 Mesh verifier
To check that found montages are not false positves a verification algorithm named “Mesh Verifier” has been implemented. The matched features of the input image and the matched image from the database are provided to it. If the structure of the features on the respective images is very similar, the detection of a montage is confirmed.
To do this, the following procedure is applied for the feature matches on each image: the basic condition is that there are at least three matches on the image. First, the first three features in the list are selected for the image and considered as a triangle. The inner angles are now determined for this triangle. The same process is performed for the first three features on the second image. Then the corresponding inner angles are compared with each other. If the difference between the two inner angles is less than a selected threshold value, both triangles are classified as similar and are accepted. This process is now repeated for all features. If the ratio of the accepted triangles and unaccepted triangles lies over a further threshold value, the result of the verification is positive. The advantage of the procedure is that it is invariant to scaling and rotation. In addition, it is also robust against outliers, since each triangle is independent of the others. Depending on the threshold values selected, it is therefore possible to lower the FPR without affecting the TPR.
3.2.4 Number of features
The number of features to be used per image is one of the most important settings. It has a strong influence on the recall on the one hand and on the memory requirements on the other hand. Therefore a reasonable compromise has to be made between the two. To reduce memory usage, a smaller number of features are stored during the indexing and database creation than that used for the searching. It was tested on 1000 × 1000 pixel images with an object size of maximum 200 × 200 pixels. In the end, a number of 500 indexing features and 2000 searching features selected as a compromise for the settings. This will still result in a high Recall, but at the same time also a reasonable memory consumption. Figure 3 illustrates this.
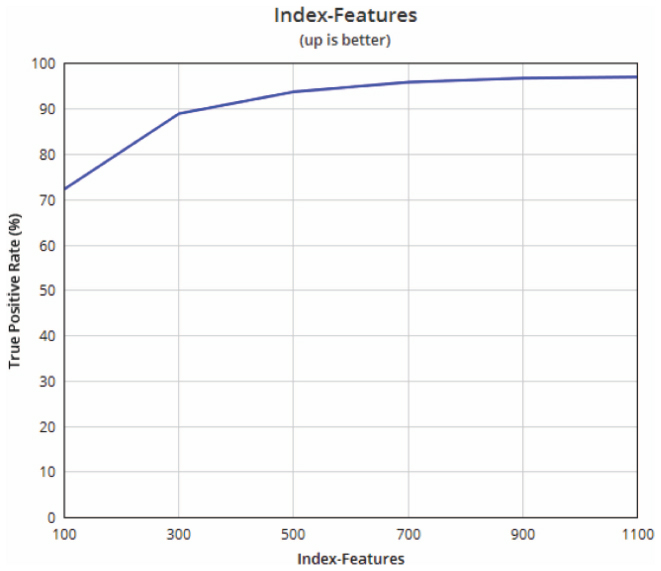
Figure 3 Dependency number of features and recall.
4 Evaluation Concept
As the amount of available examples for montages is limited, for evaluating our approach we have developed a simple ‘montage synthesizer’. Bases on the examples created by it, we then evaluate the performance of our approach under varying circumstances like compression, rotation and blurring.
4.1 Example Synthesis
In order to create the evaluation examples, a separate application was created to generate the databases and montages due to a lack of available material. Using image search engines, many montages can be found quickly, but it is often extremely difficult to find the matching originals. In addition, a manual search of several thousand montages would be too time-consuming, which is why a separate application appears to be the best option. The application requires three sets of images to create a database and montages.
- The first image set is PNG images of objects on a transparent background. These are mainly people, but also other objects such as cars and random objects. These were downloaded from Google and stickpng.com using a crawler. The images were then checked for duplicates.
- The second image set consists of random images that mostly show everyday situations. These images serve as a background for the objects to create montages. Images from the image sets 2017 Unlabeled images (123 k) from ‘COCO – Common Objects in Context’ and The INRIA Holidays dataset (1.4 k) were used for this purpose.
- The third image set mainly also consists of images from COCO and INRIA Holidays which were not used in the second set. The aim of the third image set is to provide counter-examples and unknown images. This makesit possible to test how prone the individual procedures are to false positives.
All images were scaled to have approximately the same resolution. The application now proceeds to create the database and the montages in such a way that the objects are copied lo the backgrounds and the object or the finished overall picture is changed by manipulations.
First, the number of objects to be included in a montage is selected. In Figure 4 only one object (the runner) is chosen. It is manipulated and copied to two different backgrounds with random positions. The first of these two resulting images (Figure 4(b)) is then inserted into the database. This image is called the object image and represents the (synthesized) original. The background image (Figure 4(c)) of the second time (Figure 4(d)) is also inserted into the database. The second image represents the montage and is used in tests as an input image.
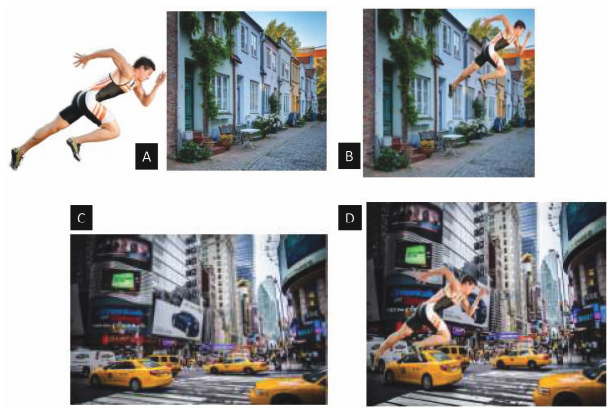
Figure 4 Example synthesis; A: Object and background, B: Combined image, C: New Background, D: Montage.
The intention of this procedure is to reproduce the creation of a montage: for creating it, one would select some images (the object images), then cut out the objects and inserts them into another image (the backgrounds). In this way databases have been created with a total size of 3.000 images consisting of object images and backgrounds. These databases were subsequently updated with 1.500 montages and unknown images.
4.2 Test Parameters
Manipulations that were performed on the elements of the montages and to which the detection should be invariant are the following:
- Image scaling: With image scaling, the resolution of the montage and the object image is scaled up or down. In the following, this type of manipulation is often referred to simply as Image Resolution or abbreviated to (I). Five levels were selected as possible resolutions for this:
- Level 1: 1000 × 1000 pixels
- Level 2: 800 × 800 pixels
- Level 3: 600 × 600 pixels
- Level 4: 400 × 400 pixels
- Level 5: 200 × 200 pixels
- Object Scaling: With object scaling, the object is reduced or enlarged in both the montage and the object image. In the following, this type of manipulation is often referred to simply as object size or abbreviated to (O). As possible sizes for an object 4 steps were selected: 50%, 40%, 30%, 20% of the total image. 50% means, for example, that an object theoretically occupies 50% of the surface area of the assembly or of the object image.
- Object Rotation: During object rotation, an object on the montage rotates clockwise or counterclockwise by a maximum of 180°, while it remains unchanged on the corresponding object image. In the following, this type of manipulation is often simply called object rotation or abbreviated to (R). Nine levels have been selected as possible rotations for an object: 10, −10, 20, −20, 30, 40, 60, 180.
- Addition of Noise: Here a montage as whole is subject to Gaussian noise. In the following, this type of manipulation is often called Image Noise or abbreviated to (N). Four levels of Gaussian noise were selected:
- No noise (Disabled)
- Weak, mean = (10, 12, 34)/3, variance = (1, 5, 25)/3
- Medium, mean = (10, 12, 34)/3, variance = (1, 5, 25)/3
- Strong, mean = (10, 12, 34)/3, variance = (1, 5, 25)/3
- Object Concealment: Here a concealment is simulated for an object during assembly of the montage. In the following, this type of manipulation is often simply called Object Occlusion or abbreviated as (OC). As possible masking for an object, 4 levels were selected for this: 0%, 20%, 40% and 60% masking of the object. Since it is difficult to automatically generate a real masking for images, the object is cropped instead. The result looks optically different than a masking, but leads to the same results in feature detection.
Figure 5 shows a few examples of manipulations. Image mirroring was not evaluated as both SIFT and SURF are known not to be robust against it. Dealing with this can easily be done by mirroring input images once and re-running the evaluation.
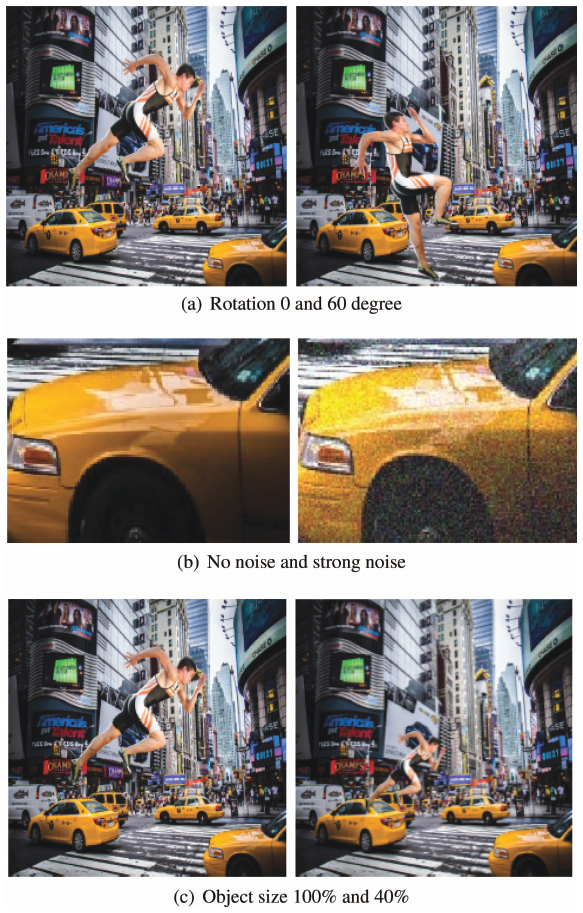
Figure 5 Example manipulations.
5 Evaluation Results
With the described method databases were created with a total size of 3000 images, consisting of object images and backgrounds.
These databases were each evaluated with 1500 montages and unknown images. For better evaluation, each montage is composed of a single object and a background image to prevent sources of error that do not come from the manipulations used. This includes, for example, a possible partial concealment of objects, which could never be completely ruled out, but which would falsify a test with regard to rotation invariance.
During the tests carried out, the object and the background in an montage potentially can always each be detected once. As usually much more of the background is visible than of the object, both detection performances cannot be compared as the algorithm will have a much harder task with object recognition. Accordingly, the metrics for background and object detection are measured separately. If all backgrounds in a database are correctly detected, but no object images, the TPR would be 100% for the background and 0% for the object images. However, the evaluation will show that in almost all test cases the TPR and TNR are exactly 100% for the recognition of the backgrounds.
For this reason, detailed statistics are only shown for object recognition. For background detection, only the mean values of Recall and Precision are shown for all tests together for clarity. Otherwise the use of the terms TPR, Recall, FPR and Precision refers exclusively to the detection of objects. Also for the object recognition only statistics for the TPR are specified. The reason for this is that the Mesh Verifier used is very reliable. As a consequence, there are de facto no false positives. The FPR is usually 0.3% or less. We go through a number of selected results and discuss them in the following subsection. A comparison between SIFT and SURF for some attacks is given in Table 1. In this table, only results for the highest resolution of 1000 × 1000 pixel are shown.
5.1 Feature Filtering
The ANMS filtering was compared with TopN in terms of TPR. In particular, the invariance of ANMS and TopN regarding the different manipulations were tested. Surprisingly, the use of ANMS showed to at least slightly reduce the TPR in all cases by a about 3% in comparison to TopN. Especially in very noisy images the TPR decreased significantly by about 15%. A possible explanation is that for filtering keypoints the local region is taken into account. Since in a montage the local regions at the boundaries of an object are different to both of the images the montage derived from, other keypoints may be filtered in these regions. This will decrease the matching rate in this area. The same effect also occurs in montages with strong noise. As a consequence, ANMS was omitted and TopN was used instead for all tests in order to achieve the best results.
Table 1 Examples of precision with SIFT and SURF
| Precision |
|||
| Attack | SIFT | SURF | |
| Image Scaling | 50% | 0.9986 | 0.9993 |
| 40% | 0.9993 | 0.9987 | |
| 30% | 1 | 0.9993 | |
| 20% | 0.9988 | 0.9993 | |
| Rotation | 10° | 0.9993 | 0.9993 |
| −10° | 0.9972 | 0.9993 | |
| 20° | 0.9993 | 0.9993 | |
| −20° | 0.9993 | 0.9993 | |
| 30° | 0.9993 | 0.9993 | |
| 40° | 0.9993 | 0.9986 | |
| 60° | 0.9979 | 1 | |
| 90° | 0.9951 | 0.9986 | |
| 180° | 0.9972 | 0.9993 | |
| Noise | Disabled | 0.9986 | 0.9993 |
| Weak | 0.9986 | 0.9993 | |
| Medium | 0.9979 | 1 | |
| Strong | 0.9965 | 0.9993 | |
5.2 Image Scaling
The test is performed with five different resolution levels in combination with four different object sizes. The SIFT shows a continuous TPR of 90% or more regardless of the resolution as long as the object size does not drop below 40%. At 40%, however, the TPR is reduced considerably in comparison. The mean value of the FPR is 0.16% and thus the precision rounded off to 0.99.
5.3 Object Scaling
The test is performed with four different size differences in combination with two different resolutions. For SIFT shows that the TPR deteriorates irregularly but remains above 80%. The mean value of the FPR is 0.13% and thus the precision rounded off to 0.99. The results are therefore consistently robust and precise. With SURF object sizes of 30% or larger can be recognized with TPR values of over 90%. Even for an object size of 20%, a TPR of 90% is achieved with a resolution of 600 × 600 pixels. From a resolution of 400 × 400 pixels or less, all TPR values start to change significantly and the results will deteriorate. The mean value of the FPR is 0.04% and thus the precision rounded off at 0.99. The results show that almost independent of the object size, the detection is robust unless much too small resolutions are used.
Table 2 Comparison of SIFT and SURF performance with object scaling
| SIFT |
SURF |
||||||
| Object Size | Scaling | TRP: | FPR: | Prec.: | TPR: | FPR: | Prec.: |
| 1000 × 1000 | 50% | 95.67% | 0.20% | 0.9986 | 99.13% | 0.10% | 0.9993 |
| 40% | 89.47% | 0.10% | 0.9993 | 98.93% | 0.20% | 0.9987 | |
| 30% | 79.80% | 0.00% | 1.0000 | 98.00% | 0.10% | 0.9993 | |
| 20% | 54.60% | 0.10% | 0.9988 | 94.33% | 0.10% | 0.9993 | |
| 800 × 800 | 50% | 95.40% | 0.20% | 0.9986 | 98.93% | 0.10% | 0.9993 |
| 40% | 91.07% | 0.10% | 0.9993 | 98.47% | 0.00% | 1.0000 | |
| 30% | 80.27% | 0.20% | 0.9983 | 97.73% | 0.10% | 0.9993 | |
| 20% | 56.73% | 0.00% | 1.0000 | 91.73% | 0.00% | 1.0000 | |
| 600 × 600 | 50% | 95.47% | 0.30% | 0.9979 | 99.47% | 0.00% | 1.0000 |
| 40% | 91.00% | 0.00% | 1.0000 | 99.00% | 0.10% | 0.9993 | |
| 30% | 79.67% | 0.00% | 1.0000 | 96.87% | 0.20% | 0.9986 | |
| 20% | 56.60% | 0.10% | 0.9988 | 89.47% | 0.10% | 0.9993 | |
| 400 × 400 | 50% | 94.40% | 0.10% | 0.9993 | 98.93% | 0.00% | 1.0000 |
| 40% | 90.20% | 0.20% | 0.9985 | 97.40% | 0.00% | 1.0000 | |
| 30% | 77.87% | 0.00% | 1.0000 | 93.80% | 0.00% | 1.0000 | |
| 20% | 58.20% | 0.00% | 1.0000 | 77.00% | 0.00% | 1.0000 | |
| 200 × 200 | 50% | 95.87% | 0.00% | 1.0000 | 90.93% | 0.00% | 1.0000 |
| 40% | 91.27% | 0.00% | 1.0000 | 83.00% | 0.00% | 1.0000 | |
| 30% | 81.27% | 0.00% | 1.0000 | 62.87% | 0.00% | 1.0000 | |
| 20% | 58.93% | 0.00% | 1.0000 | 19.00% | 0.00% | 1.0000 | |
Table 2 allows a direct comparison. SURF performs better for most resolutions but significantly worse at 200 × 200.
5.4 Object Rotation
Object rotation is tested with a series of rotations with a 1000 × 1000 pixel image resolution. In addition, three rotations are tested in combination with three resolution levels. A TPR of over 90% is continuously achieved with the lowest values in the range of 40° rotation. The mean value of the FPR is 0.25% and thus the precision rounded off at 0.99. Figures 6 and 7 show that both SIFT and SURF perform equally well with rotation.
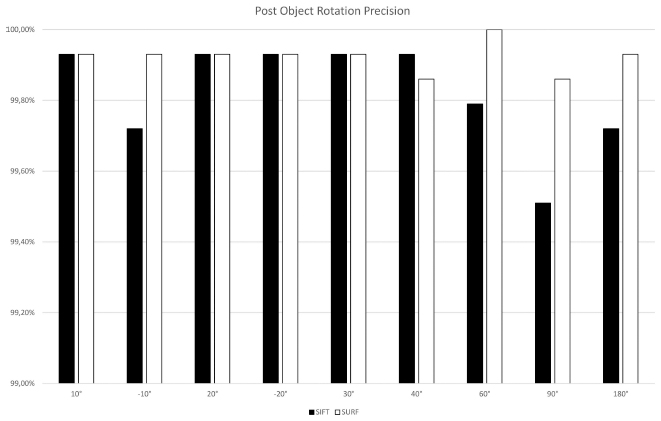
Figure 6 Results for SIFT and SURF precision with object rotation.

Figure 7 Results for SIFT and SURF recall with object rotation.
Table 3 Image noise
| SIFT |
SURF |
||||||
| SIZE | Noise | TPR: | FPR: | Prec.: | TPR: | FPR: | Prec.: |
| 1000 × 1000 | Disabled | 95.67% | 0.20% | 0.9986 | 99.13% | 0.10% | 0.9993 |
| Weak | 95.27% | 0.20% | 0.9986 | 98.20% | 0.10% | 0.9993 | |
| Medium | 94.40% | 0.30% | 0.9979 | 97.00% | 0.00% | 1.0000 | |
| Strong | 94.93% | 0.50% | 0.9965 | 91.93% | 0.10% | 0.9993 | |
| 800 × 800 | Disabled | 95.40% | 0.20% | 0.9986 | 98.93% | 0.10% | 0.9993 |
| Weak | 94.13% | 0.30% | 0.9979 | 98.67% | 0.10% | 0.9993 | |
| Medium | 95.73% | 0.50% | 0.9965 | 97.80% | 0.00% | 1.0000 | |
| Strong | 93.80% | 0.50% | 0.9965 | 92.60% | 0.10% | 0.9993 | |
| 600 × 600 | Disabled | 95.47% | 0.30% | 0.9979 | 99.47% | 0.00% | 1.0000 |
| Weak | 95.27% | 0.10% | 0.9993 | 98.67% | 0.00% | 1.0000 | |
| Medium | 95.60% | 0.10% | 0.9993 | 97.67% | 0.00% | 1.0000 | |
| Strong | 94.47% | 0.10% | 0.9993 | 93.53% | 0.10% | 0.9993 | |
5.5 Image Noise
The test is performed with four different noise levels in combination with three resolution levels. The results for SIFT show that the TPR are consistently above 93% independent of the noise level. With SURF the TPR is consistently over 90% independent of the resolution. The mean value of the FPR is 0.05% and thus the precision rounded off at 0.99. The average value of the FPR is 0.05%. Detailled results are given in Table 3.
5.6 Lighting
Image lighting changes the lighting of an assembly as a whole. In the following, this type of manipulation is often referred to simply as image lighting or abbreviated to (IL). Four different strengths of lightning changes were evaluated:
- No change in illumination (Disabled), beta = 0
- Little change in illumination (Weak), beta = 40
- Average change in illumination (Medium), beta = 60
- Strong change in lighting (Strong), beta = 80
To change the illumination the convertTo method existing in OpenCV is called with the parameter ‘beta’. The used values of the parameter are listed above. Figure 8 shows the various levels of lighting.
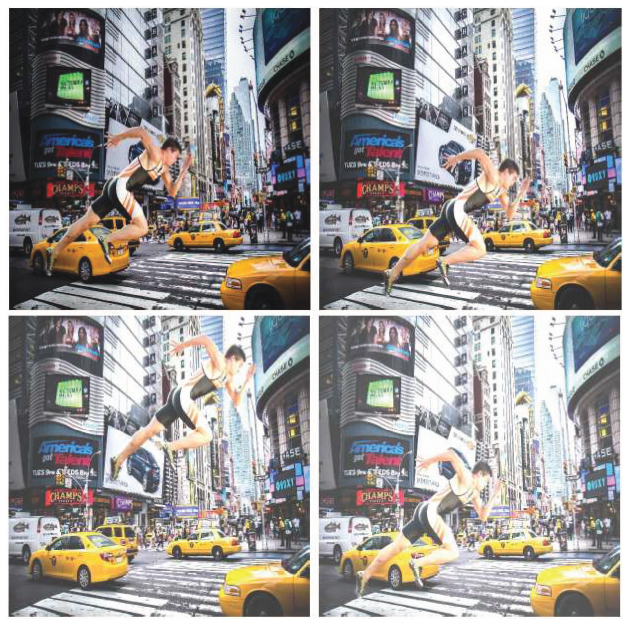
Figure 8 Examples for image lighting.
5.7 Object Concealment
The test is performed with four different masking levels in combination with two resolution levels. Figure 9 shows examples of different concealment levels. With SIFT the TPR is over 86% up to a masking of 40% of the total object. However, the TPR falls continuously. After a masking of 40%, the TPR starts to sink strongly and is at a masking of 60% of the object at about 55%. The mean value of the FPR is 0.12% and thus the precision is rounded off at 0.99. The average value of the FPR is 0.12%.
For SURF the TPR is over 96% up to a masking of 40% of the total object. Only then does the TPR begin to sink and is at a masking of 60% of the object at about 85%. The mean value of the FPR is 0.14% and thus the precision rounded off is 0.99.
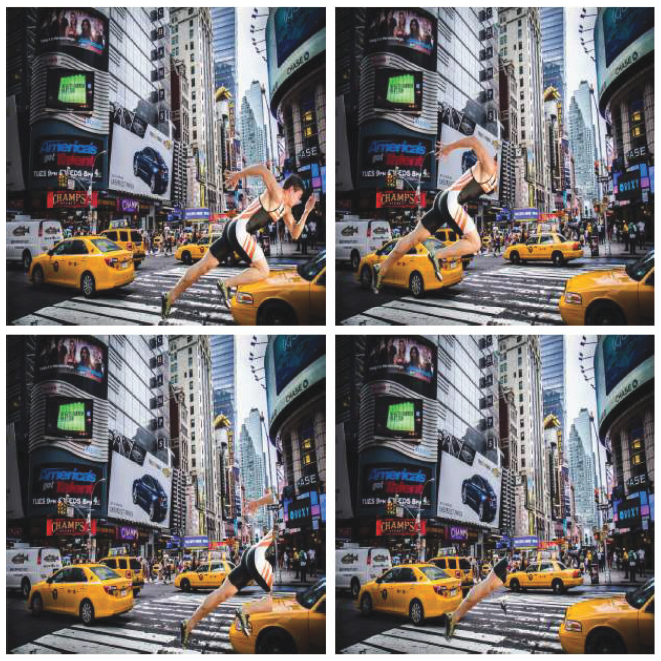
Figure 9 Examples for object concealment.
5.8 Verifier Test
For applications that use feature detection, 10–20 matches are required to identify an identical object on two images. In our application, this threshold leads to a high FPR. As a solution to this problem the Mesh Verifier was developed.
For evaluation, 2350 duplicate free images of a public person were used. These pictures are all very similar and show the person in different situations. Since these images are not collages, they are especially suitable for the evaluation.
The picture set was divided into two equal quantities: 1182 Object images that have been indexed and 1168 unknown images that were queried. This was done once with the verifier switched off (disabled Verifier) and once with it turned on. SURF is used as feature detector. The result was an FPR of 44.84% with 530 false positives when the Mesh Verifier was switched off. With the Verifier turned on, the FPR dropped to 4.65% with 55 false positives. This represents a reduction of the FPR by a factor of more than 9 times.
5.9 Performance
Besides evaluating the recognition capabilities of our approach, we also analyzed the performance of the different strategies. We used a standard PC with a Nvidia GTX 970 GPU featuring 4 GB graphic RAM. Searching takes 100 milliseconds on average, verification 10 milliseconds. Figure 10 shows the computation time in dependence of the size of image set. Both SIFT and SURF performed similar here. The advantage of SURF is its lower memory usage.
The memory consumption (Index Size) measures how much memory the index requires when using SIFT or SURF for databases of different sizes. It should be noted that the index must be loaded completely into the working memory and therefore an index that is too large can be problematic. For the memory consumption only the index is considered, although also a configuration file and the keypoints of the pictures are stored. However, the configuration file is minimal and the keypoints are only needed for verification and can be loaded individually. Therefore, only the memory consumption of the index is relevant. There is a linearly increasing memory consumption of SIFT and SURF with a continuous increase in the size of the database. It turned out that the memory consumption of SIFT, however, is on average 90% larger than that of SURF. With a database that contains 3000 Images contain 500 index features each, SIFT’s memory consumption is 767 MB, while it is only 405 MB for SURF.

Figure 10 Search performance of the different elements of our approach for the SIFT variant.
5.10 Summary
SIFT has achieved consistently good to very good TPR and FPR, and thus Precision, especially in Image Resolution, Object Size Change, Object Rotation and Image Noise. However, a weakness can be seen in Object Size. Here the TPR decreased almost linearly. This is to be expected to a certain extent, because with a smaller object size less features can be found on the object. The strength with which this happens, however, is surprising, especially in comparison with SURF. For 50% and 40% object size still very good values were achieved with the TPR, but then decreased more and more. There are no obvious reasons for this behavior. In Object Occlusion good values are achieved for up to 40% occlusion. Only then does the TPR begin to sink more strongly. But a occlusion of 60% is already an extreme value.
Just like SIFT, SURF also shows a consistently good to very good TPR and FPR for Object Size Change, Object Rotation and Image Noise. In some cases the TPR of SURF even exceeds that of SIFT by a few percent. However, this is no longer decisive for TPR values of clearly over 90% in most cases. As with SIFT, SURF has problems with reduced object size. This problem is much smaller than with SIFT. At an image resolution of 200 × 200 pixels the TPR decreases strongly when the object size is changed. Interestingly enough, SURF also has a problem when the resolution of an image drops drastically. Montages with image resolution of 200 × 200 pixels are not really relevant cases, but as shown in Table 2 the TPR drops significantly in this case. The Object Occlusion causes less problems for SURF than for SIFT. So even with 60% concealment a TPR over 80% was achieved.
We also verified that the approach works on real-world examples. The montage from image 1 shown in the introduction of this work was successfully identified as being composed of elements from two sources. Figure 11 shows the detected area by a green border and the recognized features by colored dots. The upper pair shows the background, the lower pair the inserted object.

Figure 11 Detection of the image sources based on SURF features.
6 Summary and Conclusion
The aim of this work was to achieve a fast, accurate and robust detection of image montages. A concept was developed and implemented in an application based on feature detection. Detected features of images are reduced by filtering and stored with an indexing procedure for fast comparison.
The features of an input image are efficiently compared with those in the index and a suspicion of an montage is confirmed or rejected by means of a mesh verifier. For this several procedures were evaluated. The feature detectors applied in our work are a GPU version of SIFT and SURF. Both achieved a high recall and a high precision and are therefore very suitable. However, due to the features used, both show high memory requirements when processing a large number of images, but SURF performs significantly better with respect to memory usage.
Coming back to the challenge from the introduction, we find our approach to be suitable for montage recognition in the context of ‘fake news’ detection and similar forensic cases. It is an alternative to image forensics based on finding traces of splicing and will produce better detection results compared to it. It requires setting up a database of known images, which is suitable for a news agency that needs to verify images with respect to their authenticity. The performance of the system is sufficient to run a test on a set of more than a million images on a standard PC.
6.1 Future Work
Our work is based on the assumption (and professional experience) that image montages are created by using two existing images as sources and merging them. As large portions of the original images remain, they can be recognized. Machine learning based synthesis of images can be a new challenge in the future: it can be expected that the visuals of persons can be trained and then merged with a rag-doll model to better fit in the image. In that case we cannot rely on finding a copy of the object in the database. Finding an identical copy of the background in the database with only one object in a limited area differing from the original image can still be a good indicator for a montage.
Acknowledgment
This work was funded by the Federal Ministry of Education and Research within project DORIAN.
References
[1] Pablo F. Alcantarilla and T. Solutions. Fast explicit diffusion for accelerated features in nonlinear scale spaces. IEEE Trans. Patt. Anal. Mach. Intell, 34(7):1281–1298, 2011.
[2] Hunt Allcott and Matthew Gentzkow. Social media and fake news in the 2016 election. Journal of Economic Perspectives, 31(2):211–36, 2017.
[3] Martin Aumüller, Erik Bernhardsson, and Alexander Faithfull. Annbenchmarks: A benchmarking tool for approximate nearest neighbor algorithms. Information Systems, 2019.
[4] Oleksandr Bailo, Francois Rameau, Kyungdon Joo, Jinsun Park, Oleksandr Bogdan, and In So Kweon. Efficient adaptive non-maximal suppression algorithms for homogeneous spatial keypoint distribution. Pattern Recognition Letters, 106:53–60, 2018.
[5] Herbert Bay, Tinne Tuytelaars, and Luc Van Gool. Surf: Speeded up robust features. In European Conference on Computer Vision, pages 404–417. Springer, 2006.
[6] Sevinc Bayram, Husrev Taha Sencar, and Nasir Memon. A survey of copy-move forgery detection techniques. In IEEE Western New York Image Processing Workshop, pages 538–542. Citeseer, 2008.
[7] Erik Bernhardsson. Annoy: Approximate nearest neighbors in c++/python, Dec. 2018.
[8] Gajanan K. Birajdar and Vijay H. Mankar. Digital image forgery detection using passive techniques: A survey. Digital Investigation, 10(3):226–245, 2013.
[9] Matthew Brown, Richard Szeliski, and Simon Winder. Multi-image matching using multi-scale oriented patches. In Computer Vision and Pattern Recognition, 2005. CVPR 2005. IEEE Computer Society Conference on, volume 1, pages 510–517. IEEE, 2005.
[10] Celebrandil. Celebrandil/cudasift, Oct. 2018.
[11] Zhaolin Cheng, Dhanya Devarajan, and Richard J. Radke. Determining vision graphs for distributed camera networks using feature digests. EURASIP Journal on Applied Signal Processing, 2007(1):220–220, 2007.
[12] Steffen Gauglitz, Luca Foschini, Matthew Turk, and Tobias Höllerer. Efficiently selecting spatially distributed keypoints for visual tracking. In Image Processing (ICIP), 2011 18th IEEE International Conference on, pages 1869–1872. IEEE, 2011.
[13] David G. Lowe. Distinctive image features from scale-invariant key-points. International Journal of Computer Vision, 60(2):91–110, 2004.
[14] Weiqi Luo, Jiwu Huang, and Guoping Qiu. Jpeg error analysis and its applications to digital image forensics. IEEE Transactions on Information Forensics and Security, 5(3):480–491, 2010.
[15] Xia-mu Niu and Yu-hua Jiao. An overview of perceptual hashing. Acta Electronica Sinica, 36(7):1405–1411, 2008.
[16] Jinse Shin and Christoph Ruland. A survey of image hashing technique for data authentication in wmsns. In 2013 IEEE 9th International Conference on Wireless and Mobile Computing, Networking and Communications (WiMob), pages 253–258. IEEE, 2013.
[17] Edson C. Tandoc Jr., Zheng Wei Lim, and Richard Ling. Defining “fake news” a typology of scholarly definitions. Digital Journalism, 6(2):137–153, 2018.
Biographies

Martin Steinebach is the manager of the Media Security and IT Forensics division at Fraunhofer SIT. From 2003 to 2007 he was the manager of the Media Security in IT division at Fraunhofer IPSI. He studied computer science at the Technical University of Darmstadt and finished his diploma thesis on copyright protection for digital audio in 1999. In 2003 he received his PhD at the Technical University of Darmstadt for this work on digital audio watermarking. In 2016 he became honorary professor at the TU Darmstadt. He gives lectures on Multimedia Security as well as Civil Security. He is Principle Investigator at ATHENE and represents IT Forensics and AI Security. Before he was Principle Investigator at CASED with the topics Multimedia Security and IT Forensics. In 2012 his work on robust image hashing for detection of child pornography reached the second rank Deutscher IT Sicherheitspreis, an award funded by Host Görtz.

Karol Gotkowski received his B.S degree in computer science from Technical University Darmstadt, Germany, in 2019 and is pursuing his M.S degree in visual computing. He is currently a student assistant at Fraunhofer Institute for Secure Information Technology (SIT). His major research interests include splicing detection, visual question answering and neural network interpretability.

Huajian Liu received his B.S. and M.S. degrees in electronic engineering from Dalian University of Technology, China, in 1999 and 2002, respectively, and his Ph.D. degree in computer science from Technical University Darmstadt, Germany, in 2008. He is currently a senior research scientist at Fraunhofer Institute for Secure Information Technology (SIT). His major research interests include information security, digital watermarking, robust hashing and digital forensics.
Journal of Cyber Security and Mobility, Vol. 9_2, 175–202.
doi: 10.13052/jcsm2245-1439.921
This is an Open Access publication. © 2020 the Author(s). All rights reserved.