Reaction of Stock Volatility to Data Breach: An Event Study
Samuel Tweneboah-Koduah1,3,*, Francis Atsu2 and Ramjee Prasad3
1Dept. of Computer Science, School of Technology, GIMPA, Accra, Ghana
2Dept. of Accounting and Finance, GIMPA, Accra, Ghana
3CTIF Global Capsule, Dept. of Business Development and Technology, Aarhus University, Herning, Denmark
Email: stkoduah@gimpa.edu.gh
* Corresponding Author
Received 14 December 2019; Accepted 11 April 2020; Publication 26 June 2020
Abstract
The paper assesses how stock market volatility reacts to data breach disclosure.The paper applies Volatility Event Analysis and Kolmogorov-Smirnov Testto analyse how equity risk (stock volatility) of 96 firms listed on the S&P1 500 index reacted to the disclosure of a data breach using records from Breach Level Index) of empirical analyses were performed. The study employs statistical tests that adjust for the effects of cross-section firm-specific mean and volatility.The analysis delivers the following results: Firstly, cross-sectional analysis shows that there is evidence of significant abnormal across the firms and significant difference between the ‘pre’ and the ‘post’breach disclosures. Secondly, the industry level analysis reveals that the firms in the financial sector exhibit more abnormal volatility and returns than firms in other sectors.Andwhile there are significant differences between the ‘pre’ and ‘post’-disclosures,the effect tends to be more pronounced with the post-disclosure.Implying that data breach disclosures can significantly influence equity volatility.
Keywords: Cybersecurity, stock volatility, data breach, time-varying volatility, event study methodology.
1 Introduction
Stakeholders in the 21st-century business environment, characterised by fierce competition as well as complexities in the business environment, consider information and communication technology as an indispensable platform for creating wealth, enhancing and preserving value in a sustained manner [1, 2]. Notwithstanding, cybersecurity events, (e.g data breach [3]) have become the new tenets of many technology challenges confronting business managers in the digital ecosystem. Extant studies have shown that investment returns and equity investors react to the events of cyberattacks [4, 5]. However, the extent to which data breach event, in particular, influences stock volatility has not been well explored. In the stock market, equity investors are not only interested in stock returns but are more concerned with the trade-off between stock returns and volatility [6] as this is very informative in constructing optimal portfolios [7, 8]. For this reason, any event that seems to influence stock volatility is worth exploring. The primary objective of the paper is to investigate how stock market volatility reacts to data breach disclosure. The paper employs the methodology proposed by Balaban and Constantinous [9] and Schimmer et al. [10] to compute both pre-disclosure and post-disclosure stock volatility reactions. In addition, the authors apply the Kolmogorov-Smirnov Test [11] to test the significant difference between pre-cyberattacks and post-cyberattacks estimates. The aim is to estimate which of the two event windows exhibit high volatilities.
The paper uses a breached disclosure data (of 96 firms listed on S&P 500) as captured in Breach Level Index (BLI2) [12] for the period between January 2013 and December 2018. Based on that, the paper analyses firms’ reactions to the breached disclosure. The empirical analysis was performed for both cross-sections and sector-by-sector.3 The analysis delivers four main results. Firstly, there is evidence of abnormal volatility on the event day across all the firms. Secondly, from the test, the paper confirms that the cross-section volatilities of the pre and post cyberattacks periods are significantly different, however, the latter is characterised by higher volatilities than the former. Thirdly, financial and technology firms tend to exhibit higher abnormal volatility as compared to firms from other sectors. Fourthly, while there are significant differences between the ‘pre’ and ‘post’-disclosures, the effect tends to be more pronounced with the post-disclosure.
The paper contributes to the literature in the following ways. First, to the best of our knowledge, this is the first paper to have explicitly presented industry-level stock volatility reactions to data breach disclosure while accounting for cross-section dependence in the returns and firm-specific volatilities. Secondly, the paper’s estimation of the time-varying standard deviation dynamics in a cross-section fashion, where all aggregate risk reactions of all stocks to cyberattacks are captured is novel. The results highlight how cybersecurity events (e.g. data breach disclosure) influences stock volatility, and importantly, how such knowledge is useful in reshuffling or updating the volatilities of individual firms and equity portfolios. The rest of the paper is organized as follows: Section 2 looks at the state of the art of the subject matter. Section 3 presents the study methodology. The empirical analysis and the results are presented in Section 4. Section 5 concludes the paper.
2 State of the Art
The technology revolution in business and corporate environment is gradually changing the face of doing business and how individuals interact with public institutions. Thus, the traditional activities of customers, businesses, and corporations are gradually shifting to the digital ecosystem. The concerns, which come to mind are if the ecosystem is safe and how to guarantee the privacy and security of data resources in the environment. To the investor, the concern is how to protect ‘his investment’ from cyber adversaries. Data breach in the form of intentional modification, data theft, espionage, and unauthorised disclosure is a major concern for operators in the digital ecosystem. And in the digital ecosystem, data is the currency and the most significant transactional commodity. Data has, therefore, become a target of major attacks in recent times. Khan et al, claim that despite the global increase in data breach incidents, very little is known about how individuals and organizations effectively identify and manage the data breach [13]. While breach incident poses a severe threat to business survival, the method, as well as the impact of a data breach disclosure, has not been well researched.
Data breach disclosure is traceable to the Notifiable Data Breach (NDB) scheme under the Australian Privacy Act 1998 [14]. The legislation (part of Australia’s financial reforms) entreats all affected institutions to make a public admission of any records breached. This legislative requirement often overshadows the threat of financial and reputational impacts on the affected organisations. In a related study, Hopkins and Darren argue that there is a human element of a data breach and that legislations tend to forget what it means to be an individual impacted by a data breach [15]. According to the authors, apart from the financial hardships and lost opportunity in terms of time, the affected individual often suffers a potential psychological impact from such an event [15]. According to Chen et al, recent data breach reports have generated concerns that insiders in the stock market might be using non-public information in their trading [16] for their own advantage. Using data breach notification laws at the state level, the authors examine whether mandatory breach disclosure affects insider selling behaviour. Their study concludes that insiders’ selling profit, is always larger and selling speed is also faster after data breach disclosure laws became effective.
2.1 Data breach
In recent times, hardly a day passes without news on either stolen corporate data (or personally identifiable information) and a breach of related records. This paper defines a data breach as an act in which an individual’s personally identifiable information or a corporate entity’s classified records or information is stolen or fraudulently accessed and disclosed. Identity Theft Resource Center defines a data breach as an event in which an individual’s name plus SSN, driver’s license number, medical record, or a financial record/credit/debit card is potentially put at risk, either in electronic or paper format in [3]. According to Trend Micro, a data breach occurs “when there is an unauthorized entry point into a corporate database that allows cyber hackers to access customer data such as passwords, credit card numbers, Social Security numbers, banking information, driver’s license numbers, medical records, and other sensitive information4”. Depending on the motive of the attack, multiple factors contribute to a data breach. Acquisti et al. also claims a data breach may be caused by the loss of equipment, unintentional leaks of personal information, “intentional but illegal sale” of customer data, or outright theft of data [17].
The analysis of over 1000 data breach entries from BLI (between 2013 and 2018) [12] revealed five (5) major data breach types (Figure 1). These are identity theft [3, 18], account access [19, 20], financial access [21, 22], existential data [23, 24], and nuisance [25, 26]. Per the results, identity theft is the most recognized breach type (accounting for 61%). Identity theft is defined as a stolen or the misuse of an individual’s personally identifiable information. Account access is the misuse of access privileges by a legitimate user within a specific time period. Financial access is an abuse of permission granted to someone to access financial resource [21], to enable the individual to perform his legitimate duty. In a developmental economics, financial assess is recognized as a significant aspect of economic independent. An existential data breach is caused by what is known as knowledge based authentication where, an attacker uses existing legitimate piece of information or data item to perpetuate an attack. According to BLI, a nuisance occurs when the “compromised data includes basic information such as name, address and/or phone number” [12]. Accordingly, BLI source claimes, the number of records breached in nuisance type attacks has increased by 560% since 2016 [12]. A report from BLI further states that the larger ramification of nuisance attack is often unknown, as attackers use this type of data to orchestrate other attacks [12].
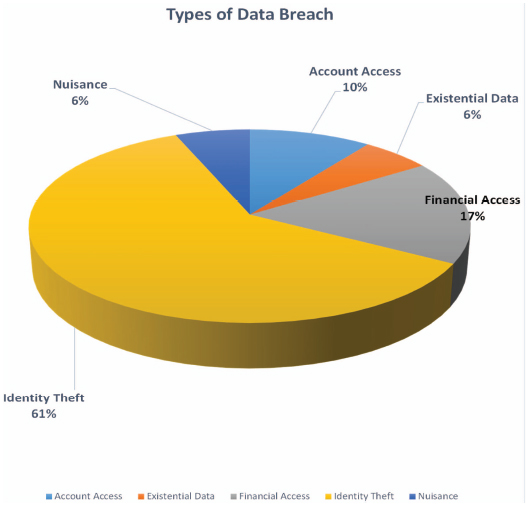
Figure 1 Types of a data breach.
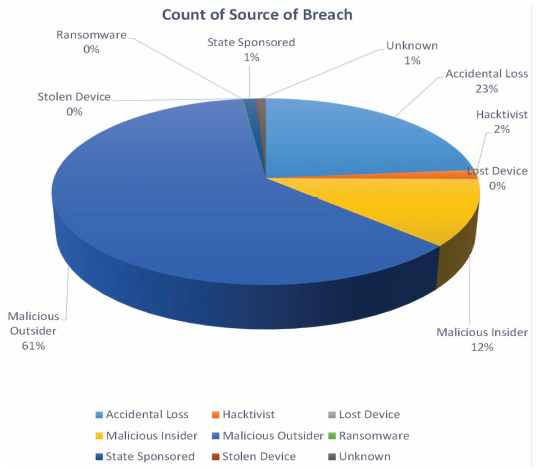
Figure 2 Sources of a data breach.
Furthermore, the paper identifies five major data breach sources (Figure 2). These are accidental loss, hacktivist [27], stolen device, malicious insider [28, 29] as well as malicious outsider [30, 31]. Malicious outsider is the most counted source (representing 61%). A malicious outsider is anyone outside a permissible perimeter with an intention (of gaining access) to cause harm or damage to information assets. A malicious insider is someone (who has privilege access) within an organization with a bad intention to cause harm or damage to an information resource. An accidental loss is an unintentional loss or destruction to a data item by accident.
In the United States alone, a data breach is estimated to have cost over 8.19 billion in 2019 [32]. Either stolen or breached, a data breach has a very detrimental effect on the affected entity (especially for corporate and public institutions). The cases of Sony (USA) and Halifax (Scotland) data breaches in 2011 and 2015 respectively. While data breach is estimated to cost affected companies billions of dollars in direct costs and legal damages, the disclosure (or notification) of such events has equally resulted in inconsequential damages to the affected firms or individuals. For example, a study by Jennifer Veltsos chronicles the intersection of business communication and information security in the form of breach notification messages [33].
Despite the detrimental effects of breach disclosure on firms’ value and image, in the United States of America, a patchwork of State and Federal laws require organizations to notify users when personally identifiable information has been leaked or when the organization’s data security measures have been breached [33]. Corporate communication is a broad category that includes media relations, investor relations, and issues involving corporate reputation [34]. In a related study, Jennifer Veltsos argues that organizations that have experienced data breaches are already facing one blow to their reputations [33]. Subsequently, Veltsos claims, data breach notifications are clearly a form of negative news messages, a common genre in business communication textbooks [33]. Added to this, the author asserts that negative news messages are usually included in sections about correspondence or routine messages, yet data breaches are anything but routine. Arguably, data breaches can be a public relations nightmare that threatens a company’s reputation and credibility with existing and potential customers. Similarly, Synovate posits that only 44% of the people who received breach notification messages actually took action [35]. In a related study, Romanosky et al. suggest that breach notifications must overcome two significant challenges: optimism bias (“It can’t happen to me”) and rational ignorance (“It’s not worth the time and trouble”). Consequently, the authors further argue, data breach notification messages must clearly explain what consumers should do, emphasizing both the risks of failing to follow through and the benefits of doing so. Additionally, it is also argued that breach notification laws should encourage or even embarrass companies into improving their cybersecurity policies and controls. This accession is often called “sunlight as disinfectant” [36].
Whether informational or instructional (as legal requirements), data breach disclosure has consequential effects. For corporate and governmental agencies, such an event could be damaging in terms of image, legality, and finances. In this study, it is claimed, data breach disclosure destabilizes the volatility of the stock market, which might also influence investors’ confidence and reactions. Many other extant studies have strongly linked economic and financial factors as the primary determinants of stock market volatility, the influence of technological events such as data breach on stock market dynamics, in recent times, have necessitated the review of long-held views on stock market behaviour in relation to technology trends. For instance, Schwert argues that one of the primary factors, which explains the unusual market volatility in the stock market is neither the firm size nor the immaturity of the firm, but technology [37]. In this paper, it is argued, there is a direct influence of technology adoption on stock market behaviour, being its information gathering, processing and or disclosure. Subsequently, how these activities are managed, directly or indirectly influence the behaviour of both the firm and an investor. A classic example is the disclosure of Data breach [35]. It is contended that data breach events can erode investor’s confidence and destabilise the market. This accession is corroborated by other studies, which have shown that data breach has a direct impact on stock performance [5], shareholders’ worth [38] and market prices [39].
2.2 Stock volatility
Stock volatility is a basic building block used to measure stock market efficiency, asset allocation, and other related market dynamics. According to Torben et al, stock market volatility is central to the theory and practice of asset pricing, allocation, and operational risk management [40]. In a related study, Bushee and Noe argue that high stock volatility is potentially undesirable for both investors and firms [41]. It has also been claimed that risk-averse investors typically, require a higher premium to hold high-volatility stocks [42]. Furthermore, it is argued, the accuracy in measuring and forecasting stock volatility is significant to asset and derivative pricing, asset allocation and risk management [43]. Accordingly, Baiman and Verrecchia posit that high stock volatility can make stock-based compensation more costly [44] thereby increasing the possibility of lawsuits [45]. The paper further claimed that variations in collective stock volatility are consequential to the general wellbeing of an economy. Furthermore, understanding how market volatility responds to changes in economic conditions is significant in computing optimal portfolios, Value-at-Risk (VaR) and stress-testing [42]. Moreover, Nonejad argues that “exploring the connection between macro-economic variables and stock market volatility remains a very important topic in financial econometrics” [46]. Subsequently, a study found in [47] corroborates this accession. Then, using the no-arbitrage model, Coradi et al. explain that fluctuations in stock volatility have directly influenced business cycles [47. The authors further claim some unobserved factors contribute to the near 20% of the uncertainties in the stock market variations [47].
Over the years, researchers have tried to measure the effects of an economic event on the value of firms [48]. In recent years, however, the advancement of information and related technologies, as well as digitization of business processes, have greatly impacted how firms operate in the digital global business environment. This digital transformation is significantly influencing how global businesses operate in many digital economies. While experts believe the global digital transformation is significantly influencing business processes, the accompanying cybersecurity risks, however, are becoming more concerning among stakeholders. It is argued, the measurement of the effects of technology events such as data breach on firms’ value is without a doubt, long overdue. Statistics from Breach Level Index (BLI) [12], reveals a rising trend of the event, globally since January 2013. Between 2013 and 2018, records from BLI database shows over 6000 cases of data breaches against both private and public institutions across the globe [5], involving over fourteen billion individual records. Figure 3 is a sector-by-sector data breach for the period under discussion. Per the analysis, health and government sectors remain the two topmost targets.
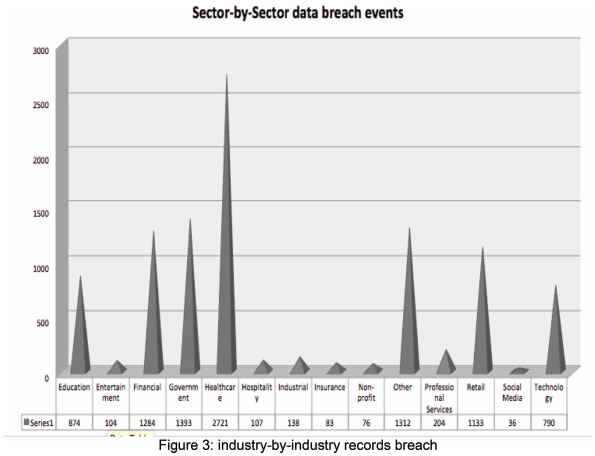
Figure 3 Industry-by-industry records breach.
Extant studies available have also explored the relationship between cyberattack and stock values. For instance, a study by Tweneboah-Koduah et al. have shown a statistically significant correlation between the disclosure of data breach and firms’ values [5]. In a related study, Ko and Dorantes investigated the impact of security breaches on firm performance [4]. Their study concludes that while sales of the breached firms’ as well as the operating income did not decrease in the subsequent quarters following the data breach, return on assets, however, decreased in the third quarter. Similarly, a study by Acquisti et al. show that there is a statistically significant impact of data breaches on a market value of a breached firm on the breach disclosure day [17]. The results of that study show a cumulative increase in magnitudes over the day following the breach disclosure, but then decreases and loses statistical significance over time [17]. The following studies further corroborate the accession that there is a positive correlation between the disclosure of a data breach and a firm’s performance [34–36, 49, 50].
3 Methodology
This paper presents a quantitative impact assessment using the Event Study Method (ESM). A cross-sectional test is used to compute both Abnormal and Cumulative Abnormal Returns (AR/CAR). Similarly, the Kolmogorov-Smirnov Test is applied to compute the equity risks.
3.1 Dataset
As indicated earlier, the paper uses records of a data breach (for the period between January 2013 and December 2018) from BLI [12]. BLI is an integrated global database of data breaches, which applies multiple deterministic factors (such as industry type, records breached, date of breached, type of breach, source of a breach, and location) to compute risk scores as a severity level of breach. Subsequently, information on breach disclosures of 96 firms listed on S&P 5005 between January 2013, and December 2018, were reviewed for the purpose of the analysis. The criteria for data selection is based on the number of records breached and the subsequent effects on the firms’ returns as captured in [5]. Additionally, 96 firms were selected based on their risk scores (i.e. a risk rate of >= 5.0 on the scale of 1.0 to 10.0). The reason for the choice of the location (USA) of the selected firms is that nearly 76% of the breached events in the period of study are based in the USA (Figure 4). Table 1 contains the descriptive statistics of records breached to the key datasets. The ‘Others’ portion of Figure 4 represents all other countries, in which their attack entry in the BLI database was less than 100.
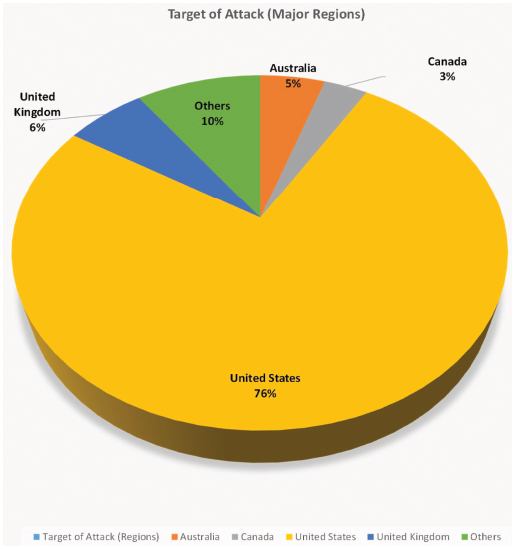
Figure 4 Regional location most targeted.
Table 1 Summary statistics of records breached
| Data Set | Minimum | 1st Quartile | Median | Mean | 3rd Quartile | Maximum |
| Identity Theft | 5.600e+02 | 2.245e+03 | 1.000e+04 | 200e+06 | 5.545e+04 | 2.200e+09 |
| Malicious Outsider | 5.600e+02 | 2.430e+03 | 1.300e+04 | 4.673e+06 | 8.294e+04 | 2.200e+09 |
| Healthcare | 560 | 1605 | 5942 | 290463 | 21910 | 78800000 |
| Technology | 6.520e+02 | 2.675e+04 | 2.169e+05 | 1.592e+07 | 2.000e+06 | 1.200e+09 |
| USA | 5.600e+02 | 2.400e+03 | 1.100e+04 | 5.531e+06 | 6.600e+04 | 2.200e+09 |
3.2 Event study method
Event study methodology (ESM, hereafter) has been extensively employed to explore the effects of events on stock market dynamics. For instance, stock markets reactions to privatisation [51], CEO succession [52], mergers and acquisitions [53, pp. 1994–2001], cyberattacks or data breaches disclosures [1, 5, 54] among others. The classical ESM assumes that stock markets are informationally efficient. Thus, all publicly available information is reflected in the prices of the listed equities. Hence, prices of equities react to events and can be estimated as the abnormal return (AR) and cumulative abnormal return (CAR). AR is defined by
| (1) |
where ARit, Rit, and Rmt are the abnormal return, return on equity i, market return on day t with the corresponding parameters and of the market model. For each event window, the parameters in equation (1) are estimated using a market index and an estimation window of daily returns of each stock as shown in Figure 5 below:
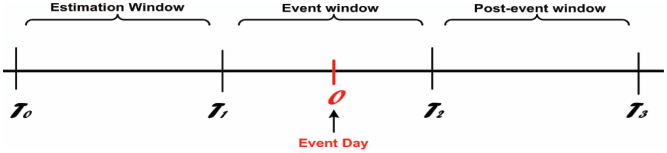
Figure 5 Event-study methodology window.
For instance, to estimate the parameters of equation (1) for the event window [−5, +5] (5 days before the disclosure and 5 after the disclosure), an estimation window from day 2566 to day 260 before the cyberattack disclosure is usually used in order not to contaminate the parameters. CAR is cumulative of price reactions over the event window and computed as follows:
| (2) |
where CART1,T2 is the cumulative price reaction to an event over the event window, from day T1 to day T2, and ARt as defined above.
The price reaction measures AR and CAR, which are tested to ascertain their statistical significance. The drawback of these measures is that they assume constant standard deviation over the estimation and event windows. Here, we depart from the classical event study briefly explained above, by allowing for variations in the standard deviation over the windows as presented in Section 3.3.
3.3 The market model
As part of the analysis, we identified the high-level profile cyberattacks from the database [35]. Following [9, 10], we apply the market model [1] with GARCH (1,1) [58] in the context of event study as follows:
| (3) |
| (4) |
where Dit is a dummy variable which takes 1 on the disclosure day t and 0 otherwise for firm i; and εit are the volatility and the errors of firm i. Further, Rit and Rmt are the return of firm i and the market (m) on day t, respectively. Equations (3) and (4) represent the mean and time-varying volatility functions respectively. The abnormal returns and abnormal volatility caused by the disclosures of cyberattacks or data breaches are measured by γ and δi for firm i.
The diagnostic tests (i.e. GARCH-adjusted market model) employ time-varying standard deviation, while those of the standard market model assumes a constant standard deviation. For instance, as the employed model can be used to investigate the abnormal variations in the returns and the standard deviation, the standard market model can only test for abnormal changes in return but not in the standard deviation since it assumes that the cyberattacks do not affect the standard deviation of returns. This assumption may be misleading since the reactions of market participants to data breach tend to change returns [5] which intend to influence the trade-off between returns and risk (standard deviation) [9]. The parameters in equations (3) and (4) are estimated using daily returns for the 250-day period before and after data breach disclosures (i.e. t − 250 ..., 0, ..., t + 250) for firms i = 1, ..., 96. Following Armitage [61] and Krivin et al. [62] who argued that the estimation window may likely influence parameter estimates, the authors explore these effects by re-estimating the parameters for various estimation windows (e.g. 251, 255, 260).
3.3.1 Test of significance measures
The paper uses the following statistical tests to evaluate the significance of the cyberattacks on abnormal returns and abnormal volatility as follows. Specifically, we adopt the cross-sectional test statistics by [59] for testing for abnormal returns and abnormal volatility respectively given below:
| (5) |
| (6) |
Equations (5) and (6) assume the variations in the standard deviation are the same for all the 96 firms [9,59], which may not be useful to readers interested in the changes of the individual standard deviations of the firms. Against this background, the authors employ the test by Savickas [60] to control for firm-specific volatility in equation (5), where is scaled by the estimated volatility for firm i on the disclosure day of the cyberattacks in the paper as:
| (7) |
where .
Similarly, in the spirit of [9], we adjust for specific volatility in equation (6) to obtain the corrected t-statistic given below
| (8) |
where represents the adjustment of by the estimated volatility of firm i on the day of the disclosure.
In the setting of [10], the paper tests for pre-event volatility and post-event volatility as follows. First, we estimate the conditional volatility for firm i (σi) and S&P 500 index (σm) for both the pre-event estimation window [−L, 0] and the post-event estimation window [0, L] (see Figure 6).
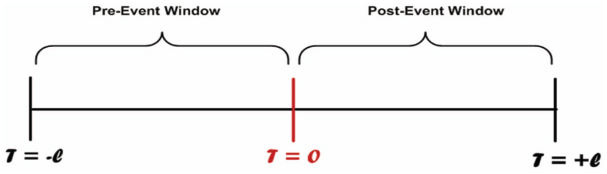
Figure 6 Pre/post event volatility windows.
The pre-event volatility and post-event volatility ratios are respectively computed for i as and as shown in Figure 2 above. We employ the Kolmogorov-Smirnov test to examine (i) if there is a significant change between the pre-event volatility and post-event volatility across firms, and (ii) which of the periods is statistically more volatile. Specifically, we first test the following hypothesis:
H1: There is no significant change between pre-event and post-event volatilities.
Secondly, if we fail to accept the null of H1, evidence of significant change in volatility after cyberattacks, we proceed to investigate which period is more significantly volatile given by the hypothesis below:
H2: The pre-event period is significantly more volatile than the post-event period.
4 Results and Discussion
The parameters of equations (3) and (4) are estimated and the test statistics are computed in two ways. First, a cross-section estimation is computed by using all the 96 firms as the sample (aggregate analysis). Second, sector-level estimation is performed, where cross-section estimations are done for each sector (i.e. Industrial, Health, Financial, Information Technology, and Retail). And following Armitage [61] and Krivin et al. [62], the paper investigates the effect of estimation window length by using various estimation window lengths. The authors then present the diagnostic tests in Table 1, while the estimated parameters of equations (3) and (4) of each firm are presented in Table A1 in the appendix. In Table 2, the aggregate analysis results are presented in Panel A, while those of industry-level analysis are presented in Panel B. The aggregate analysis (see estimation windows: 251, 255, and 260) shows that there is evidence of statistically significant abnormal volatility on the event day across the selected firms listed on S&P500. Furthermore, per the paper’s setting, there is no evidence of significant abnormal returns across the firms. For the industry-level analysis, the Financial sector exhibits more abnormal volatility, followed by the Information Technology sector, Health sector, Industrial sector, and Retail sector, in that order. The results imply the following. Firstly, the aggregate analysis of how cyberattacks influence stock volatility may offer an overview of firms’ reactions to cybersecurity events (i.e. data breach), but this may not be useful to readers interested in the dynamics at the industry level. Secondly, the effects of cyberattacks, specifically data breach on the volatility of firms in the financial sector are more severe than firms in other sectors. Thirdly, the results show that the estimation window can influence the outcome of the analysis. As such, restricting the analysis to a single-window may not be useful.
Table 2 Abnormal volatility and abnormal return diagnostic tests
| Estimation Window Length |
||||||
| 250 | 251 | 255 | 260 | 270 | 280 | |
| Panel A: Aggregate Level Analysis | ||||||
| −0.285 | −0.601 | −0.589 | −0.407 | 0.6881 | −0.421 | |
| 1.357 | 2.188** | 2.660*** | 1.938** | 1.518 | 1.768* | |
| −0.432 | −0.807 | −0.640 | −0.469 | 0.779 | −0.397 | |
| 1.356 | 2.186** | 2.400*** | 1.936** | 1.517 | 1.766* | |
| Panel B: Industry (Sector) Level Analysis | ||||||
| Industrial | ||||||
| −0.722 | −0.677 | −0.659 | −0.732 | −0.762 | −0.764 | |
| 1.696* | 1.001 | 1.001 | 1.001 | 1.001 | 2.411*** | |
| −0.779 | −0.729 | −0.745 | −0.723 | −0.727 | −0.729 | |
| 2.230** | 1.000 | 1.000 | 1.000 | 1.000 | 2.409*** | |
| Health | ||||||
| −0.430 | −0.701 | −0.730 | −0.383 | −0.729 | −0.444 | |
| 1.001 | 1.447 | 1.785* | 1.949** | 2.161** | 1.561 | |
| −0.217 | −0.432 | −0.333 | −0.099 | −0.493 | −0.203 | |
| 1.000 | 1.421 | 1.836* | 1.947** | 2.030** | 1.560 | |
| Financial | ||||||
| −1.618 | −1.922* | −1.944* | −1.914* | 0.806 | −1.990** | |
| 7.161*** | 7.638*** | 1.002 | 1.001 | 1.002 | 1.316 | |
| −1.779* | −2.074** | −2.116** | −2.060** | 0.806 | −2.030** | |
| 7.233*** | 7.715*** | 1.001 | 1.000 | 1.001 | 1.170 | |
| Infor. Technology | ||||||
| 0.872 | 0.795 | 0.798 | 0.872 | 0.839 | 0.853 | |
| 3.339*** | 2.883*** | 1.000 | 0.000 | 1.171 | 1.150 | |
| 4.544*** | 4.203*** | 1.000 | 1.299 | 1.119 | 1.079 | |
| 0.834 | 0.657 | 0.798 | 0.862 | 0.796 | 0.816 | |
| Retail | ||||||
| 0.074 | 0.041 | 0.032 | −0.012 | 0.079 | 0.058 | |
| 1.002 | 1.364 | 1.796* | 1.257 | 1.578 | 0.000 | |
| −0.013 | −0.124 | −0.087 | −0.052 | 0.130 | 0.085 | |
| 1.001 | 1.460 | 1.886* | 1.224 | 1.318 | 1.431 | |
| Notes: ***/**/* significant at 1%, 5% and 10 %, respectively. The terms , , , and are abnormal return t, abnormal volatility t, cross-section volatility corrected abnormal return t, cross-section volatility corrected abnormal volatility t-tests, respectively. Given the focus of the paper, firm volatility dynamics, we concentrate more on and . | ||||||
The study fails to accept the null hypothesis H1 for aggregate level analysis. In addition, the null is also rejected for only firms in the financial sector. Subsequently, the authors perform the second hypothesis (H2) for only a cross-section of the firms (the aggregate level) and the financial sector. The statistics show that the null is rejected for both cases. This shows that volatility across the selected firms tends to be high after the cyberattacks or data breach disclosures. The results have the following implications. Firstly, for the cross-section, there is significant evidence to prove that cyberattacks or data breach disclosures affect stock volatility but this effect tends to be more pronounced after the disclosures. Secondly, at the sector level, there is a significant difference in volatilities of financial sector firms before and after the data breach disclosure, but the volatilities are more pronounced after the disclosure. However, there is no much difference between the volatilities of firms before and after the disclosures in following the sectors: Industrial, Health, Information Technology, and Retail. These implications are very informative to equity investors in the following ways: Firstly, the appropriate estimation of changes in volatilities of equities after the disclosures of data breaches is useful in updating the trade-off between risk and returns when investors are rebalancing their portfolios. Secondly, the financial sector firms exhibit different behaviour, which may arise from tighter regulatory requirements, because of possible crucial intermediation role by regulators within financial markets, as compared to the other sectors. For instance, the information disclosure requirement of the financial sector enhances the flow of information to the market participants used in updating their expectations about current and future market movements.
5 Conclusion
The paper has explored empirically, the effect of the public disclosure of high profile data breach on stock volatility. The study applies the event-volatility approach [9] to explore the evidence of abnormal volatility due to the disclosure of a data breach. Furthermore, the study applies the Kolmogorov-Smirnov Test to assess how pre-event volatilities differ from post-event volatilities and to establish which of the period (i.e. pre- or post-event) is characterised with high volatilities. The empirical analysis is conducted in two ways: [aggregate level (cross-section) and industry (sector) level]. For the aggregate level analysis, the paper applies the above method to a cross-section of all firms; while for the industry-level analysis, the method is applied in the following sectors; Industrial, Health, Financial, Information Technology, and Retail. The analysis reveals four possible outcomes. Firstly, cross-sectional analysis shows that there is significant evidence of abnormal volatility across the selected firms on the S&P 500 on the event day (day zero). However, the result reveals no evidence of abnormal returns across the firms. Secondly, there is a significant cross-sectional difference between pre- and post-breach disclosure, however, the effect tends to be more pronounced across firms after the disclosure. Thirdly, the industry level analysis implies that the firms in the financial industry exhibit more abnormal volatility and abnormal return than firms in other sectors. Fourthly, there are significant differences between the pre and post-disclosure volatilities for the financial sector firms. Besides, the post-disclosure period does exhibit higher volatilities than the pre-disclosure period. The case is quite different from firms in the other sectors. In this case, the result shows no significant difference between the pre and post-disclosure volatilities.
The test statistics for evaluating the pre-cyberattacks and post-cyberattacks event volatilities significance are presented in Table 3.
Table 3 Pre-cyberattacks and post-cyberattacks diagnostic tests
| Aggregate level | Industrial | Health | Financial | Infor. Tech | Retail | |
| Hypothesis | D-Stat. | D-Stat. | D-Stat. | D-Stat. | D-Stat. | D-Stat. |
| H1 | 0.313*** | 0.500 | 0.429 | 0.435** | 0.300 | 0.310 |
| H2 | −0.313*** | −0.435** | ||||
| Note: ***/**/* significant at 1%, 5% and 10%, respectively. D-Stat is the Kolmogorov Smirnov difference test statistic. We perform hypothesis 2 (H2) for the cross-section of firms and financial sector firms because we reject the null (no difference) of hypothesis 1 (H1) in only the two cases. | ||||||
Appendices
Table A1
| Industrial | Alpha | Beta | Gamma | Delta | σi,0 | |
| Ticker Symbol | Equity Name | |||||
| BA | Boeing Company | −0.0011 | 1.2107 | 0.0058 | 0.0000 | 0.0086 |
| CTAS | Cintas Corporation | 0.0006 | 0.9138 | 0.0030 | 0.0000 | 0.0064 |
| DAL | Delta Air Lines | 0.0014 | 1.6878 | 0.0126 | 0.0000 | 0.0190 |
| EFX | Equifax Inc. | −0.0001 | 1.0273 | 0.0029 | 0.0000 | 0.0076 |
| GWW | Grainger (W.W.) Inc. | −0.0007 | 0.7729 | −0.0160 | 0.0000 | 0.0157 |
| LMT | Lockheed Martin Corp. | 0.0009 | 0.8879 | −0.0204 | 0.0000 | 0.0087 |
| NOC | Northrop Grumman Corp. | 0.0005 | 0.8485 | −0.0030 | 0.0000 | 0.0077 |
| RSG | Republic Services Inc | 0.0010 | 0.7811 | −0.0305 | 0.0000 | 0.0066 |
| UPS | United Parcel Service | 0.0000 | 0.7325 | 0.0161 | 0.0000 | 0.0079 |
| UTX | United Technologies | 0.0003 | 0.9366 | −0.0044 | 0.0000 | 0.0070 |
| Health | Firm | |||||
| Ticker Symbol | Equity Name | |||||
| AET | Aetna | 0.0003 | 1.0177 | −0.0040 | 0.0004 | 0.0218 |
| ANTM | Anthem Inc | 0.0011 | 0.9535 | −0.0052 | 0.0000 | 0.0113 |
| BAX | Baxter International Inc. | 0.0011 | 0.7841 | −0.0031 | 0.0000 | 0.0103 |
| CNC | Centene Corporation | 0.0011 | 1.1241 | −0.0526 | 0.0000 | 0.0217 |
| CI | CIGNA Corp. | 0.0006 | 1.0482 | 0.0166 | 0.0000 | 0.0093 |
| CVS | CVS Health | 0.0009 | 0.8051 | −0.0061 | 0.0000 | 0.0062 |
| DVA | DaVita Inc. | 0.0011 | 0.6924 | 0.0200 | 0.0000 | 0.0131 |
| HUM | Humana Inc. | −0.0002 | 0.7062 | −0.0028 | 0.0000 | 0.0099 |
| MCK | McKesson Corp. | 0.0004 | 0.5239 | −0.0026 | 0.0000 | 0.0072 |
| MDT | Medtronic plc | 0.0003 | 1.0105 | 0.0029 | 0.0000 | 0.0073 |
| PDCO | Patterson Companies | 0.0000 | 0.8742 | −0.0005 | 0.0000 | 0.0095 |
| PKI | PerkinElmer | −0.0004 | 1.2563 | −0.0029 | 0.0000 | 0.0096 |
| DGX | Quest Diagnostics | 0.0008 | 0.8907 | 0.0030 | 0.0000 | 0.0119 |
| TMO | Thermo Fisher Scientific | 0.0006 | 1.1479 | 0.0104 | 0.0000 | 0.0073 |
| Financial | Firm | |||||
| Ticker Symbol | Equity Name | |||||
| AFL | AFLAC Inc | −0.0001 | 0.8214 | −0.0021 | 0.0000 | 0.0056 |
| AXP | American Express Co | 0.0004 | 1.1708 | −0.0091 | 0.0000 | 0.0076 |
| AMP | Ameriprise Financial | 0.0000 | 0.0000 | 0.0000 | 0.0000 | 0.0000 |
| AON | Aon Inc | −0.0005 | 0.9037 | 0.0092 | 0.0000 | 0.0074 |
| BAC | Bank of America Corp | −0.0002 | 1.1528 | 0.0029 | 0.0000 | 0.0106 |
| BBT | BB&T Corporation | 0.0001 | 0.9845 | −0.0137 | 0.0000 | 0.0081 |
| COF | Capital One Financial | −0.0007 | 1.4441 | 0.0044 | 0.0000 | 0.0123 |
| SCHW | Charles Schwab corp. | 0.0004 | 1.2910 | −0.0085 | 0.0000 | 0.0116 |
| CFG | Citizens Financial Group | 0.0001 | 1.6498 | 0.0110 | 0.0000 | 0.0126 |
| CME | CME Group Inc. | 0.0002 | 0.8104 | −0.0009 | 0.0000 | 0.0096 |
| DFS | Discover Financial Serv. | −0.0003 | 1.0352 | 0.0015 | 0.0000 | 0.0103 |
| FITB | Fifth Third Bancorp | 0.0004 | 1.0759 | 0.0013 | 0.0000 | 0.0079 |
| GS | Goldman Sachs Group | −0.0003 | 1.1808 | −0.0057 | 0.0000 | 0.0072 |
| JPM | JPMorgan Chase & Co. | −0.0002 | 1.1668 | −0.0023 | 0.0000 | 0.0075 |
| MTB | M&T Bank Corp. | 0.0000 | 0.7817 | −0.0003 | 0.0000 | 0.0068 |
| MMC | Marsh & McLennan | 0.0003 | 0.9052 | −0.0080 | 0.0000 | 0.0047 |
| MS | Morgan Stanley | 0.0003 | 1.3207 | −0.0094 | 0.0000 | 0.0089 |
| NTRS | Northern Trust Corp. | -0.0005 | 1.0730 | −0.0030 | 0.0000 | 0.0079 |
| Technology | Firm | Alpha | Beta | Gamma | Delta | H_i |
| Ticker Symbol | Equity Name | |||||
| PNC | PNC Financial Serv. | −0.0002 | 1.1087 | −0.0067 | 0.0000 | 0.0068 |
| PFG | Principal Financial Grp. | 0.0009 | 1.5302 | 0.0063 | 0.0000 | 0.0081 |
| STT | State Street Corp. | −0.0014 | 1.5229 | 0.0001 | 0.0000 | 0.0126 |
| STI | SunTrust Banks | 0.0009 | 1.6955 | −0.0082 | 0.0000 | 0.0118 |
| WFC | Wells Fargo | −0.0009 | 1.2503 | −0.0068 | 0.0000 | 0.0114 |
| ADBE | Adobe Systems | 0.0013 | 1.2016 | −0.0028 | 0.0000 | 0.0150 |
| AAPL | Apple Inc. | 0.0021 | 0.8663 | 0.0203 | 0.0000 | 0.0138 |
| AMAT | Applied Materials Inc | −0.0006 | 1.1443 | −0.0017 | 0.0000 | 0.0140 |
| CSCO | Cisco Systems | 0.0005 | 1.0953 | 0.0016 | 0.0000 | 0.0061 |
| CTXS | Citrix Systems | −0.0003 | 1.3988 | 0.0195 | 0.0000 | 0.0083 |
| EA | Electronic Arts | 0.0029 | 1.0446 | −0.0126 | 0.0000 | 0.0142 |
| FB | 0.0013 | 1.0165 | 0.0135 | 0.0000 | 0.0130 | |
| FIS | Fidelity National Information Services | 0.0007 | 1.0254 | −0.0105 | 0.0000 | 0.0121 |
| INTU | Intuit Inc. | 0.0009 | 1.0690 | −0.0017 | 0.0000 | 0.0095 |
| MU | Micron Technology | 0.0034 | 1.5374 | 0.0043 | 0.0000 | 0.0228 |
| MSFT | Microsoft Corp. | 0.0004 | 1.0180 | 0.0062 | 0.0000 | 0.0086 |
| MSI | Motorola Solutions Inc. | −0.0003 | 0.8260 | −0.0014 | 0.0000 | 0.0079 |
| NFLX | Netflix Inc. | 0.0022 | 1.3212 | 0.0346 | 0.0000 | 0.0298 |
| NVDA | Nvidia Corporation | 0.0003 | 0.9306 | 0.0205 | 0.0000 | 0.0123 |
| ORCL | Oracle Corp. | 0.0001 | 1.0933 | 0.0051 | 0.0000 | 0.0082 |
| STX | Seagate Technology | −0.0024 | 1.3765 | −0.0250 | 0.0000 | 0.0367 |
| TWX | Time Warner Inc. | −0.0005 | 0.8457 | 0.0028 | 0.0000 | 0.0113 |
| XRX | Xerox Corp. | −0.0003 | 1.3554 | 0.0236 | 0.0000 | 0.0096 |
| AABA | Yahoo Inc. | 0.0017 | 1.3106 | 0.0126 | 0.0000 | 0.0152 |
| WU | Western Union Co | 0.0002 | 1.2267 | −0.0410 | 0.0000 | 0.0084 |
| Retail | Firms | |||||
| Ticker Symbol | Equity Name | |||||
| AAP | Advance Auto Parts | −0.0001 | 0.8652 | −0.0133 | 0.0000 | 0.0150 |
| AMZN | Amazon.com Inc | −0.0005 | 1.2144 | 0.0193 | 0.0000 | 0.0201 |
| AN | AutoNation Inc | 0.0006 | 1.0543 | −0.0023 | 0.0000 | 0.0110 |
| AZO | Autozone Inc | 0.0013 | 0.7617 | 0.0008 | 0.0000 | 0.0082 |
| BBBY | Bed Bath & Beyond | −0.0016 | 1.2570 | −0.0076 | 0.0000 | 0.0143 |
| BBY | Best Buy Co. Inc. | −0.0012 | 1.4342 | 0.0063 | 0.0000 | 0.0282 |
| CBS | CBS Corp. | −0.0010 | 1.0655 | 0.0036 | 0.0000 | 0.0104 |
| CMG | Chipotle Mexican G. | 0.0006 | 1.0198 | 0.0047 | 0.0000 | 0.0184 |
| CMCSA | Comcast Corp. | 0.9510 | −0.0068 | 0.0000 | 0.0095 | |
| DLTR | Dollar Tree | −0.0014 | 0.9663 | 0.0188 | 0.0000 | 0.0133 |
| EBAY | eBay Inc. | −0.0007 | 1.0486 | −0.0092 | 0.0000 | 0.0116 |
| EXPE | Expedia Inc. | 0.0010 | 1.3392 | 0.0023 | 0.0000 | 0.0181 |
| HBI | Hanesbrands Inc | 0.0006 | 0.9680 | −0.0052 | 0.0000 | 0.0150 |
| HAS | Hasbro Inc. | 0.0002 | 0.8299 | 0.0081 | 0.0000 | 0.0081 |
| HD | Home Depot | 0.0003 | 0.8299 | 0.0114 | 0.0000 | 0.0064 |
| K | Kellogg Co. | 0.0005 | 0.5333 | −0.0027 | 0.0000 | 0.0108 |
| LOW | Lowe’s Cos. | 0.0002 | 1.1147 | −0.0240 | 0.0000 | 0.0123 |
| M | Macy’s Inc. | −0.0001 | 1.1101 | −0.0044 | 0.0000 | 0.0102 |
| MAR | Marriott Int’l. | 0.0000 | 1.0909 | 0.0073 | 0.0000 | 0.0093 |
| MAT | Mattel Inc. | 0.0015 | 0.8388 | 0.0193 | 0.0000 | 0.0130 |
| MCD | McDonald’s Corp. | 0.0009 | 0.5116 | −0.0063 | 0.0000 | 0.0068 |
| NKE | Nike | 0.0002 | 1.1616 | −0.0055 | 0.0000 | 0.0121 |
| JWN | Nordstrom | −0.0003 | 1.0169 | 0.0075 | 0.0002 | 0.0162 |
| HSY | The Hershey Company | −0.0003 | 0.6402 | 0.0013 | 0.0000 | 0.0090 |
| MOS | The Mosaic Company | −0.0003 | 0.8330 | −0.0059 | 0.0000 | 0.0064 |
| TRIP | TripAdvisor | 0.0008 | 1.8097 | 0.0138 | 0.0000 | 0.0208 |
| VIAB | Viacom Inc. | −0.0014 | 1.4595 | −0.0282 | 0.0000 | 0.0164 |
| WMT | Wal-Mart Stores | −0.0008 | 0.6603 | 0.0011 | 0.0000 | 0.0132 |
| WYN | Wyndham Worldwide | 0.0003 | 1.2731 | 0.0003 | 0.0000 | 0.0072 |
Table A2 Pre and post event test of volatility
| Indust. | preλ | postλ | Health | preλ | postλ | Fin. | preλ | postλ | Tech. | preλ | postλ | Retail | preλ | postλ |
| BA | 1.740 | 1.566 | AET | 1.795 | 5.621 | AFL | 1.153 | 5.364 | ADBE | 2.220 | 1.46 | AAP | 1.855 | 1.713 |
| CTAS | 1.317 | 4.571 | ANTM | 1.901 | 0.731 | AXP | 1.651 | 0.983 | AAPL | 1.932 | 2.009 | AMZN | 2.848 | 27.571 |
| DAL | 3.124 | 1.616 | BAX | 1.318 | 0.532 | AMP | 0.000 | 0.000 | AMAT | 1.773 | 0.360 | AN | 1.669 | 0.657 |
| EFX | 2.111 | 1.161 | CNC | 2.283 | 6.711 | AON | 1.149 | 0.138 | CSCO | 1.474 | 0.080 | AZO | 1.166 | 0.964 |
| GWW | 1.364 | 2.938 | CI | 1.978 | 0.438 | BAC | 1.813 | 0.055 | CTXS | 2.105 | 2.462 | BBBY | 2.666 | 1.836 |
| LMT | 1.577 | 8.679 | CVS | 1.186 | 2.542 | BBT | 1.346 | 1.235 | EA | 1.903 | 0.470 | BBY | 4.632 | 3.353 |
| NOC | 1.230 | 5.182 | DVA | 1.695 | 5.278 | COF | 1.958 | 0.622 | FB | 1.827 | 1.040 | CBS | 1.621 | 2.541 |
| RSG | 1.358 | 2.511 | HUM | 2.632 | 9.667 | SCHW | 1.906 | 1.114 | FIS | 1.679 | 1.600 | CMG | 2.555 | 1.786 |
| UPS | 1.171 | 2.192 | MCK | 1.093 | 0.299 | CFG | 3.089 | 4.521 | INTU | 1.587 | 2.484 | CMCSA | 1.387 | 0.058 |
| UTX | 1.329 | 1.481 | MDT | 1.344 | 5.727 | CME | 1.480 | 0.603 | MU | 3.402 | 1.070 | DLTR | 3.226 | 4.025 |
| PDCO | 1.374 | 1.263 | DFS | 1.637 | 1.630 | MSFT | 1.606 | 0.580 | EBAY | 2.078 | 1.035 | |||
| PKI | 1.985 | 0.800 | FITB | 1.587 | 0.000 | MSI | 1.670 | 1.540 | EXPE | 2.650 | 2.386 | |||
| DGX | 1.377 | 1.046 | GS | 1.541 | 23.000 | NFLX | 3.209 | 2.253 | HBI | 1.745 | 0.827 | |||
| TMO | 1.564 | 3.500 | JPM | 1.764 | 2.765 | NVDA | 1.962 | 3.589 | HAS | 1.656 | 0.759 | |||
| MTB | 1.227 | 0.781 | ORCL | 1.340 | 2.212 | HD | 1.497 | 4.920 | ||||||
| MMC | 1.150 | 1.262 | STX | 3.300 | 4.287 | K | 1.286 | 0.572 | ||||||
| MS | 1.761 | 0.663 | TWX | 1.600 | 2.706 | LOW | 1.954 | 3.063 | ||||||
| NTRS | 1.558 | 7.818 | XRX | 2.114 | 2.346 | M | 1.901 | 1.859 | ||||||
| PNC | 1.438 | 1.913 | AABA | 2.562 | 5.375 | MAR | 1.614 | 1.235 | ||||||
| PFG | 2.315 | 23.250 | WU | 1.597 | 3.385 | MAT | 2.012 | 3.73 | ||||||
| STT | 1.898 | 1.722 | MCD | 1.593 | 10.000 | |||||||||
| STI | 2.441 | 0.098 | NKE | 1.927 | 0.474 | |||||||||
| WFC | 2.586 | 2.225 | JWN | 1.715 | 2.442 | |||||||||
| HSY | 1.325 | 1.515 | ||||||||||||
| MOS | 1.816 | 2.308 | ||||||||||||
| TRIP | 3.526 | 5.000 | ||||||||||||
| VIAB | 3.388 | 6.672 | ||||||||||||
| WMT | 1.307 | 5.966 | ||||||||||||
| WYN | 1.793 | 0.455 | ||||||||||||
| Notes: The terms Industry, health, Fin, Tech, and Retail represent the Industrial, Health, Financial, Technology, and Retail sectors, respectively. The terms pre λ and post λ are the diagnostics in equation (6) for testing the significance of pre-event volatility and post-event volatility significance, respectively. These values are based on firm-specific volatility and market volatility. | ||||||||||||||
1Standard and Poor
2http://breachlevelindex.com. [Accessed: 05-November-2018]
3Sectors: Health, Retail, Industrial, Information Technology, and Financial
4https://www.forbes.com/sites/nicolemartin1/2019/02/25/what-is-a-data-breach/#1449cc7214bb [Assessed, July 29, 2019]
5The Standard and Poor’s 500: An American stock market index which is based on the market capitalizations of 500 large companies having common stock listed on the New York Stock Exchange (NYSE).
6One year stock returns, normally 250 trading days, are mostly used [55–57]
References
[1] A. Hovav and J. D’Arcy, “The impact of denial-of-service attack disclosures on the market value of firms,” Risk Manag. Insur. Rev., vol. 6, no. 2, pp. 97–121, 2003.
[2] H. Cavusoglu, B. Mishra, and S. Raghunathan, “The effect of internet security breach disclosures on market value: Capital market reactions for breached firms and internet security developers,” Int. J. Electron. Commer., vol. 9, no. 1, pp. 70–104, 2004.
[3] H. Copes, K. R. Kerley, R. Huff, and J. Kane, “Differentiating identity theft: An exploratory study of victims using a national victimization survey,” J. Crim. Justice, vol. 38, no. 5, pp. 1045–1052, 2010.
[4] M. Ko and C. Dorantes, “The impact of information security breaches on financial performance of the breached firms: an empirical investigation,” J. Inf. Technol. Manag., vol. 17, no. 2, pp. 13–22, 2006.
[5] S. Tweneboah-Koduah, F. Atsu, and W. Buchanan, “Impact of Cyber-attacks on Stock Performance: A Comparative Study,” Inf. Comput. Secur., no. 5, Oct. 2018.
[6] W. F. Sharpe, “Capital asset prices: A theory of market equilibrium under conditions of risk,” J. Finance, vol. 19, no. 3, pp. 425–442, 1964.
[7] J. Lintner, “The aggregation of investor’s diverse judgments and preferences in purely competitive security markets,” J. Financ. Quant. Anal., vol. 4, no. 4, pp. 347–400, 1969.
[8] J. Y. Campbell and L. M. Viceira, “The term structure of the risk–return trade-off,” Financ. Anal. J., vol. 61, no. 1, pp. 34–44, 2005.
[9] E. Balaban and C. T. Constantinou, “Volatility clustering and event-induced volatility: Evidence from UK mergers and acquisitions,” Eur. J. Finance, vol. 12, no. 5, pp. 449–453, 2006.
[10] R. Schimmer, K. K. Geschuhn, and A. Vogler, “Disrupting the subscription journals’ business model for the necessary large-scale transformation to open access,” 2015.
[11] M. Cruz, R. Coleman, and G. Salkin, “Modeling and measuring operational risk,” J. Risk, vol. 1, no. 1, pp. 63–72, 1998.
[12] Gemalto, “Data Breach Level Index:,” Gemalto blog, 13-Apr-2018. [Online]. Available: https://blog.gemalto.com/security/2018/04/13/data-breach-stats-for-2017-full-year-results-are-in/. [Accessed: 12-Feb-2020].
[13] F. S. Khan, J. H. Kim, R. L. Moore, and L. Mathiassen, “Data Breach Risks and Resolutions: A Literature Synthesis,” 2019.
[14] OAIC, “The Privacy Act,” OAIC. [Online]. Available: https://www.oaic.gov.au/privacy/the-privacy-act/. [Accessed: 12-Feb-2020].
[15] D. Hopkins and L. Mooney, “Caring about the notifiable data breach: The human impact on victims,” Gov. Dir., vol. 71, no. 8, p. 433, 2019.
[16] X. Chen, G. Hilary, and X. S. Tian, “Data Breach Disclosure and Insider Trading,” 2019.
[17] A. Acquisti, A. Friedman, and R. Telang, “Is there a cost to privacy breaches? An event study,” ICIS 2006 Proc., p. 94, 2006.
[18] K. B. Anderson, E. Durbin, and M. A. Salinger, “Identity theft,” J. Econ. Perspect., vol. 22, no. 2, pp. 171–192, 2008.
[19] C. Valdivia, “Token based account access,” 19-Jun-2014.
[20] J. Walsh, “System for detecting unauthorized account access,” 09-Dec-1997.
[21] R. U. Arora, “Measuring financial access,” Griffith Bus. Sch. Discuss. Pap. Econ., no. 7, 2010.
[22] N. Hoffman, D. F. Pare Jr, J. A. Lee, and P. D. Lapsley, “Tokenless financial access system,” 15-Jan-2008.
[23] N. Terry, “Existential challenges for healthcare data protection in the United States,” Ethics Med. Public Health, vol. 3, no. 1, pp. 19–27, 2017.
[24] I. H. Langford, “An existential approach to risk perception,” Risk Anal., vol. 22, no. 1, pp. 101–120, 2002.
[25] S. Hinde, “Spam: the evolution of a nuisance,” Comput. Secur., vol. 22, no. 6, pp. 474–478, 2003.
[26] L. A. Hughes and G. J. DeLone, “Viruses, worms, and trojan horses: Serious crimes, nuisance, or both?,” Soc. Sci. Comput. Rev., vol. 25, no. 1, pp. 78–98, 2007.
[27] P. J. Woods, “Hacktivism and Law Enforcement: A Qualitative Delphi Study on United States Law Enforcement Technology Dependency, Hacktivist Cyber-Attacks, and Agency Defensive Tactics,” PhD Thesis, Capella University, 2018.
[28] M. Omar, D. Mohammed, and V. Nguyen, “Defending against malicious insiders: a conceptual framework for predicting, detecting, and deterring malicious insiders,” Int. J. Bus. Process Integr. Manag., vol. 8, no. 2, pp. 114–119, 2017.
[29] K. Niihara, M. Yamada, and H. Kikuchi, “Sharing or non-sharing credentials: A study of what motivates people to be malicious insiders,” in International Conference on Human Aspects of Information Security, Privacy, and Trust, 2017, pp. 353–365.
[30] E. C. Thompson, “Who Wants Health Information?,” in Building a HIPAA-Compliant Cybersecurity Program, Springer, 2017, pp. 65–72.
[31] R. Sabillon, J. Serra-Ruiz, V. Cavaller, and J. Cano, “A comprehensive cybersecurity audit model to improve cybersecurity assurance: The cybersecurity audit model (CSAM),” in 2017 International Conference on Information Systems and Computer Science (INCISCOS), 2017, pp. 253–259.
[32] “Cost of a Data Breach Study |IBM.” [Online]. Available: https://www.ibm.com/security/data-breach?cm mc uid=32364261289715675090710&cm mc sid 50200000=90151091567509071047&cm mc sid 52640000=29709811567509071049. [Accessed: 03-Sep-2019].
[33] J. R. Veltsos, “An analysis of data breach notifications as negative news,” Bus. Commun. Q., vol. 75, no. 2, pp. 192–207, 2012.
[34] P. A. Argenti, “How technology has influenced the field of corporate communication,” J. Bus. Tech. Commun., vol. 20, no. 3, pp. 357–370, 2006.
[35] S. Romanosky, R. Telang, and A. Acquisti, “Do data breach disclosure laws reduce identity theft?,” J. Policy Anal. Manage., vol. 30, no. 2, pp. 256–286, 2011.
[36] S. Romanosky, R. Telang, and A. Acquisti, “Do data breach disclosure laws reduce identity theft?,” J. Policy Anal. Manage., vol. 30, no. 2, pp. 256–286, 2011.
[37] G. W. Schwert, “Stock volatility in the new millennium: how wacky is Nasdaq?,” J. Monet. Econ., vol. 49, no. 1, pp. 3–26, 2002.
[38] K. M. Gatzlaff and K. A. McCullough, “The effect of data breaches on shareholder wealth,” Risk Manag. Insur. Rev., vol. 13, no. 1, pp. 61–83, 2010.
[39] E. A. Morse, V. Raval, and J. R. Wingender Jr, “Market price effects of data security breaches,” Inf. Secur. J. Glob. Perspect., vol. 20, no. 6, pp. 263–273, 2011.
[40] T. G. Andersen, T. Bollerslev, F. X. Diebold, and H. Ebens, “The distribution of realized stock return volatility,” J. Financ. Econ., vol. 61, no. 1, pp. 43–76, 2001.
[41] B. J. Bushee and C. F. Noe, “Corporate disclosure practices, institutional investors, and stock return volatility,” J. Account. Res., pp. 171–202, 2000.
[42] F. Zhang, “High-frequency trading, stock volatility, and price discovery,” 2010.
[43] R. C. Merton, “On estimating the expected return on the market: An exploratory investigation,” J. Financ. Econ., vol. 8, no. 4, pp. 323–361, 1980.
[44] S. Baiman and R. E. Verrecchia, “Earnings and price-based compensation contracts in the presence of discretionary trading and incomplete contracting,” J. Account. Econ., vol. 20, no. 1, pp. 93–121, 1995.
[45] J. Francis, D. Philbrick, and K. Schipper, “Shareholder litigation and corporate disclosures,” J. Account. Res., pp. 137–164, 1994.
[46] N. Nonejad, “Forecasting aggregate stock market volatility using financial and macroeconomic predictors: Which models forecast best, when and why?,” J. Empir. Finance, vol. 42, pp. 131–154, 2017.
[47] V. Corradi, W. Distaso, and A. Mele, “Macroeconomic determinants of stock volatility and volatility premiums,” J. Monet. Econ., vol. 60, no. 2, pp. 203–220, 2013.
[48] A. C. MacKinlay, “Event studies in economics and finance,” J. Econ. Lit., vol. 35, no. 1, pp. 13–39, 1997.
[49] A. Garg, J. Curtis, and H. Halper, “Quantifying the financial impact of IT security breaches,” Inf. Manag. Comput. Secur., vol. 11, no. 2, pp. 74– 83, 2003.
[50] K. Kannan, J. Rees, and S. Sridhar, “Market reactions to information security breach disclosures: An empirical analysis,” Int. J. Electron. Commer., vol. 12, no. 1, pp. 69–91, 2007.
[51] N. Gupta, “Partial privatization and firm performance,” J. Finance, vol. 60, no. 2, pp. 987–1015, 2005.
[52] S. D. Friedman and H. Singh, “CEO succession and stockholder reaction: The influence of organizational context and event content,” Acad. Manage. J., vol. 32, no. 4, pp. 718–744, 1989.
[53] A. Pajuste, “Corporate governance and stock market performance in Central and Eastern Europe: A study of nine countries, 1994-2001,” Available SSRN 310419, 2002.
[54] M. Ko and C. Dorantes, “The impact of information security breaches on financial performance of the breached firms: an empirical investigation,” J. Inf. Technol. Manag., vol. 17, no. 2, pp. 13–22, 2006.
[55] B. L. Dos Santos, K. Peffers, and D. C. Mauer, “The impact of information technology investment disclosures on the market value of the firm,” Inf. Syst. Res., vol. 4, no. 1, pp. 1–23, 1993.
[56] K. S. Im, K. E. Dow, and V. Grover, “A reexamination of IT investment and the market value of the firm—An event study methodology,” Inf. Syst. Res., vol. 12, no. 1, pp. 103–117, 2001.
[57] A. Hovav and J. D’Arcy, “The impact of denial-of-service attack disclosures on the market value of firms,” Risk Manag. Insur. Rev., vol. 6, no. 2, pp. 97–121, 2003.
[58] T. Bollerslev, “Generalized autoregressive conditional heteroskedasticity,” J. Econom., vol. 31, no. 3, pp. 307–327, 1986.
[59] S. J. Brown and J. B. Warner, “Measuring security price performance,” J. Financ. Econ., vol. 8, no. 3, pp. 205–258, 1980.
[60] R. Savickas, “Event-induced volatility and tests for abnormal performance,” J. Financ. Res., vol. 26, no. 2, pp. 165–178, 2003.
[61] S. Armitage, “Event study methods and evidence on their performance,” J. Econ. Surv., vol. 9, no. 1, pp. 25–52, 1995.
[62] D. Krivin, R. Patton, E. Rose, and D. Tabak, “Determination of the appropriate event window length in individual stock event studies,” Available SSRN 466161, 2003.
Biographies

Samuel Tweneboah-Koduah, PhD is a full-time Lecturer at the Computer Science Dept. School of Technology, GIMPA, Accra, Ghana. Samuel has also been a visiting Lecturer to the Centre of Media and Information Technology, Aalborg University, Copenhagen, Denmark, a visiting Scholar to the University of Washington, Seattle and Northern Kentucky University USA. He has a number of peer-reviewed journal publications to his credit and has presented a couple of papers at international conferences. As a lecturer and a scholar, Samuel has been involved in a number of projects, both at national and international levels. Currently, he is the Ministry of Health (Ghana) appointed Governing Chairperson of Twifu-Praso Nursing and Midwifery Training College. Samuel’s research interest is in the areas of Cybersecurity and Risk Assurance, Digital Forensics, Technology Innovation and Application, Data Mining, Cloud Computing, Internet of Things, Wireless and Mobile Networks.

Francis Atsu is a consultant for the Ministry of Finance on Basel Accords under the Ghana Economic Management Strengthening Technical Assistance (GEMS-TA) project funded by the World Bank. He is the head of the enterprise risk management team of GIMPA, trustee of GIMPA provident fund and occupational pension scheme. Dr. Atsu research interests include risk modelling and management; economic and financial modelling and forecasting; behavioral finance, and survival analysis of corporate entities. He holds a PhD in Finance, MSc in Financial Mathematics and BSc (Hons) in Mathematics.

Ramjee Prasad, a Fellow of IEEE, IET, IETE, and WWRF, is a Professor of Future Technologies for Business Ecosystem Innovation (FT4BI) in the Department of Business Development and Technology, Aarhus University, Herning, Denmark. He is the Founder President of the CTIF Global Capsule (CGC). He is also the Founder Chairman of the Global ICT Standardization Forum for India, established in 2009. He has been honored by the University of Rome “Tor Vergata”, Italy as a Distinguished Professor of the Department of Clinical Sciences and Translational Medicine on March 15, 2016. He is an Honorary Professor of the University of Cape Town, South Africa, and the University of KwaZulu-Natal, South Africa. He has received Ridderkorset of Dannebrogordenen (Knight of the Dannebrog) in 2010 from the Danish Queen for the internationalization of top-class telecommunication research and education awards such as IEEE Communications Society Wireless Communications within the field of wireless and personal communication, 2014 IEEE AESS. He has received several international Technical Committee Recognition Award in 2003 for making contribution in the field of “Personal, Wireless and Mobile Systems and Networks”, Telenor’s Research Award in 2005 for impressive merits, both academic and organizational, Outstanding Organizational Leadership Award for: “Organizational Leadership in developing and globalizing the CTIF (Center for TeleInFrastruktur) Research Network”, and so on. He has been the Project Coordinator of several EC projects namely, MAGNET, MAGNET Beyond, eWALL. He has published more than 50 books, 1000 plus journal and conference publications, more than 15 patents, over 140 Ph.D. Graduates and a larger number of Masters (over 250). Several of his students are today worldwide telecommunication leaders themselves.
Journal of Cyber Security and Mobility, Vol. 9_3, 355–384.
doi: 10.13052/jcsm2245-1439.931
© 2020 River Publishers