Similarity Analysis of Single-Vendor Marketplaces in the Tor-Network
Florian Platzer*, Fabian Brenner and Martin Steinebach
Fraunhofer SIT, ATHENE, Germany
E-mail: florian.platzer@sit.fraunhofer.de; martin.steinebach@sit.fraunhofer.de
*Corresponding Author
Received 15 December 2021; Accepted 19 January 2022; Publication 16 March 2022
Abstract
Single-vendor shops are darknet marketplaces where individuals offer their own goods or services on their own darknet website. There are many single-vendor shops with a wide range of offers in the Tor-network. This paper presents a method to find similarities between these vendor websites to discover possible operational structures between them. In order to achieve this, similarity values between the darknet websites are determined by combining different features from the categories content, structure and metadata. Our results show that the features HTML-Tag, HTML-Class, HTML-DOM-Tree as well as File-Content, Open Ports and Links-To proved to be particularly important and very effective in revealing commonalities between darknet websites. Using the similarity detection method, it was found that only 49% of the 258 single-vendor marketplaces were unique, meaning that there were no similar websites. In addition, 20% of all vendor shops are duplicates. 31% of all single-vendor marketplaces can be sorted into seven similarity groups.
Keywords: Tor, vendor sites, similarity detection, feature importance, darknet offer.
1 Introduction
There are often reported negative things about the darknet: selling drugs, weapons, fake passports or services for hacking attacks or hiring killers. All of this can be purchased online through so-called darknet marketplaces. But there are also positive effects. The darknet can be used for censorship-free and private communication. Users in countries with censored Internet access still have the opportunity to obtain information via the darknet. Whistle-blowing is possible without losing anonymity. The darknet is therefore a distinct dual nature. The largest and most-known technology to establish a specific darknet is the Tor-network.
Websites hosted as hidden services in the Tor-network, end with ‘.onion’ and are therefore simply called onions.
There are some works about content analysis of Tor hidden services. Spitters et al. indicate that most hidden services exhibit illegal or controversial content [34]. Another work shows that the content on the darknet is diverse but much of it is of questionable legality [27]. And Biryukov et al. point out that the number of hidden services with illegal content and the number of other hidden services is almost the same [3]. However, the question arises whether there are in fact so many individuals who use Tor for illegal offers. Many of the marketplaces look very similar and have the same site structures, same pictures or even the same content. Moreover, it could be that some marketplaces come from the same operator. The darknet could be even smaller than expected if the offer in the darknet is already not that large and some operators are behind several marketplaces.
In the context of this paper, an operator is referred to as the developer and as the person, or group of people, who maintain the single-vendor marketplace. Presumably, an operator often creates a marketplace with similar characteristics or uses similar techniques. Through the combination of various feature comparisons in different categories, a final value can be calculated which indicates the similarity. The used categories are content, structure and metadata. They make use of different components of websites and their occurring transmission data. Our method generates similarity values between single-vendor marketplaces and creates a cluster between them, which can be viewed as a dendrogram to identify possible groups of similar single-vendor marketplaces.
In this work the following two research questions will be answered:
1. Which features can be used for analysis and which of them offer a high degree of distinctness?
Which information from onions are applicable and sufficient for calculating an expressive similarity value. Depending on a degree of distinctness some features are more crucial than others and the comparison of these features can be weighted more, so that a more accurately detection is possible.
2. If several single-vendor marketplaces belong together, how big is the offer in the darknet in reality?
A recent study shows that onions related to suspicious content tend to have multiple duplicates under different addresses [1]. These duplicates, also called mirrors, are created for the availability, traffic distribution, and security of the onions. Therefore, these copies are on different servers and have different addresses. In addition, anyone can copy a single-vendor marketplace in the darknet and host it themselves as a fake shop.
This paper is an enhanced and extended version of our work published 2021 in [4]. Additional results are provided and a more detailed discussion of related work including our own previous work was added. It is structured as follows: Section 2 explains some basic information relevant for this work regarding the Tor-network as well as tools utilized for answering our research questions. Section 3 provides an overview of related work addressing the darknet and website similarity research including our own previous work beyond [4]. In Section 4 we describe our method for discovering similar single-vendor marketplaces. Section 5 lists the applied comparison features and provides explanations for each. The method is evaluated and all used features are analyzed for their importance in Section 6. In Section 7 we summarize our work, followed by a discussion in Section 8 and a conclusion in Section 9.
2 Background
In this section the necessary background information are explained. First, the darknet, in particular the Tor-network, websites in the Tor-network and darknet marketplaces are described in Subsection 2.1. The needed comparison metrics to determine a similarity value are stated in Subsection 2.2. In the last Subsection 2.3, the criteria used to measure the importance of a feature is described.
2.1 Darknet and Tor
The abstract term darknet refers not to a specific hidden network [25]. It describes a private type of network, which can be accessed only by a special software and not in a conventional way. The intention behind this technology is that communication is encrypted and the anonymity of the user is protected [46]. There are many technologies which aim to achieve these goals, such as Tor [13], Freenet [8], and I2P [17]. One of the most used is Tor, which is an overlay network on top of the Internet and developed by the Tor Project. The main goals of this project are the circumvention of censorship, protection against mass surveillance and the protection of anonymity. One important feature to achieve these goals is that Tor is based on what is called Onion Routing [13]. The message is wrapped in several layers of encryption. This multi-encrypted message is routed through multiple Tor nodes, each Tor node knowing only its predecessor and successor. In comparison to the clearnet, the Tor-network does not show IP addresses of the users at the destination server.
If someone wants to visit a common website via Tor, the traffic is sent out to the website through several nodes in the Tor-network. The last node, also called exit node, finally makes the requests to the web server and thus hides the IP address of the one actually making the request. In the Tor-network servers can provide as hidden services. In this case, all traffic is routed entirely within Tor and is encrypted end-to-end. In addition, the server also stays anonymous.
2.1.1 Websites in the Tor-network
Websites in General. A website is a set of web pages hosted on a web server. They consist of text content, images, colors, arrangement of elements, further links and possible functions for interaction. These web pages are usually based on HTML, CSS and JavaScript. HTML is short for Hypertext Markup Language and gives the logical structure on the page. The CSS, Cascading Style Sheets, is used for the presentation of the document, including layout, color and fonts. CSS and HTML are standards maintained by the World Wide Web Consortium (W3C). JavaScript is an event-driven, functional programming language which is often used in websites to make them interactive on the client side. Even though web pages consist mainly of text, they have a structure, so they are considered as semi-structured data [9]. With the Document Object Model of the HTML, short DOM, JavaScript can access and manipulating the HTML document. With the DOM, the elements on a HTML web page and its sub-elements are structured like a tree. Tags, like body and \body, define the beginning and the end of a HTML element. A simple HTML-DOM-Tree with its structured elements is shown in Figure 1. The elements that act as nodes can contain additional attributes for further uses, as IDs and class names. These attributes are used to address HTML tags via JavaScript or to form classes for CSS.

Figure 1 Example for a simple DOM-Tree.
Services and Websites in the Tor-network. Because the Tor-network is a overlay network, the same protocols can be used. HTTP is the most common, followed by SSH and SMTP [37]. Websites on onions are also built with HTML, CSS and JavaScript, as it is the case in the clearnet. But JavaScript should be deactivated to assure better anonymity for the user in Tor-network.
The types of onions in the Tor-network are manifold. A study of over 10,000 onions shows that the activities in the Tor-network range from normal activities, like Hosting/Software, Cryptocurrency and Personal, to suspicious activities, such as Drugs, Counterfeit Credit-Card and Pornography [1]. The main language in the Tor-network is English [1, 37]. Many of the permanent services in the Tor-network do not provide actual content. Only a small subset of services are popular among users. A significant part are multiple domains, duplicated onions for phishing or bot systems [37].
2.1.2 Darknet marketplaces
Shops or marketplaces for illegal goods, digital as well as analogue, are widely known aspects of darknets like Tor. They utilize the anonymity of the network to stay safe from legal prosecution. While our own research on the frequency of visited hidden services [38] indicates that such offerings are only second to command and control infrastructures in the darknet, other research see a more prominent role: Al Nabki et al. point out that the sale of illegal products and services is the most common observable suspicious activity in the darknet [26]. Many big marketplaces, which were designed like Ebay or Amazon, are hosted in the Tor-network. Multiple vendors can sell their products and services over these platforms and get rated by their buyers. Cryptocurrencies are used as payment to provide anonymity for buyers and sellers and a small amount of a commission goes to the marketplace operator for each transaction. Most of these marketplaces require registration in order to see and buy the available supply. In addition, these marketplaces are often protected by captchas.
Besides the large multi-vendor marketplaces there are also small single-vendor marketplaces in the Tor-network. Only one vendor offers its products for sale on this marketplace. These single-vendor marketplaces often consist of a page with their listed offered products or services, a page with payment information or FAQ and a login and register service for users. In the course of this work the single-vendor marketplaces that can be found in darknet are called vendor onions. The difference of both kinds of marketplaces can be seen in Figure 2. A larger darknet marketplace is on the left, while a vendor onion can be seen on the right.
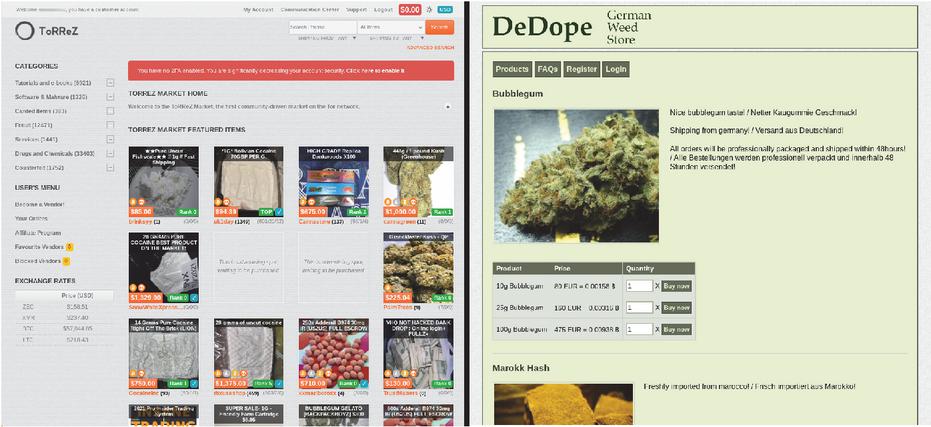
Figure 2 Example of a multi-vendor darknet marketplace on the left, and a single-vendor darknet marketplace on the right.
2.2 Comparison Metrics for Similarity Determination
In this section the used metrics for calculating a similarity value, Jaccard-Similarity, Relative Difference and Tree Edit Distance are explained.
2.2.1 Jaccard-Similarity
The Jaccard-coefficient measures the similarity between two finite sample sets and can be defined as the size of the intersection divided by the union of both [22]. In this paper, one object from a set is equal to another if it is exactly identical. For example, the same value for numbers and the identical sequence of characters for a string. In order to get the Jaccard-Similarity value between zero and one, the Jaccard-coefficient is subtracted from . The Equation (1) shows the Jaccard-Similarity for two sets and .
| (1) |
2.2.2 Relative Difference
The Relative Difference is used to generate a similarity value between two numbers of the same context. The difference between two numbers and is divided by a reference value. The reference value will be the maximum of both numbers. This function is general, but could be modified in individual cases if an absolute reference value is known.
| (2) |
2.2.3 Tree Edit Distance
The Tree Edit Distance (TED) algorithm calculates a distance between two trees. It is defined as the minimum-cost sequence of operations to transform one tree to another [32]. The operations for transformation are (a) modify, (b) delete and (c) insert. For example, in order to convert an empty tree into a full tree, as many operations are needed as the full tree has leaves. The algorithm is used for ordered trees, in which the order between the node siblings is significant [51].
2.3 Feature Importance in Decision Trees
Decision trees are ordered, directional trees that are used to represent decision rules [9]. The hierarchically successive decisions are displayed as a tree diagram. In this work a scikit1 decision tree classifier with the CART algorithm is used, to determine the degree of distinctness of our features, with the help of the Feature importance. The criterion for measuring the information content is based on the Gini Impurity. The Gini Impurity, also called Gini, is the probability of a random incorrect classification. It is a measure of how often a selected element from a set would be mislabeled if it were randomly labeled according to the distribution of the class labels in the subset [24, 16]. In order to determine how important a feature is in a decision tree, scikit uses the Gini Importance for each node where the feature occurs. The first step is to calculate the Node Importance for the individual nodes , as shown in Equation (3). The weighted samples reaching the branch are included in the calculation as variable . The corresponding node and its two subnodes (,) are given in as Gini Impurity.
| (3) |
Since a feature can occur multiple times in nodes of a decision tree, the Node Importance for each of these nodes is summed and divided by all occurring Node Importance values to calculate the Feature importance , as show in Equation (4).
| (4) |
3 Related Work
In this section, similar works on the topic of this paper are listed. First, related works that focuses on darknet research. Second, works that were used to compare websites in general. In order to compare websites in the darknet, we use the approaches from the clearnet.
3.1 Darknet Research
In recent years, many different studies on darknet markets and their ecosystem have emerged. The topics of darknet research range from geographical analysis [5], scamming and reputation [14], phishing [39], vendor detection across marketplaces [41], the influence of the darknet on cyber attack strategies [48], authorship analysis in forums [33, 18] to products sales in darknet shops [50, 49]. For an even broader perspective, the role of the darknet with respect of cyber-war is discussed in [12], and in [36] the role of darknet mechanisms in file-sharing networks are analyzed.
The research paper from Zhang et al. [52] conducted studies about vendor detection within or across multiple marketplaces. Descriptive data from vendors, like photos or product descriptions, can link several vendors together. Similar to them are authorship studies for user linkage in darknet forums. A thorough search of the relevant literature did not reveal a related article comparing single-vendor marketplaces. This work aims to fill this gap in literature.
3.2 General Web Page Similarity
Our paper benefits from several research fields. NLP-Tools can help for Information Retrieval and Text-Mining. Code stylometry studies show how authorship attribution works [11, 45]. Typically they rely on lexical, syntactical and structural features of code. Often as it also is with stylometry from lyrics fields, a large data set is needed to achieve a good accuracy to create associations. It depends heavily on the number of authors, the amount and the length of the training data [35]. In order to determine if the authors are the same, neural networks and decisions trees are used. In addition, decision trees have the advantage, that their results are human readable [30]. Which data can be extracted for analysis is shown in research about comparison of HTML, or its similar type XML [21]. Studies on web page similarity or web mining go back to the 90s where the Internet developed to a commonly used technology [51, 20, 47]. This also led to works on web genre classification [43, 7, 23]. Phishing detection methods on websites use also similarity based approaches [19]. Not only features from website and its lexical features can help to determine the similarity. Also metadata like location or timing can correlate accounts across sites and should be considered [15].
3.3 Features for Website Comparison
This section summarizes the different features from the related works, which are used to determine the similarity between websites or textual content. All of these works use different features depending on the application purpose. There are no standards which features should be used and under which categories they should be listed. The features could be classified into the following categories: Textual Features, Structural Features, Visual Features and Contextual Features.
3.3.1 Textual Features
The textual content of a websites is one extensive category for feature extraction. Lexical Features [23, 52, 44] concerning the analysis of isolated words without considering the text context. These can be features like the percentage of words that start with an upper-case letter, percentage of lower-case letters, average word length, word length histogram, punctuation frequency, stop-word frequency, character unigram and Part-of-Speech (POS)[44]. In similar works for web genre identification this category is also called Text statistic [43]. But also the context of the textual content can be considered for similarity analysis. Specific Keywords can be used as features [19], like PGP keys or contact information [52].
3.3.2 Structural Features
The HTML elements of all pages of an onion are essential for the appearance and function. The structure of a HTML document can be compared with its HTML elements, especially the HTML-Tags [23, 42] and the HTML-DOM-Tree structure [31]. The similarity between the tags can be calculated with the TFDA [42] and for the DOM structure with the TED, Fourier Transform Similarity or Path Shingle [6, 40].
Tombros and Ali demonstrated that the combination of many features of a web page are effective for similarity calculations [42]. The title, head and font tags are significant for semantic content and an effective source for similarity measure. For their similarity approach they use the textual content within HTML elements, the structural layout of pages in form of the tag frequency distribution analysis (TFDA), and the query terms contained within pages. The TFDA is based on the work of Cruz et al. [10] and its equation is shown in Equation (5). The frequencies and for each tag are given as percentage values (%) and all weights for each tag summed together should give a total of 1. The maximal distance can never reach above 10,000, so this value can used for normalization.
| (5) |
The TFDA is less effective than the contend-based approach, but in combination with several other approaches it improves a lot. Overall, combinations of factors are more effective than the use of one single factor. This work shows that it is possible to calculate similarity values between web pages with a tag frequency method. This method is modified, in Section 5.2, accordingly to the intention of this work, to use the full range between zero and one for a similarity value.
3.3.3 Visual Features
The appearance is one of the most outstanding and diverse components of websites. Visual Features like CSS information can be used for comparison. The elements on websites consist of different colors, text alignments, image attributes or orientation and font families [19]. But also the images and their content can be used. The style of the photography can include information about the operator [52].
3.3.4 Contextual Features
In the area of web genre classification the context, in which the website is located, can be used to identify the website genre. Frequently the URL, Hyperlink, Content Type and the Domain are used as features. The URL for example can contain keywords or show the structure of the website [43]. Another example are Hyperlinks. The Internet can be seen as a network of connected sites, each of them linked to another. The early Google PageRank algorithm used the quantity and the quality of hyperlinks to another site to determine its rank on the google search engine [2].
4 Concept
In order to detect similarities behind multiple vendor onions in the Tor-network, a system is needed which generates similarity values between onions and then creates a cluster between the compared ones. These clusters can be inspected as a dendrogram to identify possible groups of similar onions. Existing feature comparison methods for the clearnet need to be adapted to the Tor-network and also applicable new ones need to be found. Some of the existing methods of comparing features have been compared in detail in the past, but not in a system with multiple features. In this section the concept of a method to discover the similarity of single-vendor onions in the Tor-network is described.
4.1 Method Overview
Our method consists of five steps. The first step, data gathering, represents the onion crawling from the Tor-network. All needed files for each onion should be crawled in this step. Afterwards, in step two, every single onion is prepared in a way that a simple extraction of the data can take place. In the third step every required feature will be extracted. In the fourth step, when all onions were processed, the calculation of the similarity can be started. Each onion is compared to all other onions. In the last step, all calculated data is clustered to reveal possible structures. All steps are shown in Figure 3 and are explained in more detail in the following subsections.
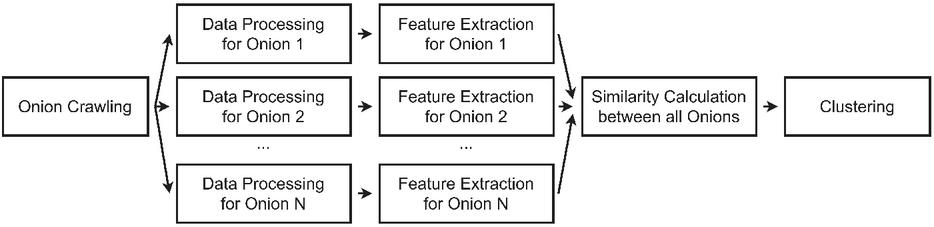
Figure 3 Individual steps of the method.
4.1.1 Data gathering
The aim in this step is to obtain all information for the onions, e.g. the files used by each onion or their metadata. For the collection of the data in the Tor-network, the same gathering, crawling and scraping methods can be used as in the clearnet. In addition, a proxy system for data forwarding into the Tor-network is needed.
4.1.2 Data processing
The second step for this method is the data processing. This step must be carried out for each individual onion. For further use of the data the files of the onions should be prepared in a way that the subsequent data extraction is simplified. The HTML documents of the onions have to be parsed and processed to get the necessary textual content. The python library Beautiful Soup,2 a tool for parsing HTML documents, is used for the extraction of the textual content. In order to process the necessary textual content, the Natural Language Processing Toolkit (NLTK)3 can be used. Stop words, like common grammatical articles or verbs, are not removed in the texts because the single-vendor marketplaces contain only small text information and stop words could potentially include similarity characteristics.
4.1.3 Feature extraction
After the data processing the features of each individual onion are extracted into the three categories content-based, structure and metadata. In order to create a tree structure from the HTML-DOM, the tool lxml4 is used.
4.1.4 Similarity calculation
In this step all onions are compared to each other. For each feature, a comparison takes place, which results in a similarity value between zero and one; one means totally similar and zero dissimilar. For every feature comparison an appropriate similarity function will be applied. Mostly, for feature sets of multiple values the Jaccard-Similarity (1) is used and for single numbers the Relative Difference (2). The individual features and its comparison techniques are explained in Section 5.
In order to achieve an aggregation of the individual similarity values, a Final Similarity Value is calculated. Therefore, a simple mean function is used, which is shown in Equation (6) and visualized for two onions in Figure 4. The finite set contains all similarity values of each feature and the finite set all related weights. Each similarity value should be multiplied by a weight and then summed up. The resulting sum should be divided by the sum of all weight values.
| (6) |
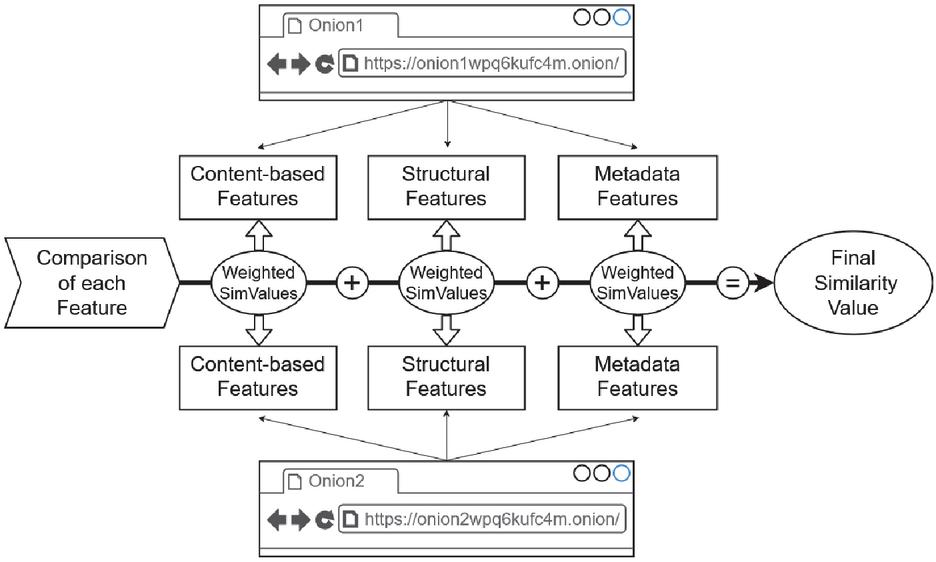
Figure 4 Calculation of a final similarity value between two onions.
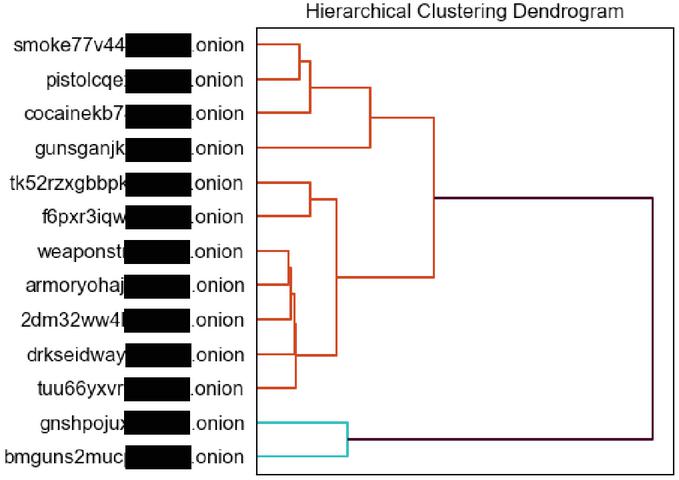
Figure 5 An example of a dendrogram. The two closest similar clusters are merged into a hierarchically higher cluster.
4.1.5 Clustering
In order to show possible structures in several onions, the similarity values between them are clustered. Therefore, an agglomerative hierarchical clustering analysis is applied. This clustering technique starts with every sample as a cluster. Afterwards, the two closest similar clusters are merged into a hierarchically higher cluster. This process is repeated until only one cluster which contains all samples is left [9]. A hierarchical cluster can displayed as a dendrogram and is shown in Figure 5. After the feature extraction of each onion, different types of data are available. These range from simple numerical data to a variety of data sets consisting of many different strings. This makes data clustering more difficult because cluster algorithms use distances and the similarity calculation in part 4.1.4 provides only similarity values. In order to solve this problem, all similarity values of each feature from one onion to another onion are used as a input vector for clustering. This procedure is applied to every feature comparison. With features and onions, the total input vector for one onion are values. In order to build an input vector, the use of this technique is appropriate for a relatively small amount of onions but for larger quantities it may lead to performance problems. To solve this, a dimensional reduction is required [9] or the features set is built with only the final similarity value between onions. Additionally, if a similarity value for a specific feature comparison cannot be made, because no data is available, the mean value is used to provide the cluster method with a value. This mean value is calculated by all other available comparison values, which were generated during the analysis of the data set.
5 Feature Selection
In this section all features that are extracted and used for the comparison are explained within their corresponding categories. The features are derived from the features of the related works Section 3. They have been divided into the three categories content-based, structure and metadata. All of them are listed with their extraction and comparison techniques.
5.1 Content-based Features
All characteristic information that can be obtained from the contents of the onions are assigned to the category content-based. These include certain keyword information and multiple lexical features, which are also common in different approaches [23, 52, 44, 43]. In Table 1 all content-based features are shown.
Table 1 Content-based features for comparison
| Content-based Features | |
| Lexical Features | Average Char-Length of Words |
| Average Word-Length of Sentences | |
| Vocabulary Richness | |
| Frequency of Uppercase Words | |
| Frequency of Lowercase Words | |
| Frequency of Alphabetical Words | |
| Frequency of Special Words | |
| Frequency of Digits | |
| Frequency of Punctuation | |
| Keyword Features | Email Addresses |
| IPv4/IPv6 Addresses | |
| Bitcoin Addresses | |
| Related Bitcoin Addresses | |
| Google Analytics IDs | |
| Google Publisher IDs | |
| HTML/CSS/JS Comments | |
| 50 Most Common Words | |
| Public and Private Keys | |
Lexical Features [23, 52, 44] concern the analysis of isolated words without considering the text context. They are used to capture stylistic text properties and range from the average char-length of words up to the frequency of punctuation in the HTML files. The similarity calculations for all lexical features are based on the Relative Difference (2).
Keywords can also be used as features like PGP keys, email addresses or IP addresses. The keyword features that are obtained from the textual content in this paper are mostly special strings which may be used by the same operator. Those can often found with regular expressions, like onion links, email addresses or IPv4/IPv6 addresses. The Jaccard-Similarity (1) is used for the similarity calculation of the resulting sets.
Bitcoin is the most common cryptocurrency in the darknet. Especially the vendor onions contain Bitcoin addresses, which are provided on the onions by the sellers to buy a product or service. If these addresses are found on the pages, they will be compared with Jaccard-Similarity (1). Another option is the relation between them. It is hypothesized, that the same operator is involved if the Bitcoin addresses are connected to each other, especially if there is a direct money transaction between them. The aim is to explore the vendors’ wallets and uncover possible connections.
The analysis method is based on the simplest case, when no anonymization technology in Bitcoin transaction was used. A further condition is that the onion contains one or several Bitcoin addresses. In the pre-processing step, for each of them a set of related Bitcoin addresses is extracted. Each of these related Bitcoin addresses were involved in some way in a transaction with the origin Bitcoin address or addresses of the onion. For the calculation of the similarity value, it is examined whether there is a transaction at all, and if so, whether the transaction exists via a related address or directly. If there is no transaction, the similarity value 0 is assigned; 0.5 for a transaction via a related Bitcoin address and 1 for a direct transaction between the original Bitcoin address. Equation (7) presents the assignment for the related Bitcoin similarity.
| (7) |
5.2 Structure Features
As mentioned in Section 3.3.2, the HTML elements of all pages of an onion are essential for the appearance and function. The structure of a HTML document can be compared with its HTML elements. In Table 2 all used structure features are shown.
Table 2 Structural features
| Structural Features | |
| HTML-element | Frequency of HTML-Tags |
| Frequency of HTML-Classes | |
| Frequency of HTML-IDs | |
| DOM structure | Merged HTML-DOM-Tree |
HTML Elements
The names of the HTML-Classes and the HTML-IDs are not fixed and can be named individually by the developer. For both, all possible elements are stored in sets and duplicate elements are ignored. In order to generate a similarity value, the Jaccard-Similarity (1) is used for both sets.
The comparison with the HTML-Tags turned out to be efficient in some works [6, 42]. For the purpose of calculating a similarity value between tags, a tag frequency distribution analysis (TFDA) is used. The frequency of tags is compared in a similar way to the work of Cruz et al. in 1998 [10]. But the normalization is done by a lower reference value to spread the similarity value.
HTML-DOM-Tree Extraction
Due to the fact that an onion consists of several pages and a comparison of single pages with each other is inefficient, the DOM trees of all sites were merged. The attempt is to map the onion with all its pages into one tree, so that all paths are combined. This means that just one tree needs to be compared, instead of all trees of the web pages individually. With a merged HTML-DOM-Tree, this similarity approach is more similar to the idea of the Path Similarity or Path Shingles [6]. In order to determine the similarity of the onion path trees and , the APTED algorithm [28] is used. For a final normalized value between zero and one, the APTED distance is divided by the number of nodes of the tree with the most nodes. The subsequent value is subtracted from 1 as shown in the Equation (8).
| (8) |
5.3 Metadata Features
Metadata is a term used to describe structured data that contains information about other data. Table 3 shows features that are grouped into the category metadata.
Table 3 Metadata features
| Metadata Features | |
| Document Meta | HTML-Doc Types |
| File Content Types | |
| Hyperlinks | Links To other Documents |
| Time-based | Downtimes |
| Server Meta | Descriptions of Server |
| Open Ports | |
Content Types
Content types indicate the media type of the resource. HTML, CSS and JavaScript are content types which are downloaded during a visit on an onion. But pictures in different file types like SVG, JPEG or PNG, and data formats like JSON or XML are also in use. These content types and their frequency will be used to determine the similarity. In addition, HTML documents can start with the specific declaration !DOCTYPE. In older documents these document types refer to a specific Document-Type-Definition (DTD). These determines the grammar and syntax of the HTML language. The Jaccard-Similarity (1) is used for these features as similarity calculation.
Hyperlinks
The interconnection of websites, like in the clearnet, can also be observed between onions in the darknet. These hyperlinks not only link to other onions but also to websites in the clearnet. Possible links are to certain icons, fonts or JavaScript libraries. For each onion, the hyperlinks are stored that link from one onion to another onion. The similarities of the set are calculated using Jaccard-Similarity (1).
Downtimes
Some onions in the darknet may be up and down at irregular times [37]. The days on which an onion was once offline are stored and compared with the days of other onions.
Server Information
In typical HTTP traffic, the server sends information in the header of the data message. The header of the server response message can contain information about the used server. These values are also extracted from the onions to compare them with the values of other onions. Open ports on the server can also be detected [37]. These will be compared using the Jaccard-Similarity (1).
6 Evaluation
In this section, our method for detecting similar onions is evaluated and all features used are analyzed on their importance. The section is structured as follows: Subsection 6.1 describes the data collection progress. After that, in Subsection 6.2, the results from the execution of the method are presented. In Subsection 6.3 the categorization of comparisons between onions is shown based on the results. Following in Subsection 6.4, the correct operation of the method is checked by analyzing the resulting similarity values. Finally in Subsection 6.5, effective features for comparison are extracted with decision trees.
6.1 Data Collection Progress
In order to get the required vendor onions from the Tor-network, the DUTA-10k data set was used for extraction. In further analysis for the Tor-network, researchers from the university of Leon in Spain created this data set, which contains 10,367 onions labeled into 25 different categories [1]. This DUTA-10k data set is based on the DUTA data set crawled between May and July 2016 [26] and was extended with 3,536 collected onions in July 2017. In order to get all features described in Section 5, all online onions have been crawled between March 2019 and October 2020. The intersection of the onions with the DUTA-10k labels Marketplace, Violence, Drugs, Counterfeit Credit-Cards, Counterfeit Money, Hacking and Services (total of 1,826 onions), and our crawled database gives the quantity of 281 onions.
6.2 Analysis
In the first analysis, all features mentioned in Section 5, could be extracted and compared. The depth of the extracted and merged HTML tree was limited to 15. Furthermore, no weightings are in use for the calculation of the final similarity value. With 281 onions a total of 39,340 comparisons between onions could be made. That are all combinations without repetition (). The resulting dendrogram from the analysis is shown in Figure 6. In this figure are many small distances between onions that could possibly be onions which are hosted twice or more. In addition, two large clusters can be seen.
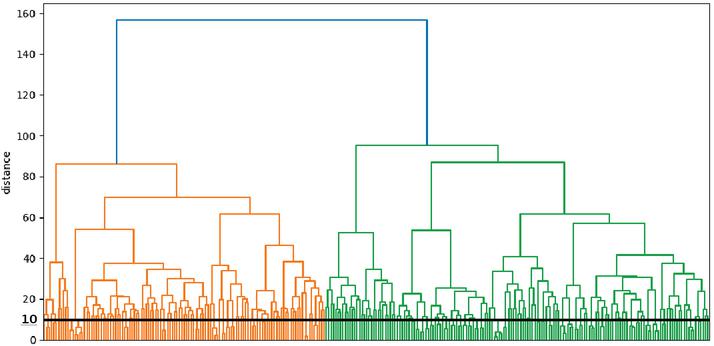
Figure 6 Dendrogram for analysis of 281 onions with threshold line at distance 10.
6.3 Data Categorization
In order to perform a valuable evaluation, a labeled data set is required. This is labeled by ourselves, because no data is available for a ground truth analysis. The labeled sets for evaluation consists of three labeled types of comparison sets. These sets are obtained by manually validating the comparisons and the resulting cluster from the previous analysis. The validation is done by a manual visual inspection. To support the visual inspection of the onions, the resulting dendrogram is used. With manually set thresholds, classes can be generated which supports the search for similar or even identical onions, as shown in Figure 6.
The first set consists of comparisons of onions that are duplicates or that nearly look the same and are therefore called Same. That means a same appearance with identical elements, colors, text and layout on the web page. With this set a removal of duplicates in our data set is possible. The second set consists of comparisons of onions, that are visibly similar in structure or in content. This set is called Similar. During the manual visual inspection of the onions, attention was paid to clear characteristics, such as clear similarities in layout, the use of the same icons or dimensions of buttons or tables. Examples occurred where the content is the same and the layout was only slightly changed or only the content of a page was replaced as shown in Figure 7 and in Figure 8. The third set Dissimilar contains all comparisons which are not in Same and Similar. With this method, 82 comparisons were made for the set Same, 292 comparisons for the set Similar and 38,966 comparisons for the set Dissimilar.

Figure 7 Example onions for similar layout but different content.

Figure 8 Example of onions for same content and slightly different layout.
6.4 Comparison between the Sets Same, Similar and Dissimilar
In order to see if our method works correctly, the resulting similarity values of the three sets are analyzed by using boxplots. An indicator that the method works correctly are values between zero and one, depending on the intended purpose.
The boxplots of Figure 9 shows that there are no overlapping of the boxes between the sets. The boxes each represent 50 percent of the data. The comparisons of the set Same have high values, with a median value of 0.84, and the comparisons of the set Similar have lower values, with a median value of 0.62. For the Dissimilar set the values are far below with a median value of 0.37. This indicates that the resulting similarity values, which are between zero and one, can also determine the similarity of the onions well.
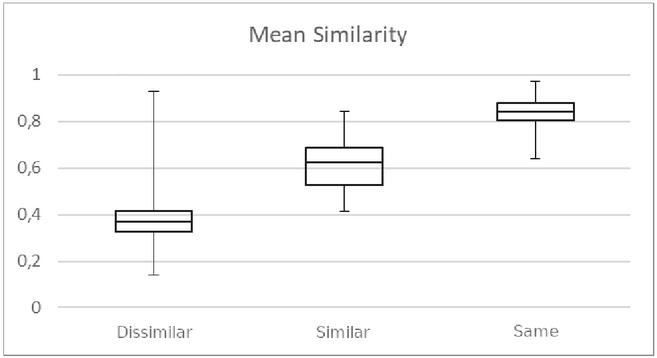
Figure 9 Comparison boxplot of the mean similarity of Dissimilar, Similar and Same.
6.5 Identifying Important Features for Similarity Determination
The aim is to find important features where the resulting similarity value is decisive for the classification into the three sets Same, Similar and Dissimilar. A decision tree classifier is applied to determine the strength of the features to differentiate the sets. Decision trees can be unstable because small changes in the data can change the tree significantly. Therefore, only part of rules are used as a basis for feature weighting, which divides a large number of samples into groups. In order to accomplish this, the decision tree classifier CART is used for Decision Tree creation and the Gini Importance is used as a criterion for an important feature. In order to prevent overfitting, the tree is pruned to a depth of four [9].
The CART classifier is applied twice: firstly, for the extraction of important features between the union of the sets Same and Similar versus the set Dissimilar. This step is to determine which features distinguish well between similar and dissimilar onions. Secondly, a decision tree is applied for the set Same versus the set Similar. Thus, features can be extracted that can distinguish well between duplicates and similar pages.
Features to distinguish between Same/Similar and Dissimilar
Applying a decision tree shows how the features HTML-Tag, HTML-Class, File Content, but also Links To can significantly separate a large number of comparisons between the Same/Similar set from the Dissimilar set. The individual feature importance values are shown in the bar chart in Figure 10. Not quite as decisive but still worth mentioning are the features Sentence Length and Open Ports. With a very low importance, the features Vocabulary Richness, Public Key and Server Information were listed.
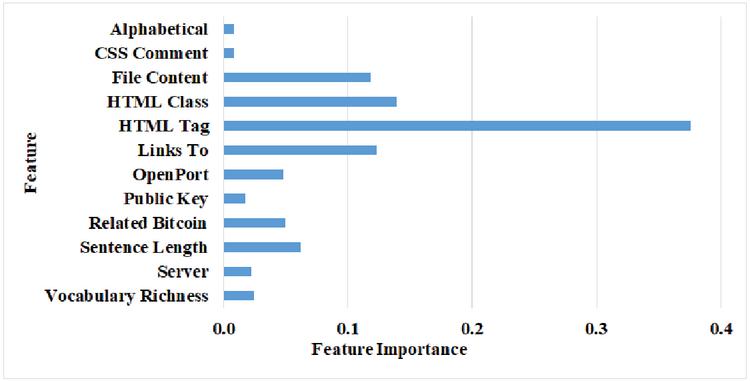
Figure 10 Feature importance of features for decision tree between the sets same/similar and dissimilar.
Features to distinguish between Same and Similar
The feature 50 Most Common can detect the difference between the onions in the sets Same and Similar very well, as shown in Figure 11. With a much lower importance the features HTML-Tree, Sentence Length and File Content which are also have small importance in the previous decision tree, can separate the comparisons.
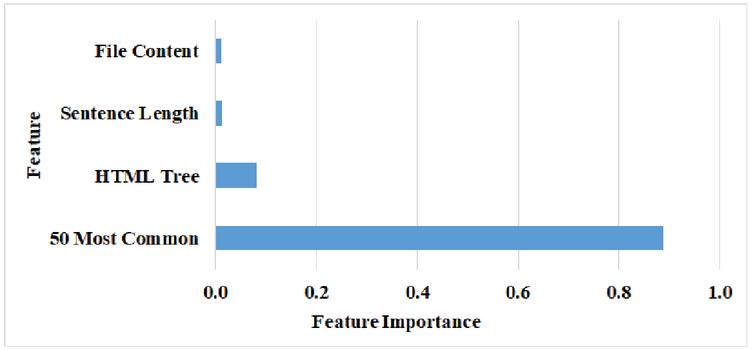
Figure 11 Feature importance of features for decision tree between the sets same and similar.
7 Discovered Insights in Relation to Vendor Onions
In the following, insights from the analysis with our method of the 258 single vendor onions are explained.
7.1 Weighted Features
The structure features HTML-Tag, HTML-Class and HTML-DOM-Tree as well as the metadata features Open Ports and File Content have proven to be most important and can highlight similarities of onions very effectively. Each of these features had a good distribution of similarity values and showed high Feature Importance values in the decision trees. These features can be weighted higher in further analyses. The features Links To, Sentence Length and 50 Most Common also had high values for Feature Importance.
The features Google Analytics ID and Google Publisher ID could not be analyzed because there was only one vendor onion in the entire data set that contained these features. The features Private Key and IPv6 did not occur in any of the examined onions.
In a repeated analysis of the vendor onions set with weighted features, further insights could be obtained. The weighting of the features led to the fact that the distances between the clusters of similar ones decrease. The resulting dendrogram is shown in Figure 12.
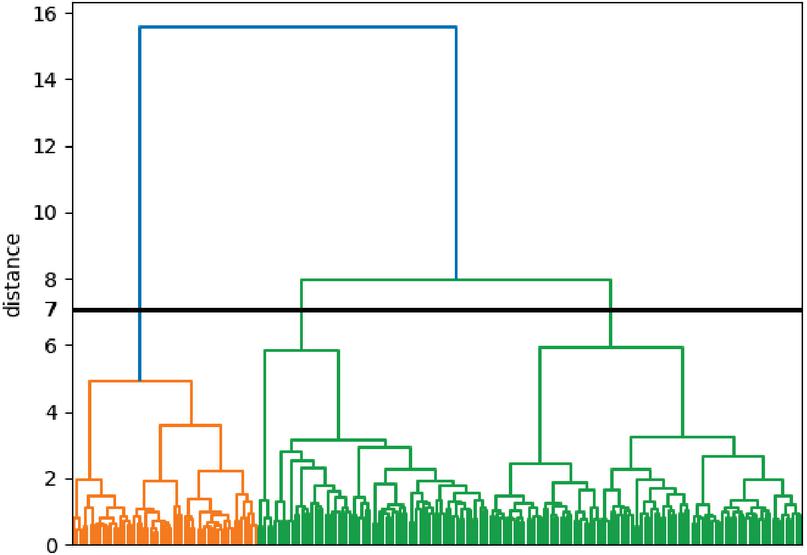
Figure 12 Dendrogram with weighted features.
7.2 Distribution of Vendor Onions
With our method it was possible to detect 23 onions from 281 that had no content or were not vendor onions. These were removed from the set, leaving only 258 vendor onions. A total of 52 (20%) onions could be classified as duplicates of other onions. These might be double-hosted, mirrored or possibly scam onions. For 126 (49%) other onions no similar onions could be found. In contrast, 80 (31%) vendor onions could be assigned by their similarity to 7 groups. In some cases, operators own several onions that offer goods from different sales categories, such as the sale of smartphones, gift cards and cannabis. The distribution between the onions of the similarity groups and the unique vendor sites is shown in Figure 13. The percentages in the figure refer to the set of 258 vendor onions.

Figure 13 Pie chart for vendor onions assigned to similarity groups, unique vendor sites and their duplicates.
7.3 Hosting Provider for Vendor Onions
The research identified similarity groups to which only a few similar vendor onions could be assigned. For example, in one group, one onion deals with the sale of mobile phones and the other onions deal with the sale of gift cards.
However, one group could be identified, to which much more could be assigned. Figure 13 shows a group of 54 vendor onions (Similarity Group 1). This group could also be divided into five smaller groups. However, the similarity in this large group of 54 vendor onions is significantly high and the changes of the onions in this groups are only minor. During a research for these onions, an operator was found, which offers to develop and host vendor onions in the Tor-network. Buyers can choose one of several website layouts on which to base the desired one. A hosted onion can be purchased for prices between $100 and $500, according to the operator. Features like an integrated bitcoin wallet, message center, daily backups and even a sub-forum are available.
To further show how much this large group differs from the rest, we compare this large group to two other clusters. The clusters arise when a threshold is set at distance 7 in the dendrogram shown in Figure 12. For these three clusters we compare their internal similarity, as shown in Figure 14. Significantly higher average final similarity values were found for cluster 1. This is the Similarity Group 1 that contains the 54 onions that could come from the same hosting provider. This shows how much these onions really stand out from the others. If these onions in fact came from the same operator, that would be 26 percent, with a total of 206 vendor onions without duplicates.
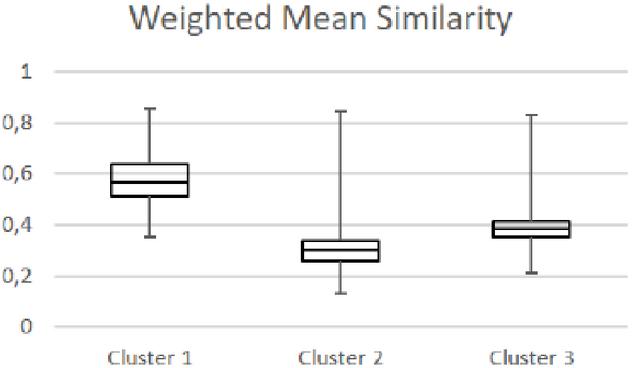
Figure 14 Similarity of 3 clusters with weighted features.
8 Discussion and Limitations
The object of this paper was to develop a method to discover possible operational structures between single-vendor marketplaces in the Tor-network. Because no labeled data were available for a ground truth analysis and its features, the three sets of comparisons Same, Similar and Dissimilar have been determined with the help of the method and a manual validation. Based on these sets, decision tree classifiers were used to detect features with a high degree of distinctness.
Using the results in Section 7, it was found that 31% of 258 single-vendor marketplaces are assigned to 7 similarity groups. Due to the high similarities of the onions of the respective group, the onions must be in conjunction with one another. This means that few operators have a very large market share if the respective onions of a similarity group are provided by one or a few operators. It could imply that the offer is lower. In addition, 20% of all vendor onions can be declared as duplicates, so that the offer is again significantly lower. The findings on the basis of the data set let the offer on the darknet appear quite small.
Limitations
One point is the use of a self-labeled data set for evaluation. These could lead to distorted results in the analysis of feature comparison methods. It is almost impossible to know if onions in the Tor-network belong together, but a set of labeled websites from the clearnet could serve as a basis for a better analysis. The Dissimilar set contains 38,966 comparisons, while the Similar set contains only 292 and the Same set contains 82 comparisons. For descriptive statistical characteristics, this could also be an unfair comparison. The fourth quartile of Dissimilar alone contains 9,741 comparisons, 33 times more than in Similar. Nevertheless, the comparisons between Same and Similar have been good for first analysis.
Another current limitation is the exponential increase of the computation time if a large amount of onions is compared to each other. Comparisons between more than 10,000 onions become impractical. A remedy could be a fingerprinting system or an assignment to existing clusters. Both methods could save computational time. The use of the features from this work could form a basis for this.
9 Conclusion
We presented a concept for a method to discover similarities of single-vendor marketplaces in the Tor-network. The method supports the detection of possible structures or duplicates by identifying similarities between onions. These onions were clustered to allow extraction of groups that may have a high degree of similarity between them. It is not only limited to vendor onions, it can also be used to discover structures in other types of onions in the Tor-network. Our method extracted from the vendor onions different features of the categories “content-based”, “structure” and “metadata” to determine the similarity values. Using a self-labeled data set, features with a good distribution of their similarity values were evaluated. The features that showed a correspondingly high degree of distinctness, extracted using decision trees – especially the Gini Importance – are considered to be effective. The features from the category structure HTML-Tag, HTML-Class and HTML-DOM-Tree, metadata features File Content, Open Ports and Links To as well as the lexical features Sentence Length and 50 Most Common have proven to be particularly important and can very effectively highlight similarities between onions.
Our results show that 20% of 258 analyzed single-vendor onions are duplicates. Only 49% of all vendor onions could be assigned as unique single-vendor sites. 31% of all analyzed onions are assigned to seven similarity groups. This means that only a few operator groups have a very large market share. The presence of single-vendor onions is quite high due to their number, but the actual offer is much smaller. If the uncertainty of their offer is also taken into account, it can be assumed that the offer on the darknet will be significantly lower than expected.
Acknowledgment
The joint project PANDA on which this publication is based was funded by the Federal Ministry of Education and Research under the funding codes 13N14355 and 13N14356. The authors are responsible for the content of this publication.
Footnote
1. scikit-learn, DecisionTreeClassifier, https://scikit-learn.org/stable/modules/generated/ sklearn.tree.DecisionTreeClassifier.html, (Accessed on 21.11.2020)
2. Beautiful Soup Tool Homepage, https://www.crummy.com/software/BeautifulSoup/, (Accessed on 27.10.2020).
3. NLTK 3.5 Documentation, https://www.nltk.org/, (Accessed on 27.10.2020).
4. lxml – XML and HTML with Python, https://lxml.de/, (Accessed on 27.10.2020).
References
[1] Mhd Wesam Al-Nabki, Eduardo Fidalgo, Enrique Alegre, and Laura Fernández-Robles. Torank: Identifying the most influential suspicious domains in the tor network. Expert Systems with Applications, 123: 212–226, 2019.
[2] Monica Bianchini, Marco Gori, and Franco Scarselli. Inside PageRank. ACM Transactions on Internet Technology, 5(1):92–128, 2005.
[3] Alex Biryukov, Ivan Pustogarov, Fabrice Thill, and Ralf-Philipp Weinmann. Content and popularity analysis of tor hidden services. In 2014 IEEE 34th International Conference on Distributed Computing Systems Workshops (ICDCSW), pages 188–193. IEEE, 2014.
[4] Fabian Brenner, Florian Platzer, and Martin Steinebach. Discovery of single-vendor marketplace operators in the tor-network. In The 16th International Conference on Availability, Reliability and Security, pages 1–10, 2021.
[5] Julian Broséus, Damien Rhumorbarbe, Marie Morelato, Ludovic Staehli, and Quentin Rossy. A geographical analysis of trafficking on a popular darknet market. Forensic Science International, 277:88–102, 2017.
[6] David Buttler. A short survey of document structure similarity algorithms. Proceedings of the International Conference on Internet Computing, IC’04, 1:3–9, 2004.
[7] Guangyu Chen and Ben Choi. Web page genre classification. Proceedings of the ACM Symposium on Applied Computing, pages 2353–2357, 2008.
[8] Ian Clarke, Oskar Sandberg, Matthew Toseland, and Vilhelm Verendel. Private communication through a network of trusted connections: The dark freenet. Network, 2010.
[9] Jürgen Cleve and Uwe Lämmel. Data Mining. De Gruyter Oldenbourg, 2014.
[10] Isabel F. Cruz, Slava Borisov, Michael A. Marks, and Timothy R. Webb. Measuring structural similarity among web documents: Preliminary results. Lecture Notes in Computer Science (including subseries Lecture Notes in Artificial Intelligence and Lecture Notes in Bioinformatics), 1375:513–524, 1998.
[11] Edwin Dauber, Aylin Caliskan, Richard Harang, Gregory Shearer, Michael Weisman, Frederica Nelson, and Rachel Greenstadt. Git Blame Who?: Stylistic Authorship Attribution of Small, Incomplete Source Code Fragments. Proceedings on Privacy Enhancing Technologies, 2019(3):389–408, jul 2019.
[12] Kai Denker, Marcel Schäfer, and Martin Steinebach. Darknets as tools for cyber warfare. In Information Technology for Peace and Security, pages 107–135. Springer, 2019.
[13] Roger Dingledine, Nick Mathewson, and Paul Syverson. Tor: The second-generation onion router. SSYM’04 Proceedings of the 13th conference on USENIX Security Symposium, 13:21, 2004.
[14] Romain Espinosa. Scamming and the reputation of drug dealers on Darknet Markets. International Journal of Industrial Organization, 67, 2019.
[15] Oana Goga, Howard Lei, Sree Hari Krishnan Parthasarathi, Gerald Friedland, Robin Sommer, and Renata Teixeira. Exploiting innocuous activity for correlating users across sites. WWW 2013 – Proceedings of the 22nd International Conference on World Wide Web, pages 447–457, 2013.
[16] A. D. Gordon, L. Breiman, J. H. Friedman, R. A. Olshen, and C. J. Stone. Classification and Regression Trees. Biometrics, 40(3):874, sep 1984.
[17] Ramzi A Haraty and Bassam Zantout. I2P Data Communication System Damage Assessment and Recovery from Malicious Attacks for Defensive Information Warfare View project High-Performance and Accurate Mathematical Solvers in Hardware View project I2P Data Communication System. 2002.
[18] Thanh Nghia Ho and Wee Keong Ng. Application of stylometry to DarkWeb forum user identification. In Lecture Notes in Computer Science (including subseries Lecture Notes in Artificial Intelligence and Lecture Notes in Bioinformatics), volume 9977 LNCS, pages 173–183. Springer Verlag, 2016.
[19] Ankit Kumar Jain and B. B. Gupta. Phishing detection: Analysis of visual similarity based approaches. Security and Communication Networks, 2017(i), 2017.
[20] Jane Yung jen Hsu and Wen tau Yih. Template-based information mining from HTML documents. Proceedings of the National Conference on Artificial Intelligence, pages 256–262, 1997.
[21] Min Hyung Lee, Yeon Seok Kim, and Kyong Ho Lee. Logical structure analysis: From HTML to XML. Computer Standards and Interfaces, 29(1):109–124, 2007.
[22] Michael Levandowsky and David Winter. Distance between sets. Nature, 234(5323):34–35, 1971.
[23] Chul Su Lim, Kong Joo Lee, and Gil Chang Kim. Multiple sets of features for automatic genre classification of web documents. Information Processing and Management, 41(5):1263–1276, 2005.
[24] Gilles Louppe, Louis Wehenkel, Antonio Sutera, and Pierre Geurts. Understanding variable importances in Forests of randomized trees. Advances in Neural Information Processing Systems, pages 1–9, 2013.
[25] Steve Mansfield-Devine. Darknets. Computer Fraud and Security, 2009(12):4–6, 2009.
[26] Mhd Wesam Al Nabki, Eduardo Fidalgo, Enrique Alegre, and Ivan De Paz. Classifying illegal activities on tor network based on web textual contents. In 15th Conference of the European Chapter of the Association for Computational Linguistics, EACL 2017 – Proceedings of Conference, volume 1, pages 35–43, 2017.
[27] Gareth Owen and Nick Savage. Empirical analysis of tor hidden services. IET Information Security, 10(3):113–118, 2016.
[28] Mateusz Pawlik and Nikolaus Augsten. Tree edit distance: Robust and memory-efficient. Information Systems, 56:157–173, 2016.
[29] Florian Platzer, Marcel Schäfer, and Martin Steinebach. Critical traffic analysis on the tor network. In Proceedings of the 15th International Conference on Availability, Reliability and Security, pages 1–10, 2020.
[30] Ramyaa, Congzhou He, and Khaled Rasheed. Using machine learning techniques for stylometry. Proceedings of the International Conference on Artificial Intelligence, IC-AI’04, 2:897–903, 2004.
[31] Angelo P.E. Rosiello, Engin Kirda, Christopher Kruegel, and Fabrizio Ferrandi. A layout-similarity-based approach for detecting phishing pages. Proceedings of the 3rd International Conference on Security and Privacy in Communication Networks, SecureComm, pages 454–463, 2007.
[32] Dennis Shasha, JT-L Wang, Kaizhong Zhang, and Frank Y Shih. Exact and approximate algorithms for unordered tree matching. IEEE Transactions on Systems, Man, and Cybernetics, 24(4):668–678, 1994.
[33] Martijn Spitters, Femke Klaver, Gijs Koot, and Mark Van Staalduinen. Authorship Analysis on Dark Marketplace Forums. In Proceedings – 2015 European Intelligence and Security Informatics Conference, EISIC 2015, pages 1–8. Institute of Electrical and Electronics Engineers Inc., jan 2016.
[34] Martijn Spitters, Stefan Verbruggen, and Mark Van Staalduinen. Towards a comprehensive insight into the thematic organization of the tor hidden services. In 2014 IEEE Joint Intelligence and Security Informatics Conference, pages 220–223. IEEE, 2014.
[35] Efstathios Stamatatos. A survey of modern authorship attribution methods. Journal of the American Society for Information Science and Technology, 60(3):538–556, mar 2009.
[36] Martin Steinebach. File-sharing and the darknet. In Encyclopedia of Criminal Activities and the Deep Web, pages 165–176. IGI Global, 2020.
[37] Martin Steinebach, Marcel Schäfer, Alexander Karakuz, and Katharina Brandl. Detection and Analysis of Tor Onion Services. Journal of Cyber Security and Mobility, 9(1):141–174, 2020.
[38] Martin Steinebach, Marcel Schäfer, Alexander Karakuz, Katharina Brandl, and York Yannikos. Detection and analysis of tor onion services. In Proceedings of the 14th International Conference on Availability, Reliability and Security, pages 1–10, 2019.
[39] Martin Steinebach, Sascha Zenglein, and Katharina Brandl. Phishing detection on tor hidden services. Forensic Science International: Digital Investigation, 36:301117, 2021.
[40] Jiří Štěpánek and Monika Šimková. Comparing Web Pages in Terms of Inner Structure. Procedia – Social and Behavioral Sciences, 83:458–462, 2013.
[41] Xiao Hui Tai, Kyle Soska, and Nicolas Christin. Adversarial matching of dark net market vendor accounts. Proceedings of the ACM SIGKDD International Conference on Knowledge Discovery and Data Mining, pages 1871–1880, 2019.
[42] Anastasios Tombros and Zeeshan Ali. Factors affecting Web page similarity. Lecture Notes in Computer Science, 3408:487–501, 2005.
[43] Vedrana Vidulin, M Lustrek, and M Gams. Multi-Label Approaches to Web Genre Identification. Jlcl, 24(1):97–114, 2009.
[44] Xiangwen Wang, Gang Wang, Michel J Pleimling, and Danfeng Yao. Photo-based Vendor Re-identification on Darknet Marketplaces using Deep Neural Networks. 2018.
[45] Daniel Watson. Source Code Stylometry and Authorship Attribution for Open Source. 2019.
[46] Jessica Wood. The Darknet: A Digital Copyright Revolution. Richmond Journal of Law and Technology, 16(4):14, 2010.
[47] Yudong Yang and Hong Jiang Zhang. HTML page analysis based on visual cues. Proceedings of the International Conference on Document Analysis and Recognition, ICDAR, 2001-Janua(49):859–864, 2001.
[48] York Yannikos, Quang Anh Dang, and Martin Steinebach. Comparison of cyber attacks on services in the clearnet and darknet. In IFIP International Conference on Digital Forensics, pages 39–61. Springer, 2021.
[49] York Yannikos, Julian Heeger, and Maria Brockmeyer. An analysis framework for product prices and supplies in darknet marketplaces. In Proceedings of the 14th International Conference on Availability, Reliability and Security, pages 1–7, 2019.
[50] York Yannikos, Annika Schäfer, and Martin Steinebach. Monitoring product sales in darknet shops. ACM International Conference Proceeding Series, 2018.
[51] Kaizhong Zhang and Dennis Shasha. Simple fast algorithms for the editing distance between trees and related problems. SIAM Journal on Computing, 18(6):1245–1262, 1989.
[52] Yiming Zhang, Yujie Fan, Liang Zhao, Wei Song, Shifu Hou, Chuan Shi, Yanfang Ye, Xin Li, Jiabin Wang, and Qi Xiong. Your style your identity: Leveraging writing and photography styles for drug trafficker identification in darknet markets over attributed heterogeneous information network. The Web Conference 2019 – Proceedings of the World Wide Web Conference, WWW 2019, pages 3448–3454, 2019.
Biographies

Florian Platzer is a research assistant at the Fraunhofer Institute for Secure Information Technology. He is part of the PANDA project at Fraunhofer SIT. The PANDA project is an interdisciplinary project researching the darknet. Within this project he is responsible for the computer science part. Florian studied IT security at the Technical University of Darmstadt, Germany. He wrote his master thesis about deanonymization of Tor hidden services.

Fabian Brenner was a former auxiliary scientist at the Fraunhofer Institute for Secure Information Technology. He wrote his master’s thesis in the area of darknet and its marketplaces in the institute’s Panda project in 2020. Fabian studied IT security at the Technical University of Darmstadt and currently works as a penetration tester at a consulting company.

Martin Steinebach is the manager of the Media Security and IT Forensics division at Fraunhofer SIT. From 2003 to 2007 he was the manager of the Media Security in IT division at Fraunhofer IPSI. He studied computer science at the Technical University of Darmstadt and finished his diploma thesis on copyright protection for digital audio in 1999. In 2003 he received his PhD at the Technical University of Darmstadt for this work on digital audio watermarking. In 2016 he became honorary professor at the TU Darmstadt. He gives lectures on Multimedia Security as well as Civil Security. He is Principle Investigator at ATHENE and represents IT Forensics and AI security. Before he was Principle Investigator at CASED with the topics Multimedia Security and IT Forensics. In 2012 his work on robust image hashing for detection of child pornography reached the second rank “Deutscher ITSicherheitspreis”, an award funded by Host Görtz.
Journal of Cyber Security and Mobility, Vol. 11_2, 205–238.
doi: 10.13052/jcsm2245-1439.1124
© 2022 River Publishers