Can We Detect Malicious Behaviours in Encrypted DNS Tunnels Using Network Flow Entropy?
Yulduz Khodjaeva*, Nur Zincir-Heywood and Ibrahim Zincir
Faculty of Computer Science, Dalhousie University, Canada
Faculty of Engineering, Izmir University of Economics, Turkey
E-mail: yulduz.khodjaeva@dal.ca; zincir@cs.dal.ca; ibrahim.zincir@ieu.edu.tr
*Corresponding Author
Received 01 April 2022; Accepted 14 May 2022; Publication 14 August 2022
Abstract
This paper explores the concept of entropy of a flow to augment flow statistical features for encrypted DNS tunnelling detection, specifically DNS over HTTPS traffic. To achieve this, the use of flow exporters, namely Argus, DoHlyzer and Tranalyzer2 are studied. Statistical flow features automatically generated by the aforementioned tools are then augmented with the flow entropy. In this work, flow entropy is calculated using three different techniques: (i) entropy over all packets of a flow, (ii) entropy over the first 96 bytes of a flow, and (iii) entropy over the first n-packets of a flow. These features are provided as input to ML classifiers to detect malicious behaviours over four publicly available datasets. This model is optimized using TPOT-AutoML system, where the Random Forest classifier provided the best performance achieving an average F-measure of 98% over all testing datasets employed.
Keywords: DNS over HTTPS, Entropy, Cybersecurity, machine learning, tunneling attacks.
1 Introduction
DNS is the Internet’s hierarchical, distributed database system that translates the Internet Protocol (IP) addresses to Domain names, and vice versa. Recently, this core network functionality has been facing pressure for change. Specifically, two aspects are of particular relevance: DNS over HTTPS (DoH) and DNS over TLS (DoT). The objective is to secure communications between the DNS resolver residing on the end user’s system and their chosen recursive resolver. DoH achieves this by embedding DNS query into a Secure HyperText Transfer Protocol (HTTPS) request/response, while DoT achieves this over the Transport Layer Security (TLS over TCP) protocol [47, 41, 18]. DoT protocol uses new TCP port number 853, and DoH blends into HTTPS traffic, sharing the same port. Thus, managing DoH traffic seems to get more challenging [19]. New protocols potentially imply that significant changes will result in web and domain name mapping services. These new versions will change connection management layer, as well as changing the nature of traffic and application behaviours. Moreover, with DoH, the entire Internet ‘threads’ through the ‘eye’ of HTTPS. As a consequence, traditional ways of analyzing network and application data for cyber security, network operations and management using metadata, port or payload may no longer be possible [45, 40, 36].
In particular, DoH has been advocated to provide user privacy and security by encrypting the data between the DoH client and the DoH-based DNS resolver. As a consequence, it is argued that the risk of DNS data manipulation substantially decreases. What seemed to be a quite promising and effective solution at the very start, later gained a lot of criticism among the researchers, who claimed that DoH makes DNS tunnels harder to detect and mitigate. This specifically affects the detection of malicious (attack) behaviours that exfiltrate data through DNS tunnelling. DNS protocol, which works with plain text for its data transmission, allows organizations to monitor DNS traffic by observing DNS queries. Once the data gets encrypted, threat analysis based on the plain text content of DNS queries becomes an obsolete tool for network security specialists. The features extractable from DNS queries, like domain name, record type, unique query ratio, query volume and length would be encrypted in DoH leaving only IP address, port number and timestamp in plaintext form [19]. The feeling of worry builds up with an overall increase in encrypted traffic. According to statistics provided by Google [10], 95% of web data across its platforms undergoes HTTPS encryption. This includes advertising, Google Calendar, Google Drive, Gmail, Google Maps and YouTube. Additionally, operating systems (macOS, iOS and Windows etc.) and web browsers (Google Chrome, Microsoft Edge, Mozilla Firefox and Opera etc.) have been supporting DoH and DoT protocols. Given that a form of encryption is applied in this newly established protocol, attackers can leverage DoH for attacking purposes. It is also well known that DNS and its plaintext nature remains highly vulnerable to amplification attacks, DNS cache poisoning, botnet attacks, phishing attacks and DNS manipulation [35]. Due to these security issues, it is important to detect attack tunnels in DNS traffic.
Taking all these factors into account, researchers have started to explore host-based and network-based monitoring for DoH protocol analysis [30]. To this end, some recent works have evaluated the use of Machine Learning (ML), entropy, and network packet distribution-based approaches for analyzing tunnelling and exfiltration attacks over DNS [43, 21, 49, 34]. While some of these works focus on using DNS-specific attributes, others use traffic or malware-specific attributes. In this paper, we extend and optimize our proposed concept of entropy of a network flow in order to detect attack behaviours in DoH tunnels. Even though previous works [26, 32] have employed entropy for summarizing network packet distributions, to the best of our knowledge, this is the first work studying and optimizing the detection of attack DNS tunnels using entropy in the context of network flows. To this end, the usability of AutoML tools, namely TPOT, for optimizing the DoH tunnelling classification is explored. TPOT is a Python-based ML tool that was developed in 2016 with a core objective of optimizing ML pipelines using Genetic Programming [7]. Considering thousands of pipeline configurations based on the dataset provided, TPOT automates the most tedious and time-consuming part of ML. Based on the current literature studied, using the TPOT-AutoML toolset for malicious DNS traffic detection is the first of its nature being reported. Thus, the novelty and the new contributions of this work are summarized as the following:
• Exploring the use of flow entropy characteristic to augment statistical features of network traffic flows for identifying attack DoH tunnels;
• Exploring the minimum number of packets required to calculate entropy per traffic flow without decreasing performance or increasing complexity of the identification of attack DoH tunnels;
• Exploring the optimization of the proposed approach in terms of complexity and performance to detect attack DoH tunnelling behaviours using the TPOT-AutoML tool.
The rest of this paper is organized as follows: Section 2 summarizes the related literature while Section 3 discusses the methodology used in this research. Experiments performed and the results obtained are presented in Section 4. Finally, conclusions are drawn and the future research is discussed in Section 5.
2 Literature Review
Detection of attacks by analyzing network traffic has become one of the most widely researched areas in the cybersecurity. Scientists have been proposing state-of-the-art Intrusion Detection Systems (IDS) and carrying out experiments to analyze malicious activities. In the following, we summarize the works from the literature focusing on attack DNS (DoH) tunnelling behaviours.
2.1 DNS Traffic Analysis
In [22], Das et al. proposed ML algorithms to detect DNS channel exploitation, a possible alternative for traditional detection mechanisms like blacklists or signature-based methods. An application of a ML-based system was designed for internal network enterprise. They proposed an end-to-end system to identify exfiltration and tunnelling activity based on internal packet data. They collected network traffic of an enterprise for 39 days, containing no attacks. For exfiltration data, they had to synthesize it artificially, with three sets using base64, base32 and hex on random strings and one set using base64 on credit card numbers. Once the dataset was generated and labelled, they calculated features like normalized entropy of the concatenated string, length of the string, the ratio of uppercase and lowercase letters in the string and so on. In total they employed eight features into the Logistic Regression (LR) classifier and demonstrated an F1-measure of 96% at its peak.
In [32], Ahmed et al. aimed to detect DNS exfiltration and tunnelling behaviour from enterprise networks by performing real-time analysis of DNS queries. They collected DNS traffic from two enterprise networks, a medium-sized research institute and a large university campus, injected a million attack DNS queries. They identified three features: the entropy of a query string, character count, and length of discrete labels in the query name that primarily helped to distinguish attack DNS queries from benign ones. They input these features extracted from queries into the Isolation Forest, an unsupervised learning algorithm. Performing fine-tuning during the training phase, they achieved 95% accuracy for attack and 98% accuracy for benign classes on the test datasets. Since detection of DNS exfiltration and tunnelling was done in real-time, they also presented the average time complexity of the proposed methodology, demonstrating that 800 sec was enough per each query name.
In [21], Campbell et al. used Self-Organizing Feature Maps (SOMs) to identify DNS tunnelling and exfiltration activities. They also used an unsupervised learning approach using network traffic packets. They represented DNS packets as query strings and extracted features, which were then used to train SOMs to cluster DNS tunnelling, exfiltration and normal behaviours. Three publicly available datasets were used for representing benign behaviour, while publicly available tools like DNScat2, DET, DNSTunnel and DNSteal were used to generate tunnelling and exfiltration attacks. They employed eight features from query strings for identifying exfiltration attacks, and ten features for identifying tunnelling attacks. They were able to separate malcious behaviours from normal behaviours with an F-measure of 99% on test datasets.
In [38] Lambion et al. deployed Random Forest (RF) and Convolutional Neural Network (CNN) supervised learning algorithms to detect DNS tunnelling in real-time. They created a dataset consisting of real-time DNS data, collected from subscribers including Internet Service Providers, schools and businesses. For each instance in a dataset, 5-tuple information was gathered: query name, query type, IP address, query time and date. A label for each instance was provided as well: “non-tunnelling traffic”, “normal resolved”, and “DNS tunnel”. Since only a limited amount of data can be tunnelled within each query name, data exfiltration was done over multiple queries combined. Hence, they grouped queries with the same metadata. CNN classifier was trained together with majority voting to label a group of DNS queries, while RF classifier was trained to classify entire groups of DNS queries. 11 features were used for classification. Their results showed 96% accuracy for RF and 99% accuracy for CNN classifiers.
Over the last decades, security experts have been questioning the security of the DNS protocol. As a solution, DNS over TLS and DNS over HTTPS protocols have been proposed. DoT is an Internet Engineering Task Force (IETF) standard using TLS encryption and authentication between a DNS client and a DNS server. Functioning at the operating system level, it communicates over TCP port 853. Whereas, DoH leverages HTTPS for encryption and authentication between a DNS client and server. DoH shares TCP port 443 with HTTPS traffic, and unlike DoT, it is implemented at the application layer, creating room for browser traffic to bypass enterprise DNS control.
Montazeri et al. presented a two-layered approach to detect and characterize DoH traffic using time-series classifiers [43]. In the first layer, traffic was classified into DoH and Non-DoH, while in the second layer characterization of DoH into benign and attack took place. They extracted 28 statistical features of DoH flows, using a tool called DoHMeter [4]. Statistical features included parameters such as the number and rate of flow bytes sent / received, packet length, packet time, etc. They employed six ML classifiers at both layers and achieved an F-measure of 99% with Random Forest (RF) and Decision Tree (DT) classifiers. They generated benign and attack DoH as well as Non-DoH traffic within their network premises, identifying every flow of encrypted network traffic by using tuple source IP, destination IP, source port, destination port, protocol. The dataset was made publicly available at [2].
Following this, Singh et al. applied several ML classifiers to detect attack activity in DoH and traditional DNS traffic [49]. They studied DoH security risks since DoH bypassed local security measures such as Firewalls and IDSs. They also used DoHMeter to extract statistical features from the publicly available DoH dataset [2] and employed five ML classifiers. It should be noted here that they applied the same 28 features as in [43]. So, their results also showed that RF achieved an F-measure of 99% on their datasets.
Moreover, Behnke et al. [15] compared the performance of ten ML classifiers using ten-fold cross-validation on DoHBrwDataset [2]. They also used DoHMeter [4] to extract statistical and time-series features and applied Chi-Square and Pearson Correlation Coefficient (PCC) tests to address the overfitting problem. As a result, instead of 28 features, 21 were used for a classification task. The results showed almost 0% misclassification error for Light Gradient Boosting Machine (LGBM), Extreme Gradient Boosting Machine (XGBM), RF, and DT classifiers. They also considered training and prediction time, where LGBM was the fastest model, with training time around 87 seconds for Layer-1.
Lastly, Raghav et al. discussed detection of DoH tunnelling by using a set of ML algorithms in [46]. They deployed a packet sniffer on their local PC to capture the packets of every connection layer transfer sent and received by the PC. Once the dataset was collected, they deployed Scapy to group packets into flows. They extracted 34 features for each flow (it is interesting to note that features extracted by Scapy-based script were similar to features extracted by DoHlyzer tool in [43, 3]). To reduce the training time of the classification model, They applied Gini index [9] to identify the most suitable features. Then, they used LR, KNN, SVM, and RF classifiers, where RF achieved 99% accuracy.
2.2 Using Entropy for DNS Traffic Analysis
In previous works, cybersecurity specialists have studied the use of entropy features to detect malicious behaviours in DNS and other network traffic. In [42], Mejri et al. used packet entropy to identify Denial Of Service (DOS) attacks on Vehicular Adhoc Networks (VANETs). Packets, circulating within the network, were categorized into four types: DATA, ACK, RTS and CTS. Then, entropy values of DATA and ACK packets are calculated. Comparing entropy value results of different scenarios, they showed that higher entropy of packets corresponded to normal VANET behaviours.
In [21], Campbell et al. also used packet entropy features to detect different behaviours in the traffic. They extracted eight features from DNS queries, including normalized entropy of concatenated string to detect DNS exfiltration. A similar method was undertaken for DNS tunnelling detection, where entropy was among the ten features derived from DNS queries.
On the other hand, Aung et al. studied the entropy value of NAN characters present in Uniform Resource Locator (URL) strings for phishing detection [13]. Augmenting entropy value with previously proposed 10 features, i.e. IP address, age of the domain, port number, etc, they used a RF classifier. Despite significant improvements in accuracy when applying entropy, they also reported high False Positive Rates in all experiments.
In [51], Zhou et al. worked with entropy-related features to detect spam emails using gcForest learning algorithm. They used three features for spam detection: entropy of subject size of sent mails, the entropy of content size of sent mails and the ratio of received mails to the sent mails. They collected a mail dataset at a border network of a province in China for 34-days. Once the dataset was collected, they ran three classifiers on their data: ALAC, SVM and gcForest. Results showed spam detection rates over 90% for all three classifiers at the source network.
2.3 Optimization Using TPOT-AutoML
In [44], Olson et al. implemented an open-source tool, namely TPOT, using Python library and presented the tool’s efficiency by testing it on a series of simulated and real-world benchmark datasets. The main reason behind developing TPOT was to make ML a more accessible, scalable and flexible toolbox for the research community. To demonstrate TPOT’s efficiency, they chose classification datasets from the well-known UC-Irvine Machine Learning Repository [24]. They evaluated all data using TPOT and showed that the larger the dataset the better the optimization of the classifiers works using TPOT. Ferreira et al. carried out experiments based on three scenarios: General ML (GML), Deep Learning (DL) and XGBoost [27]. They performed a 10-fold cross-validation comparing eight open-source AutoML tools on 12 popular OpenML datasets. They used different performance metrics for regression, binary and multi-class classification tasks. Mean Absolute Error was used for regression, Area Under Curve (AUC) for binary classification and Macro F1 score for multi-class classification. In total, authors performed 12 (datasets) 6 (tools) 10 (folds) 720 AutoML executions, demonstrating the high performance of TPOT optimization in classification problems.
Banadaki et al. used Auto AI for malicious DoH traffic classification [14]. They deployed DoHBrw dataset [2], extracted 34 features by using the DoHlyzer tool [3] and input them into Auto AI to analyze different pipeline configurations the tool provided. However, unlike TPOT, Auto AI considers six ML classifiers, namely Extra Trees, DT, GB, LGBM, XGB, and RF classifiers. Their results showed that LGBM and XGBoost could differentiate DoH from non-DoH traffic with a high accuracy.
In summary, previous works show that there is a need for a systematic and comprehensive study of analyzing the entropy of traffic flows, their statistical features for optimizing the detection of DNS (DoH) tunnelling and exfiltration behaviours.
3 Methodology
In this paper, we extend our previous research on detecting tunnelling and exfiltration behaviours in DoH traffic via optimization of the network traffic flow inspection-based approach, where the statistical flow features are augmented with the entropy of the network flow [34]. This augmented feature set is then used with ML classifiers to detect the malicious DNS tunnels. Figure 1 shows the overall methodology we followed. In this work, three publicly available datasets are run through Flow Exporters, generating statistical features for each flow. These are then augmented with the entropy of a flow. For the entropy calculations, four different approaches are benchmarked during the experiments: the first approach does not deploy any entropy feature, the second approach calculates an entropy value per flow by using all packets of the given flow, the third approach calculates an entropy value per flow by using the first 96 bytes of the payload and the last approach calculates the entropy value using only the first n-number of packets of a flow (where n equals 4 to 6). The final set of statistical and entropy features are then used to train ML models to differentiate benign flows from malicious ones. ML models trained in this work are: C4.5 Decision Tree, Random Forest, Logistic Regression (LR), Support Vector Machine (SVM) and Naive Bayes (NB). After an ML model is trained, five different testing datasets are used to evaluate its performance, complexity and computational cost. Once the final statistical features are chosen along with the entropy of a flow, the proposed approach is optimized using the TPOT-AutoML system. Then, the aforementioned five testing datasets are employed to evaluate and analyze the performance, complexity and computational cost of the optimized detector approach. The reduced number of features required for training ensures considerably less computational cost on finding the best possible pipeline by the TPOT-AutoML system.
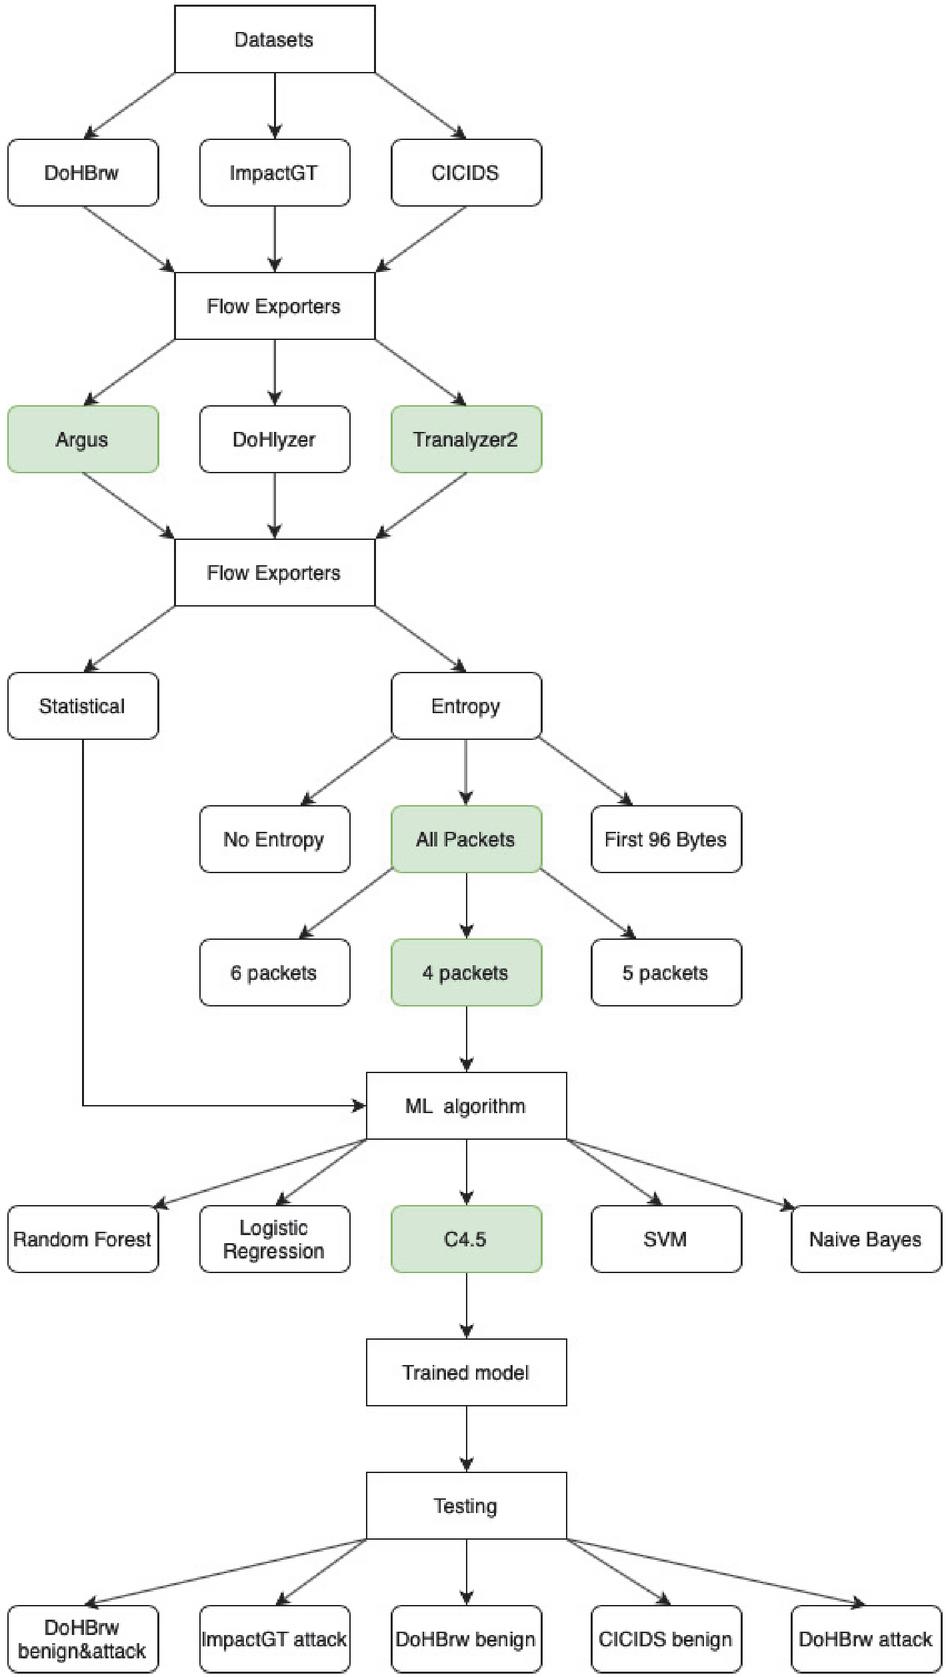
Figure 1 Research Methodology for selecting the best feature set.
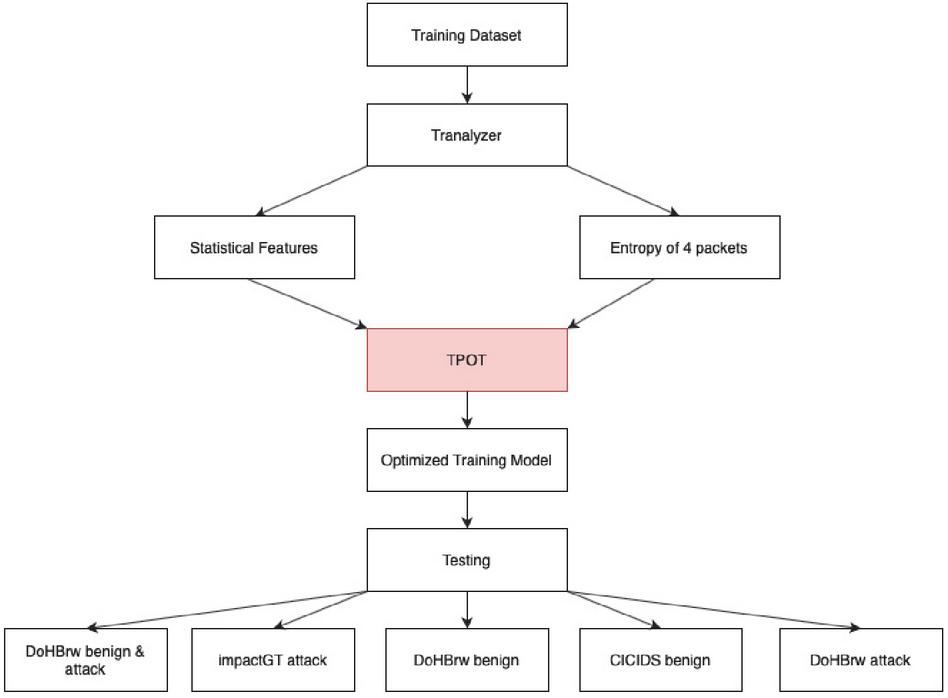
Figure 2 Overview of the system used for optimizing the proposed approach.
3.1 Datasets
Due to the novelty of the DoH protocol, finding publicly available datasets is a challenging task. Montazeri et al. released the “CIRA-CIC-DoHBrw-2020” dataset [2], where they generated Benign-DoH, Attack-DoH and non-DoH traffic using five different browsers and four servers. They used Google Chrome, Mozilla Firefox browsers along with dns2tcp, DNSCat2 and Iodine tools to access the top 10k Alexa websites. As for servers: AdGuard, Cloudflare, GoogleDNS and Quad9 were employed to respond to DoH requests. In their dataset, DoH traffic is divided into benign and attack where attack activities are represented in a tunnelled form. Tools used for attack traffic generation sent TCP traffic encapsulated in DNS queries. DNS queries were sent using TLS-encrypted HTTPS requests to one of the four DoH servers. Hereafter, this dataset is referred to as DoHBrw.
Another publicly available dataset used in this work is “GT Malware Passive DNS Data Daily Feed” [50, 5]. The dataset collection was initiated by Georgia Tech Information Security Center in 2015, with data capture still continuing. It was generated by running suspect Windows executable files in a sterile and isolated environment, with limited access to the Internet. For our paper, DNS Data for the year 2020 is employed. Hereafter, this dataset is referred to as ImpactGT.
Additionally, another publicly available dataset, namely “CICIDS 2017” [31, 48] is also employed in this paper. CICIDS, Intrusion Detection Evaluation Dataset was released by the University of New Brunswick in 2017 and contains benign and attack pcap files. This dataset includes the activities of 25 users using HyperText Transfer Protocol (HTTP), HTTPS, File Transfer Protocol (FTP), Secure Shell (SSH) and email protocols for benign traffic over five days. We employed only the benign traffic from this dataset. Henceforward, it is referred to as CICIDS.
Table 1 shows the number of flows used from each dataset in this research. As it can be seen from the table, the largest number of flows were taken from the DoHBrw dataset, corresponding to benign and attack behaviour. ImpactGT dataset employed in this work includes only attack traffic. On the other hand, CICIDS traffic employed in this work include only benign traffic. The datasets used in our evaluations are all balanced (equal number of attack and benign flows) for training purposes.
Table 1 A summary of the datasets used
| Datasets | DoHBrw | ImpactGT | CICIDS |
| Number of flows | 33000 | 12000 | 12000 |
3.2 Network Flow Extraction Tools
As discussed earlier, in this work, we explore the application of network traffic flow-based features augmented with the calculated flow entropy. This enables the analysis of encrypted DoH traffic for attack behaviours since no deep packet packet inspection is necessary. The proposed flow-based approach considers flow properties in general – duration, number of bytes sent and received (among others) – making near real-time analysis of network activity possible for network security specialists. To this end, we explore the usage of the following three network traffic flow exporters that are publicly available.
1. Tranalyzer2 is a lightweight flow generator and analyzer, which can work with ultra-large traffic dumps [6]. Tranalyzer2 consists of a set of plug-ins, which users can activate according to their needs. Packet-to-flow aggregation provides better analysis of network operations [20]. Similar to TShark, Tranalyzer2 supports packet mode, but unlike TShark, Tranalyzer2 also includes a unique numerical ID linking every packet to its flow [20]. In earlier work, Haddadi et al. evaluated several flow exporter tools on benchmark datasets and reported that Tranalyzer2 demonstrated the best performance [28]. Tranalyzer2 extracts 109 features for each network flow. Additionally, it provides information about flow directions, i.e. labeling A and B flows (client to server and server to client respectively). Overall, the functionalities of Tranalyzer2 include:
• Packet capture
• Packet-to-flow allocation
• Flow timeout handling
• Plug-in function invocation
• Flow/packet based output formats
2. Argus is a bi-directional network traffic flow monitoring system. It provides information about network flow status and is generally used for Network Intrusion Detection and Anomaly Detection projects [1]. Argus supports many protocols such as TCP, ARP, ICMP, and ESP, using its binary format for flow extraction. For this reason, it requires the use of RA tool to convert the binary output into CSV. Argus extracts 125 features for each flow.
3. DoHlyzer is specifically designed to export and analyze DoH traffic flows [3]. Developed in Python, DoHlyzer gets pcap files as input and extracts statistical and time-series features which are output into CSV files. DoHlyzer extracts 34 features for each flow. DoHlyzer consists of several modules that assist data analysis of DoH flows. These include DoHMeter, Analyzer and Visualizer. Functionalities of the DoHMeter model include:
• Capturing HTTPS packets from a network interface and parsing user-specified pcap files;
• Grouping packets into flows by their source and destination IP addresses as well as source and destination port numbers;
• Statistical and time-series feature extraction for traffic analysis.
To evaluate and compare these three flow exporters, first we employed a C4.5 decision tree to classify attack versus normal behaviours using the training dataset. In this set of experiments, we only used the statistical flow features without augmenting them with the entropy, Table 2. The results showed that while Argus and DoHlyzer achieve F-measure values around 99%, Tranalyzer2 achieves an F-measure of 95%. Since all of them have high performances, we further analyzed the features that were selected by the trained decision tree model from the set of all features given to the classifier. To this end, we observe that the C4.5 classifier using information gain selected 7 features to separate benign flows from attack ones when Tranalyzer2 is used. It selected 10 features when Argus is used, and 14 features when DoHlyzer is used. It should be noted here that DoHlyzer supports feature extraction based on only TCP flows, whereas Argus and Tranalyzer2 support both TCP and UDP flows.
Table 2 Performance of C4.5 training model on flow statistical features via flow exporters
| Flow Exporter | # of Attributes Used | P | F | R |
| Tranalyzer2 | 7 | 95.6 | 95.2 | 95.2 |
| Argus | 10 | 99.6 | 99.6 | 99.6 |
| DoHlyzer | 14 | 99.9 | 99.9 | 99.9 |
Table 3 Features chosen by Tranalyzer2
| # | Attribute | Description |
| 1 | tcpSeqSntBytes | TCP sent seq diff bytes |
| 2 | connSip | Number of connections from source IP to different hosts |
| 3 | tcpSSASSAATrip | (A) TCP Trip Time Syn, Syn-Ack;(B) TCP Trip Time Syn-Ack |
| 4 | tcpRTTAckTripJitAve | TCP ACK trip jitter average |
| 5 | aveIAT | Average inter-arrival time |
| 6 | bytps | Sent bytes per second |
| 7 | stdIAT | Standard inter-arrival time |
Given the low number of features selected when Tranalyzer2 is used (less number of features potentially enables a simpler ML model and near real-time execution) and the ease of using Tranalyzer2 (compared to DoHlyzer and Argus) on all datasets employed, we selected to continue with Tranalyzer2 to extract features from flows for the first phase of our experiments. However, we did compare Tranalyzer2-extracted features to Argus-extracted flow features, given that both tools support TCP and UDP. These comparisons are included in Section 4, demonstrating the performance obtained by Tranalyzer2-extracted features.
Table 4 Features chosen by Argus
| # | Attribute | Description |
| 1 | DstLoad | Destination bits per second |
| 2 | TcpRTT | TCP connection setup round-trip time, the sum of ’synack’ and ’ackdat’ |
| 3 | Cause | Argus record cause code: Start, Status, Stop, Close, Error |
| 4 | Dur | Record total duration |
| 5 | Dir | Direction of transaction |
| 6 | sTtl | Source to Destination TTL value |
| 7 | Rank | Ordinal value of this output flow record i.e. sequence number |
| 8 | DstLoad | Destination bits per second |
| 9 | Proto | Transaction Protocol |
| 10 | dHops | Estimate number of IP hops from dst to this point |
Table 5 Features chosen by DoHlyzer
| # | Attribute | Description |
| 1 | FlowBytesSent | Number of flow bytes sent |
| 2 | PacketLengthMode | Mode packet length |
| 3 | DestinationPort | Destination port |
| 4 | PacketLengthMedian | Median packet length |
| 5 | PacketTimeMedian | Median packet time |
| 6 | PacketLengthSkewFromMedian | Skew from median packet length |
| 7 | ResponseTimeTimeVariance | Variance of request/response time difference |
| 8 | FlowReceivedRate | Rate of flow bytes received |
| 9 | PacketTimeSkewFromMedian | Skew from median packet time |
| 10 | PacketLengthVariance | Variance of packet length |
| 11 | PacketLengthSkewFromMode | Skew from mode packet length |
| 12 | Duration | Duration |
| 13 | ResponseTimeTimeMode | Mode request/response time difference |
| 14 | PacketLengthMode | Mode packet length |
3.3 Network Flow Entropy and Statistical Features
Claude E. Shannon introduced the concept of entropy for information theory in 1948 [25]. Entropy is a measure of a state of randomness, disorder or uncertainty. The more random the string is, the higher the entropy value it has. Entropy has been used in many fields from thermodynamics to physics and has been of interest in network anomaly detection as well. Detection of online worms, DDoS attacks, ransom malware – are just a few examples where entropy can be used for attack identification purposes. To this end, researchers have used entropy to capture important characteristics of a packet’s header or payload distributions [37, 16, 32, 21] for detecting anomalous behaviours. However, we are not aware of any work that provides a methodology to leverage entropy over network flows. Thus, the research hypothesis is that entropy characteristics of a network traffic flow could provide an accurate metric to show the randomness and therefore could be used to indicate the actual state of encryption in the flow analyzed. Campbell et al. has shown that entropy values calculated over an encrypted packet payload could enable identification of tunnelling behaviours in DNS traffic in [21]. In this paper, we optimize and evaluate our proposed approach to study the use of entropy over network traffic flows. To this end, the following is used to calculate the entropy of a network flow:
| (1) |
where is the string and is a character in the string, and is a particular character’s probability of being present in the string [25, 26]. Figure 3 shows the approach we followed in network flow entropy calculation. The pcap file is provided as an input to the T-Shark tool, which extracts 6-tuple information from each packet: source IP address, destination IP address, source port, destination port, packet’s frame time, and protocol.
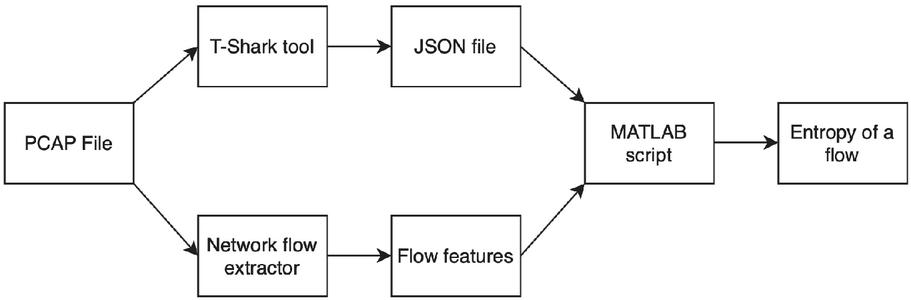
Figure 3 Methodology for entropy calculation.
JSON file, generated by the T-Shark tool, contains 6-tuple information, which MATLAB script uses to match each packet to a particular flow. After all of the packets are matched to their flows, the entropy value of the merged n packets is calculated.
In this work, we augment statistical flow features with the entropy of a network flow. In this case, the decision tree employs 13 features in total, where 12 of them are statistical features selected by the decision tree from the set of features that Tranalyzer2 extracts. It should be noted that features selected by the decision tree significantly differ from the features chosen when no entropy is employed (see Table 6 and Table 7 versus the previous tables). Once the statistical and entropy features are extracted and calculated, a balanced training dataset with 6000 attack and 6000 benign flows is used to create a training model. Moreover, the dataset is balanced in terms of protocols as well: both benign and attack flows are represented with TCP and UDP protocols. DoHBrw dataset consists of TCP flows, while ImpactGT and CICIDS are made up of UDP flows.
Table 6 Features chosen by Tranalyzer2 augmented with entropy
| # | Attribute | Description |
| 1 | %dir | Direction of the flow |
| 2 | numBytesSnt | Number of bytes sent |
| 3 | minPktSz | Minimum packet size |
| 4 | stdIAT | Standard inter-arrival time |
| 5 | ipMindIPID | IP minimum delta IP identification |
| 6 | ipMaxTTL | IP maximum time to live |
| 7 | tcpPSeqCnt | TCP packet sequence count |
| 8 | tcpInitWinSz | TCP initial effective window size |
| 9 | tcpAveWinSz | TCP average effective window size |
| 10 | tcpMSS | TCP maximum segment length |
| 11 | tcpWS | TCP window scale |
| 12 | tcpRTTAckTripMax | TCP acknowledgment trip maximum |
| 13 | entropy | Entropy value of a flow |
As discussed earlier, the training model is evaluated under four different scenarios: (i) Only statistical flow features are used without any entropy, (ii) Flow features are augmented with the entropy that is calculated over all the packets of a network flow, (iii) Flow features are augmented with the entropy that is calculated over the first 96 bytes of a network flow [23], and (iv) Flow features are augmented with the entropy that is calculated for the first n-packets of a network flow. When scenario 2 outperformed scenarios 1 and 3, we explore the entropy concept of a network flow by using as few packets (of a flow) as possible, hence scenario 4. The reason behind this is that identifying all packets belonging to a flow, and calculating their entropy is computationally expensive. To decrease this computational cost, we analyze the number of packets per flow (following the work in [17]) in each dataset used, Figure 4.
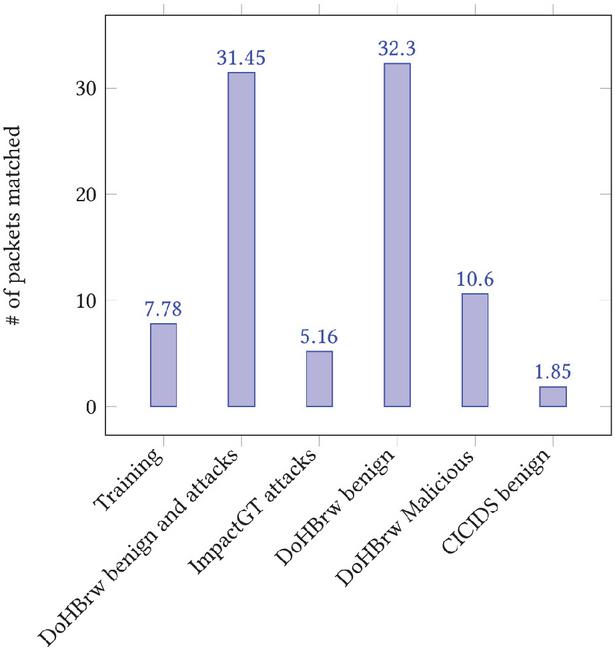
Figure 4 Average number of packets per flow in training and testing deployments.
Thus, we train and evaluate the classifiers by calculating the entropy for the first n 6, n 5 and n 4 packets of a given flow. In this case, our objective is to find the minimum number of packets per flow that can provide a reasonable indication of the entropy of a flow without decreasing the performance of the classifier. The results of these evaluations show that calculating flow entropy over the first four packets of a flow decreases the computational cost (relative to all packets) without decreasing the F-measure of a classifier. It should be noted here that when a flow has less than four packets, all packets belonging to that flow are used for the entropy calculation.
Table 7 Features chosen by Argus augmented with entropy
| # | Attribute | Description |
| 1 | DstLoad | Destination bits per second |
| 2 | Entropy | Entropy value calculated over 4 packets |
| 3 | TotBytes | Total transaction bytes |
| 4 | DstBytes | Destination Source transaction bytes |
| 5 | RunTime | Total active flow run time |
| 6 | sTtl | Source to destination TTL value |
| 7 | Rank | ordinal value of this output flow record i.e. sequence number |
3.4 Machine Learning Models Used
In this paper, five well-known machine learning models that are widely used in the literature are employed: C4.5 Decision Tree, Random Forest, Logistic Regression, Support Vector Machine, and Naive Bayes. Detailed information on these algorithms can be found in [11].
3.4.1 C4.5 Decision Tree (DT)
A C4.5 DT is a tree-structured model, where internal nodes represent conditions applied to features. The leaf nodes represent the class labels, and the paths from root to leaves represent the classification rules. C4.5 algorithm is an extension to ID3 algorithm, which aims to find the small DTs, then convert the trained DT into an If-Then rule set. DTs are constructed through a process of deterministically splitting the training partition based on the selection of the features, maximizing the normalized information gain. Each branch of the DT partitions the training data into subsets, where the goal is to identify subsets that have the same label. Recursive application of this process incrementally constructs the DT until leaf nodes appear with sufficiently high normalized information gain.
3.4.2 Random Forest (RF)
RF classifier is made by several random decision trees. Firstly, RF builds a tree on a random sample of data. Then, for each tree, it selects a random set of features to generate the best split. Then, by aggregating them, RF predicts the new data sample. Building blocks of a RF model are DTs. In addition, RF increases the diversity by choosing a random subset of features and performing them on a random set of the training data, which is used to provide a more robust resulting model.
3.4.3 Logistic Regression (LR)
LR model fits the data to the “Logistic Function” and returns the probability of occurrence. LR is commonly used for multi-class classification tasks. LR is a version of linear regression when the target is categorical. Prediction is made by getting the maximum likelihood, which provides a constant output. By maximizing the likelihood function, LR determines the parameters which will most likely produce the actual target. LR uses a sigmoid function as the logistic function and maps the value between 0 and 1.
3.4.4 Support Vector Machine (SVM)
SVM is a binary learning algorithm that can be used for classification and rule regression. The goal of this classification algorithm is to build an N-dimensional hyperplane that optimally separates the samples of data into two classes with maximal margin. SVM classifier can easily be extended to k-class classification by constructing k binary classifiers. In order to use an SVM to solve a classification problem on nonlinearly separable data, a nonlinear mapping of the input data into a high-dimensional feature space is required. Then, an optimal hyperplane for separating the high dimensional features of input data can be constructed, which maximizes the separation margin. Finally, a linear mapping from the feature space to the output space is required.
3.4.5 Naive Bayes (NB)
A NB classifier is a simple probabilistic classifier based on the Bayes theorem. Bayes theorem assumes that the presence of a feature in a given class is independent of other features of the data. The classifier uses the maximum-likelihood probability method for parameter estimation. Given a training set, the NB classifier predicts the training dataset samples that belong to a given class, having the highest posteriori.
3.5 TPOT for optimization
TPOT is considered as a data science assistant that enables researchers to find the best possible pipeline for a classification task [29, 44]. It was one of the very first AutoML methods and open-source software packages developed for the data science community [7]. It is based on the Genetic Programming (GP) principle to generate the optimized search space. GP employs the process of natural selection where the fittest individuals are selected for reproduction in order to produce offspring of the next generation [8] as the following:
• Selection phase chooses the fittest individuals and lets them pass their genes to the next generation
• Crossover selects the fittest individuals from above and performs crossover between them to generate a new population
• Mutation of individuals generated y crossover for further random modifications. It is repeated for a few steps or until the best generation is achieved [8, 29]
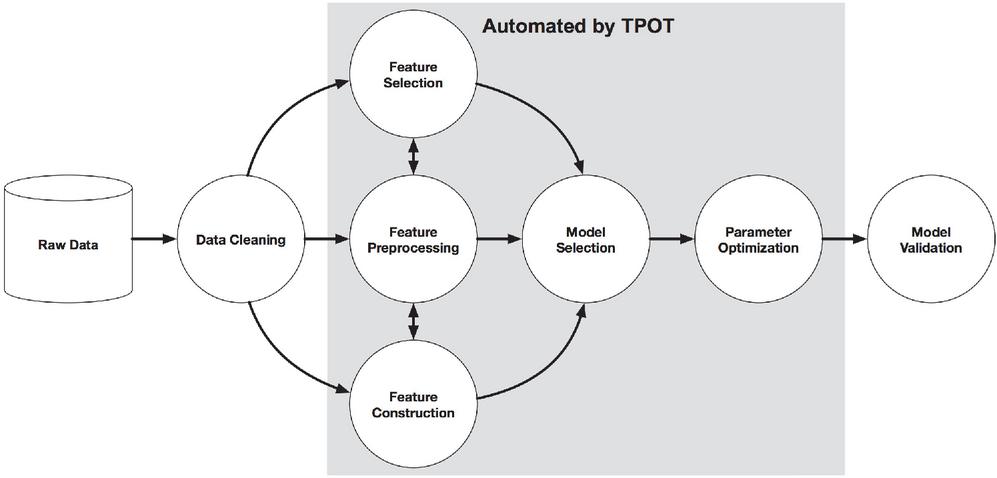
Figure 5 An example machine learning pipeline [29].
Figure 5 shows an example ML pipeline of TPOT depicting the automation and optimization of feature selection, preprocessing, model construction, parameter optimization and best model validation. During the training process, TPOT tries one pipeline, assesses its performance and makes random changes to the pipeline’s parameters in search of a better solution. The process is repeated until TPOT finds the optimum solution. Once the training process is complete, TPOT provides a Python code for the optimized pipeline, which can be exported by the user [12]. For example, for a 10,000-pipeline configuration, TPOT will evaluate different models using 10-fold Cross-Validation (CV score), and therefore resulting in 100,000 models being fit and evaluated on the training data in one grid search. TPOT is implemented with a number of configurations, working best for specific tasks. In this work, we employed the default TPOT configuration. Moreover, to be able to compare the TPOT results with a standard ML classifier, we used the same training and testing datasets for our evaluations. It should be noted here that the number of pipelines TPOT considers depends on the parameters set by the user. In this work, we evaluated TPOT’s performance over 10, 50, 100 and 200 generations, processing 1100, 5100, 10100 and 20100 pipelines, respectively. Lastly, the list of classifiers and preprocessors implemented in TPOT is extensive. Table 8 shows the options implemented in the latest version of TPOT [12]. However, if the user does not want to consider all classifiers during training, they can limit the algorithms and parameters to be considered.
Table 8 The current list of classifiers and preprocessors implemented in TPOT
| # | Classifier | Preprocessor |
| 1 | Bernoulli Naive Bayes | Binarizer |
| 2 | Gaussian Naive Bayes | Fast ICA |
| 2 | Multinomial Naive Bayes | Feature Agglomeration |
| 3 | Decision Tree | Max Abs Scaler |
| 4 | Extra Trees | Min Max Scaler |
| 4 | Random Forest (RF) | Normalizer |
| 5 | Gradient Boosting (GB) | Nystroem |
| 6 | K-Neighbors | PCA |
| 7 | Linear SVC | Polynomial Features |
| 8 | Logistic Regression (LR) | RBF Sampler |
| 9 | Extreme Gradient Boosting (XGB) | Robust Scaler |
| 10 | Stochastic Gradient Descent (SDG) | Standard Scaler |
| 11 | Multi Layer Perceptron (MLP – Neural Network) | Zero Count |
| 12 | One Hot Encoder |
4 Evaluations and Results
As discussed earlier, the goal of this work is to explore the use of entropy of a network flow to augment statistical flow features and to optimize the proposed model to identify attack DoH tunnels. Proposing an effective performance (in terms of F1-measure) with a relatively reasonable computational cost solution is a key focus throughout the research methodology. All the experiments were run on a MacBook Pro with a 2.3GHz 8-core Intel Core i9. Thus, the performance of the proposed approach is measured by the following metrics:
1. Precision is the ratio of correctly predicted attack (benign) flows to the total number of attack (benign) flows.
2. Recall is the ratio of correctly predicted attack (benign) flows to all flows in actual class.
3. F1-measure is a weighted average of the Precision and Recall.
4.1 Evaluating Different Entropy Approaches – Phase1
As a first phase in our study, a C4.5 decision tree classifier is trained on the training dataset using different entropy approaches. Then, five testing datasets are used for evaluating the trained models. To this end, WEKA,1 the open-source ML software library is used for training and testing all classifiers using default parameters. Table 9 shows the results of the C4.5 decision tree classifier on training and testing datasets, using flow features augmented with the entropy calculated over all packets of a flow. As it can be seen from the results, the performance of this trained model is still over 90% for the first four test datasets that were not seen during the training. The only exception is the last test dataset containing 9000 attack flows from DoHBrw.
Table 9 C4.5 classification results – entropy calculated over all packets of a flow
| Scenario | Datasets | P | R | F |
| Training | DoHBrw+ImpactGT+CICIDS | 0.997 | 0.997 | 0.997 |
| Testing | DoHBrw benign and attack | 0.921 | 0.906 | 0.906 |
| ImpactGT attack | 1.000 | 0.999 | 1.000 | |
| DoHBrw benign | 1.000 | 0.991 | 0.995 | |
| CICIDS benign | 1.000 | 0.990 | 0.995 | |
| DoHBrw attack | 1.000 | 0.821 | 0.902 |
On the other hand, when no entropy is used to augment flow features, the performance of the classifier drops for all datasets, except the last one, Table 11. Specifically, Recall values decline on almost all test datasets, specifically for CICIDS benign and DoHBrw attack datasets. These results indicate the effectiveness of the entropy for augmenting flow statistical features. Moreover, Table 10 shows the results of the C4.5 decision tree classifier on training and testing datasets, using flow features augmented with entropy calculated over the first four packets of a flow. These results demonstrate that only the first four packets of a flow seem to be enough to calculate the entropy. This not only augments flow statistical features well without decreasing the F-measure, Precision and Recall metrics but also it is computationally less expensive relative to calculating entropy over all packets of a flow when the flow includes more than four packets. It is noticeable that this approach improves the performance of the C4.5 model. Thus, we employ this model in the following evaluations as well.
Table 10 C4.5 classification results – entropy calculated over the first 4 packets of a flow
| Scenario | Datasets | P | R | F |
| Training | DoHBrw+ImpactGT+CICIDS | 0.997 | 0.997 | 0.997 |
| Testing | DoHBrw benign and attack | 0.928 | 0.917 | 0.916 |
| ImpactGT attack | 1.000 | 0.999 | 1.000 | |
| DoHBrw benign | 1.000 | 0.983 | 0.983 | |
| CICIDS benign | 1.000 | 1.000 | 1.000 | |
| DoHBrw attack | 1.000 | 0.828 | 0.906 |
Table 11 C4.5 classification results – no entropy
| Scenario | Datasets | P | R | F |
| Training | DoHBrw+ImpactGT+ CICIDS | 0.956 | 0.952 | 0.952 |
| Testing | DoHBrw benign and attack | 0.919 | 0.916 | 0.916 |
| ImpactGT attack | 1.000 | 0.985 | 0.992 | |
| DoHBrw benign | 1.000 | 0.928 | 0.963 | |
| CICIDS benign | 1.000 | 0.708 | 0.829 | |
| DoHBrw attack | 1.000 | 0.907 | 0.951 |
4.2 Evaluating Different ML Classifiers – Phase2
Table 12 presents a comparison of the proposed model using the C4.5 decision tree classifier against Random Forest (RF), Logistic Regression (LR), Support Vector Machine (SVM) and Naive Bayes (NB) classifiers. These ML classifiers are chosen for further evaluations since they were used in the previous works as discussed in Section 2.
Table 12 RF, SVM, LR, and NB classification results – entropy calculated over the first 4 packets of a flow
| ML Classifiers | Random Forest | SVM | Logistic Regression | Naive Bayes | ||||||||
| P | R | F | P | R | F | P | R | F | P | R | F | |
| Training: DoHBrw+ ImpactGT+ CICIDS | 1.000 | 1.000 | 1.000 | 0.893 | 0.870 | 0.868 | 0.963 | 0.962 | 0.962 | 0.861 | 0.818 | 0.813 |
| Test: DoHBrw benign and attack | 0.926 | 0.917 | 0.917 | 0.813 | 0.750 | 0.737 | 0.951 | 0.951 | 0.951 | 0.786 | 0.730 | 0.717 |
| Test: ImpactGT attack | 1.000 | 1.000 | 1.000 | 1.000 | 0.983 | 0.992 | 1.000 | 0.999 | 0.999 | 1.000 | 0.984 | 0.992 |
| Test: DoHBrw benign | 1.000 | 0.989 | 0.995 | 1.000 | 0.785 | 0.880 | 1.000 | 0.890 | 0.942 | 1.000 | 0.543 | 0.704 |
| Test: CICIDS benign | 1.000 | 1.000 | 1.000 | 1.000 | 0.865 | 0.928 | 1.000 | 0.844 | 1.000 | 1.000 | 0.672 | 0.804 |
| Test: DoHBrw attack | 1.000 | 0.844 | 0.915 | 1.000 | 0.985 | 0.992 | 1.000 | 0.953 | 0.976 | 1.000 | 0.977 | 0.988 |
In this phase, different ML classifiers are evaluated using the same training and testing datasets as well as the same feature set, i.e. flow statistical features augmented with the flow entropy feature calculated over the first four packets of a flow. The results show that the RF classifier demonstrates a similar performance as the C4.5 classifier. It is interesting to see that LR, SVM and NB perform well in detecting attack flows, too. However, they misclassify the majority of benign flows in testing datasets. The NB classifier, for example, managed to classify only around 54% of benign flows in the DoHBrw benign dataset. This seems to support the argument Singh et al. made in [49] regarding the lagging feature of the NB classifier.
Table 13 shows the performance of the RF classifier as we increase the number of trees during training (the same feature set and the same training dataset as before) using the numIterations parameter. The results show that as the number of trees increases from 100 to 2000, the performance seems to stay pretty much consistent.
Table 13 RF classification results as number of trees increases – entropy calculated over the first 4 packets of a flow
| Training | Testing | |||||||||||||||||
| #Trees | DoHBrw+ImpactGT+CICIDS | DoHBrw benign and attack | ImpactGT attack | DoHBrw benign | CICIDS benign | DoHBrw attack | ||||||||||||
| P | R | F | P | R | F | P | R | F | P | R | F | P | R | F | P | R | F | |
| 100 | 1.000 | 1.000 | 1.000 | 0.926 | 0.917 | 0.917 | 1.000 | 1.000 | 1.000 | 1.000 | 0.989 | 0.995 | 1.000 | 1.000 | 1.000 | 1.000 | 0.844 | 0.915 |
| 500 | 1.000 | 1.000 | 1.000 | 0.940 | 0.935 | 0.935 | 1.000 | 1.000 | 1.000 | 1.000 | 0.990 | 0.995 | 1.000 | 1.000 | 1.000 | 1.000 | 0.880 | 0.936 |
| 1000 | 1.000 | 1.000 | 1.000 | 0.941 | 0.935 | 0.935 | 1.000 | 1.000 | 1.000 | 1.000 | 0.990 | 0.995 | 1.000 | 1.000 | 1.000 | 1.000 | 0.881 | 0.937 |
| 1500 | 1.000 | 1.000 | 1.000 | 0.938 | 0.932 | 0.932 | 1.000 | 1.000 | 1.000 | 1.000 | 1.000 | 1.000 | 1.000 | 1.000 | 1.000 | 1.000 | 0.878 | 0.935 |
| 2000 | 1.000 | 1.000 | 1.000 | 0.938 | 0.932 | 0.932 | 1.000 | 1.000 | 1.000 | 1.000 | 0.990 | 0.995 | 1.000 | 1.000 | 1.000 | 1.000 | 0.877 | 0.935 |
Table 14 presents the depth of RF trees as we increase the number of trees during training. This indicates that RF trees are deep and therefore resulting in a rather complex RF classifier, with the depth of the tree starting from 24 (x100) and going up as the number of trees increases. On the other hand, the C4.5 decision tree classifier’s trained model is less complex (depth10), Figure 6. This also demonstrates that Decision Tree trained model uses the entropy attribute throughout the tree to classify a flow as benign or attack. Based on these results obtained, using the proposed Decision Tree solution as a predictive model will enable to label the new/unseen flows by providing 13 statistical features augmented with the entropy feature (over the first four packets of a flow).
Table 14 Depth of RF per tree as the number of trees increase – Trained on DoHBrwImpactGTCICIDS
| #Trees | Depth/Tree |
| 100 | 24 |
| 500 | |
| 1000 | |
| 1500 | 26 |
| 2000 |
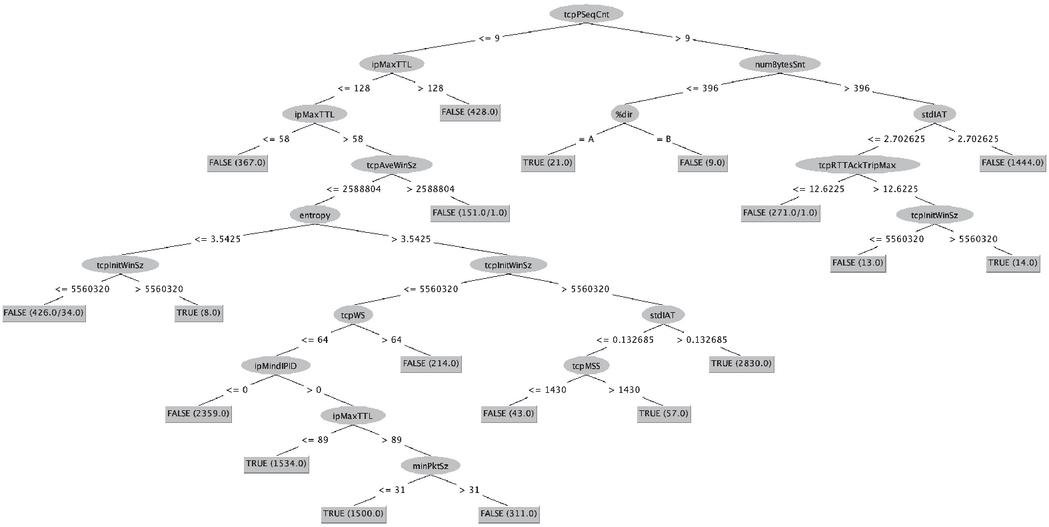
Figure 6 Visualization of the C4.5 Decision Tree trained model – entropy calculated over the first 4 packets of a flow.
4.3 Optimization Using TPOT – Phase3
In this phase of our evaluations, we employed TPOT toolset to optimize the proposed approach for DoH tunneling detection. To this end, we used the same 13 features for the TPOT optimization process as well. Again, TPOT’s performance is represented using the same metrics employed in the previous phases of the evaluations. It should be noted here that the more pipelines TPOT evaluates, the more time it requires for the training process.
Firstly, we configured TPOT to use all 11 classifiers in search of the best solution, without limiting its choice. Table 15 presents the results of running one training and five testing datasets through these pipelines. It is interesting to see that for the smallest number of generations (n 10), TPOT chose RF classifier, achieving almost 100% training CV score. However, as the number of generations increases, the top performing classifier shifts to GB classifier, reaching a similar performance for longer generations. Following this, we configured TPOT to use a Neural Network classifier only, looking at how performance will change as the number of generations increase (see Table 16). In this case, MLP classifier demonstrated 88% CV score for n 10 and 90% CV score for n 200. However, the performance of the trained model on testing datasets was much lower.
Table 15 Results of running TPOT (11 classifiers) for optimizing the proposed approach
| # of Generations | 10 | 50 | 100 | 200 | ||||||||
| Classifier chosen | Random Forest | Gradient Boosting | Gradient Boosting | Gradient Boosting | ||||||||
| Training CV score(avg) | 0.997 | 0.998 | 0.998 | 0.998 | ||||||||
| Testing datasets | P | R | F | P | R | F | P | R | F | P | R | F |
| DoHBrw benign and attack | 1.00 | 0.92 | 0.96 | 0.99 | 0.99 | 0.99 | 0.99 | 0.99 | 0.99 | 0.99 | 0.99 | 0.99 |
| ImpactGT attack | 1.00 | 1.00 | 1.00 | 1.00 | 1.00 | 1.00 | 1.00 | 1.00 | 1.00 | 1.00 | 1.00 | 1.00 |
| CICIDS benign | 1.00 | 1.00 | 1.00 | 1.00 | 1.00 | 1.00 | 1.00 | 1.00 | 1.00 | 1.00 | 1.00 | 1.00 |
| DoHBrw benign | 1.00 | 0.98 | 0.99 | 1.00 | 0.99 | 0.99 | 1.00 | 0.98 | 0.99 | 1.00 | 0.99 | 0.99 |
| DoHBrw attack | 1.00 | 0.92 | 0.96 | 1.00 | 0.98 | 0.99 | 1.00 | 0.99 | 1.00 | 1.00 | 0.99 | 1.00 |
Table 16 Results of running TPOT – Neural Network classifiers only
| # of Generations | 10 | 50 | 100 | 200 | ||||||||
| Classifier chosen | MLP | MLP | MLP | MLP | ||||||||
| Training CV score(avg) | 0.877 | 0.873 | 0.878 | 0.893 | ||||||||
| Testing datasets | P | R | F | P | R | F | P | R | F | P | R | F |
| DoHBrw benign and attack | 0.69 | 0.68 | 0.67 | 0.44 | 0.49 | 0.36 | 0.69 | 0.66 | 0.65 | 0.73 | 0.71 | 0.71 |
| ImpactGT attack | 1.00 | 1.00 | 1.00 | 1.00 | 1.00 | 1.00 | 1.00 | 1.00 | 1.00 | 1.00 | 1.00 | 1.00 |
| CICIDS benign | 1.00 | 0.85 | 0.92 | 1.00 | 0.72 | 0.84 | 1.00 | 0.85 | 0.92 | 1.00 | 0.86 | 0.92 |
| DoHBrw benign | 1.00 | 0.58 | 0.73 | 1.00 | 0.94 | 0.97 | 1.00 | 0.43 | 0.60 | 1.00 | 0.56 | 0.72 |
| DoHBrw attack | 1.00 | 0.84 | 0.91 | 1.00 | 0.04 | 0.08 | 1.00 | 0.87 | 0.93 | 1.00 | 0.88 | 0.94 |
Table 17 RF classifier optimization via TPOT
| Weka | TPOT | |||||
| Tools | P | R | F | P | R | F |
| Training | 1.00 | 1.00 | 1.00 | 0.997 | ||
| Test:DoHBrw benign and attack | 0.926 | 0.917 | 0.917 | 1.00 | 0.92 | 0.96 |
| Test:ImpactGT attack | 1.00 | 1.00 | 1.00 | 1.00 | 1.00 | 1.00 |
| Test:CICIDS benign | 1.00 | 1.00 | 1.00 | 1.00 | 1.00 | 1.00 |
| Test:DoHBrw benign | 1.00 | 0.989 | 0.995 | 1.00 | 0.98 | 0.99 |
| Test:DoHBrw attack | 1.00 | 0.844 | 0.915 | 1.00 | 0.92 | 0.96 |
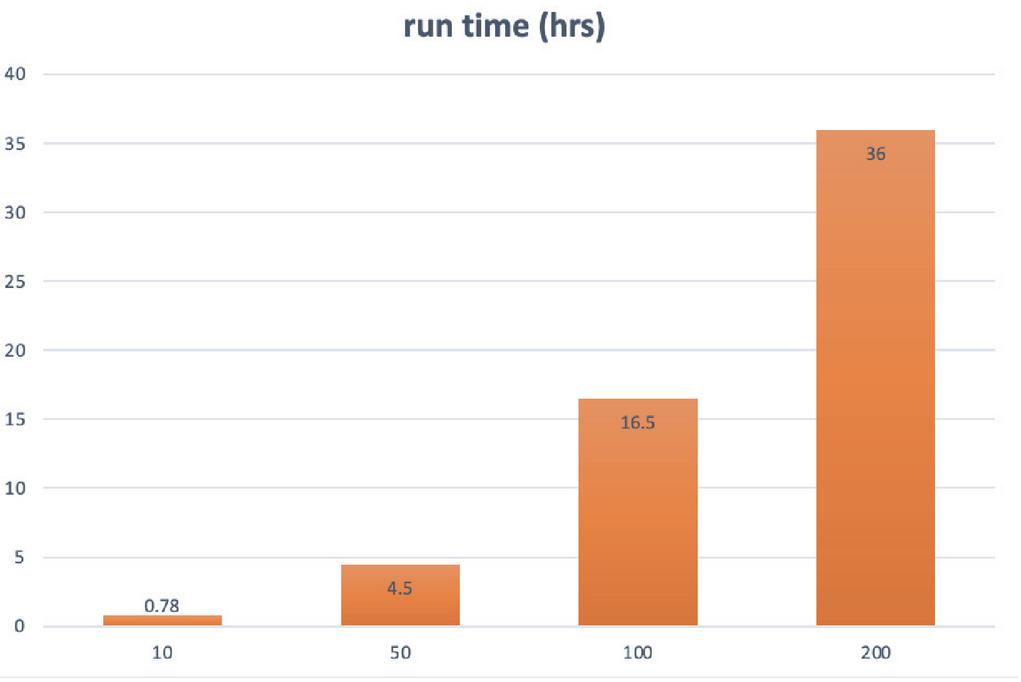
Figure 7 Computational cost (hrs) of TPOT during training as the number of generations increase where TPOT employs 11 classifiers.
Furthermore, we compared the performance of the Random Forest classifier both on Weka and TPOT tools. As discussed earlier, the RF classifier was set with default parameters in Weka, while TPOT was set to optimize using a tailored pipeline for the RF classifier. Although training results were almost identical, testing datasets illustrated some differences (Table 17). Precision value of DoHBrw benign and attack dataset in Weka was lagging behind TPOT’s performance by almost 7%, as for DoHBrw attack dataset, TPOT outperformed Weka by 7% in Recall and 4% in F-1 score. These results indicate that the optimization approach using TPOT improves not only the proposed approach but also the specific classifier’s in terms of parameter optimization and sensitivity.

Figure 8 Computational cost (hrs) of TPOT during training as the number of generations increase where TPOT employs only the Neural Network classifiers.
5 Conclusion and Future Work
In the last five year, DNS has seen pressure for change. In particular, two aspects are of relevance: DoT (DNS over TLS) and DoH (DNS over HTTPS). In DoT, the objective is to secure the communications between the DNS resolver residing on the end user’s system and their chosen recursive resolver over the TLS. On the other hand, DoH achieves this by embedding the DNS query into a secure HTTP request/response. This potentially implies that more and more activities (benign or malicious) are tunnelled through DNS traffic. These will not only change the connection management layer, but also the nature of the traffic and application behaviours. Thus new approaches to monitoring DNS queries, such as DoH, are necessary for traffic monitoring and security management purposes. Researching this area has been a challenging task due to several limitations. First of all, finding publicly available data built on new DoH protocol was the first obstacle we encountered. Limited tools used for feature extraction from network flows were the second challenge on our path. While some works employed DoHlyzer tool to analyze DoH traffic, others employed network packet entropy to address the aforementioned challenges.
In this research, exploring a solution for these challenges without performing deep packet inspection, payload or metadata analysis was an important goal set at the beginning. To this end, we studied the use of the concept of “entropy of a flow” to augment flow statistical features for identifying attack DoH tunnels. To achieve this, a thorough investigation of the use of different flow exporters was performed. The flow exporters that were analyzed include Argus, DoHlyzer and Tranalyzer2. Results showed the limitation of the DoHlyzer tool in terms of protocols it could support, TCP, but not UDP, and hence making feature extraction for UDP flows impossible. Taking into account these limitations present in the DoHlyzer tool for flow feature extraction, it was decided to consider Tranalyzer2 and Argus tools more closely to select the most suitable statistical flow features for the task. These features were then augmented with flow entropy. To this end, three different ways of calculating the entropy of a flow (over all packets of a flow, over the first 96 bytes of a flow and over the first 4/5/6 packets of a flow) using ML classifiers over different datasets were evaluated. The evaluations showed that flow statistical features obtained by Tranalyzer2 when augmented with the entropy feature of a flow calculated over the first 4 packets provides the best performance for detecting attack tunnels in DoH traffic.
Moreover, the research demonstrated the effectiveness of the TPOT-AutoML system for optimizing the proposed model to detect attack DoH flows. Employing TPOT with flow statistical features augmented with entropy calculated over the first four packets enabled us to look at different pipeline configurations at 10, 50, 100 and 200 generations. It should be noted here that with an increase in the number of generations, the training time of TPOT also increases. However, this cost seems to be reasonable to obtain the optimization of the proposed model. Thus, it is concluded that for a lower number of generations allocated for training, Random Forest outperforms other classifiers implemented in TPOT. If the user is interested in the best performance, then setting a generation number to 100 or 200 is recommended. This proposed model not only achieved high performance on all datasets employed but also outperformed the model that did not use the entropy feature. Furthermore, heterogeneous aspects of the datasets employed, from different protocols to different packet sizes to different flow characteristics and different behaviours indicating the generalizability of the proposed model over different real-world scenarios.
Future research will explore the proposed system’s behaviour against evasive and adversarial attacks to improve its robustness [39]. Moreover, evaluating the proposed system on real world datasets as well as other machine learning algorithms will also be of interest. Additionally, the proposed model will be evaluated as a predictor on new/unseen data to investigate its generalization under concept shifts and drifts [33]. Last but not the least, further research into the analysis of DoH and DoT protocols is necessary against the rising privacy and security concerns of our digital world.
Acknowledgement
This research was in part enabled by the support of NSERC. The first author gratefully acknowledges the support by the Study in Canada Scholarship. The research is conducted as part of the Dalhousie NIMS Lab at: https://projects.cs.dal.ca/projectx/.
Footnotes
1 WEKA – https://www.cs.waikato.ac.nz/ml/weka/
References
[1] Argus. https://openargus.org/using-argus. Accessed: 20-Sep-2021.
[2] CIRA-CIC-DoHBrw-2020. https://www.unb.ca/cic/datasets/dohbrw-2020.html. Accessed: 10-Oct-2021.
[3] DoHlyzer. https://github.com/ahlashkari/DoHlyzer. Accessed: 10-Oct-2021.
[4] DoHMeter. https://github.com/ahlashkari/DOHlyzer/tree/master/DoHMeter. Accessed: 10-Oct-2021.
[5] Impact Cyber Trust. https://www.impactcybertrust.org. Accessed: 6-Mar-2021.
[6] Tranalyzer. https://tranalyzer.com. Accessed: 19-Sep-2021.
[7] AutoML: TPOT. http://automl.info/tpot/, 2016. Accessed: Nov-2021.
[8] Introduction to Genetic Algorithms. https://towardsdatascience.com/introduction-to-genetic-algorithms-including-example-code-e396e98d8bf3, 2017. Accessed: 21-Nov-2021.
[9] Gini coefficient. https://en.wikipedia.org/wiki/Gini\_coefficient, 2021. Accessed: 17-Nov-2021.
[10] HTTPS encryption on the web. https://transparencyreport.google.com/https/overview?hl=en, 2021. Accessed: 13-Nov-2021.
[11] E. Alpaydin. Introduction to machine learning. MIT Press, 2014.
[12] Epistasis Lab at UPenn. GitHub repository of TPOT tool. https://github.com/EpistasisLab/tpot, 2018. Accessed: 1-Nov-2021.
[13] E. Sandi Aung and H. Yamana. Url-based phishing detection using the entropy of non-alphanumeric characters. In Proceedings of the 21st International Conference on Information Integration and Web-based Applications & Services, iiWAS 2019, Munich, Germany, December 2–4, 2019, pages 385–392. ACM, 2019.
[14] Y. M. Banadaki. Detecting malicious dns over https traffic in domain name system using machine learning classifiers. In Journal of Computer Science and Applications, pages 46–55. Science and Education Publishing, 2020.
[15] M. Behnke, N. Briner, D. Cullen, K. Schwerdtfeger, J. Warren, R. Basnet, and T. Doleck. Feature engineering and machine learning model comparison for malicious activity detection in the dns-over-https protocol. IEEE Access, 9:129902–129916, 2021.
[16] P. Berezinski, J. Pawelec, M. Malowidzki, and R. Piotrowski. Entropy-based internet traffic anomaly detection: A case study. In Wojciech Zamojski, Jacek Mazurkiewicz, Jaroslaw Sugier, Tomasz Walkowiak, and Janusz Kacprzyk, editors, Proceedings of the Ninth International Conference on Dependability and Complex Systems DepCoS-RELCOMEX. June 30 – July 4, 2014, Brunów, Poland, volume 286 of Advances in Intelligent Systems and Computing, pages 47–58. Springer, 2014.
[17] L. Bernaille and R. Teixeira. Early recognition of encrypted applications. In Steve Uhlig, Konstantina Papagiannaki, and Olivier Bonaventure, editors, Passive and Active Network Measurement, 8th Internatinoal Conference, PAM 2007, Louvain-la-neuve, Belgium, April 5-6, 2007, Proceedings, volume 4427 of Lecture Notes in Computer Science, pages 165–175. Springer, 2007.
[18] T. Böttger, F. Cuadrado, G. Antichi, E. Leão Fernandes, G. Tyson, I. Castro, and S. Uhlig. An empirical study of the cost of dns-over-https. In Proceedings of the Internet Measurement Conference, IMC 2019, Amsterdam, The Netherlands, October 21-23, 2019, pages 15–21. ACM, 2019.
[19] K. Bumanglag and H. Kettani. On the impact of DNS over HTTPS paradigm on cyber systems. In 3rd International Conference on Information and Computer Technologies, ICICT 2020, San Jose, CA, USA, March 9-12, 2020, pages 494–499. IEEE, 2020.
[20] S. Burschka and B. Dupasquier. Tranalyzer: Versatile high performance network traffic analyser. In 2016 IEEE Symposium Series on Computational Intelligence, SSCI 2016, Athens, Greece, December 6-9, 2016, pages 1–8. IEEE, 2016.
[21] A.J. Campbell and N. Zincir-Heywood. Exploring tunneling behaviours in malicious domains with self-organizing maps. In 2020 IEEE Symposium Series on Computational Intelligence, SSCI 2020, Canberra, Australia, December 1–4, 2020, pages 1419–1426. IEEE, 2020.
[22] A. Das, M. Shen, M. Shashanka, and J. Wang. Detection of exfiltration and tunneling over DNS. In Xuewen Chen, Bo Luo, Feng Luo, Vasile Palade, and M. Arif Wani, editors, 16th IEEE International Conference on Machine Learning and Applications, ICMLA 2017, Cancun, Mexico, December 18-21, 2017, pages 737–742. IEEE, 2017.
[23] John W. Dorfinger P., Panholzer G. Real-time detection of encrypted traffic based on entropy estimation. Master’s thesis, 2011.
[24] Dheeru Dua and Casey Graff. UCI Machine Learning Repository. http://archive.ics.uci.edu/ml, 2017. Accessed: 15-Oct-2021.
[25] Claude E.Shannon. Prediction and entropy of printed english. Bell system technical journal, 30:50–64, January 1951.
[26] Tyrell Fawcett. Exfild: a tool for the detection of data exfiltration using entropy and encryption characteristics of network traffic. Master’s thesis, University of Delaware, 2010.
[27] L. Ferreira, A. Luiz Pilastri, C. Manuel Martins, P. Miguel Pires, and P. Cortez. A comparison of automl tools for machine learning, deep learning and xgboost. In International Joint Conference on Neural Networks, IJCNN 2021, Shenzhen, China, July 18–22, 2021, pages 1–8. IEEE, 2021.
[28] F. Haddadi and N. Zincir-Heywood. Benchmarking the effect of flow exporters and protocol filters on botnet traffic classification. IEEE Syst. J., 10(4):1390–1401, 2016.
[29] J. Hale. TPOT Automated Machine Learning in Python. https://towardsdatascience.com/tpot-automated-machine-learning-in-python-4c063b3e5de9, 2018. Accessed: 1-Nov-2021.
[30] D. Hjelm. A New Needle and Haystack: Detecting DNS over HTTPS Usage. https://www.sans.org/reading-room/whitepapers/dns/needle-haystack-detecting-dns-https-usage-39160. Accessed: 10-May-2021.
[31] Arash Habibi Lashkari Iman Sharafaldin and Ali A. Ghorbani. CIC-IDS 2017. https://www.unb.ca/cic/datasets/ids-2017.html. Accessed: 5-Mar-2021.
[32] J.Ahmed, H. Habibi Gharakheili, Q. Raza, C. Russell, and V. Sivaraman. Real-time detection of DNS exfiltration and tunneling from enterprise networks. In Joe Betser, Carol J. Fung, Alex Clemm, Jérôme François, and Shingo Ata, editors, IFIP/IEEE International Symposium on Integrated Network Management, IM 2019, Washington, DC, USA, April 09–11, 2019, pages 649–653. IFIP, 2019.
[33] S. Khanchi, A. Vahdat, M. I. Heywood, and Nur Zincir-Heywood. On botnet detection with genetic programming under streaming data label budgets and class imbalance. Swarm Evol. Comput., 39:123–140, 2018.
[34] Y. Khodjaeva and N. Zincir-Heywood. Network flow entropy for identifying malicious behaviours in DNS tunnels. In Delphine Reinhardt and Tilo Müller, editors, ARES 2021: The 16th International Conference on Availability, Reliability and Security, Vienna, Austria, August 17-20, 2021, pages 72:1–72:7. ACM, 2021.
[35] A. Khormali, J. Park, H. Alasmary, A. Anwar, M. Saad, and D. A. Mohaisen. Domain name system security and privacy: A contemporary survey. Comput. Networks, 185:107699, 2021.
[36] Kh.Shahbar and N. Zincir-Heywood. How far can we push flow analysis to identify encrypted anonymity network traffic? In 2018 IEEE/IFIP Network Operations and Management Symposium, NOMS 2018, Taipei, Taiwan, April 23-27, 2018, pages 1–6. IEEE, 2018.
[37] A. Lakhina, M. Crovella, and Ch. Diot. Mining anomalies using traffic feature distributions. In R. Guérin, R. Govindan, and G. Minshall, editors, Proceedings of the ACM SIGCOMM 2005 Conference on Applications, Technologies, Architectures, and Protocols for Computer Communications, Philadelphia, Pennsylvania, USA, August 22-26, 2005, pages 217–228. ACM, 2005.
[38] D. Lambion, M. Josten, F. G. Olumofin, and M. De Cock. Malicious DNS tunneling detection in real-traffic DNS data. In X. Wu, Ch. Jermaine, L. Xiong, X. Hu, O. Kotevska, S. Lu, W. Xu, S. Aluru, C. Zhai, E. Al-Masri, Zh. Chen, and J. Saltz, editors, 2020 IEEE International Conference on Big Data (IEEE BigData 2020), Atlanta, GA, USA, December 10–13, 2020, pages 5736–5738. IEEE, 2020.
[39] Duc C. Le and N. Zincir-Heywood. A frontier: Dependable, reliable and secure machine learning for network/system management. J. Netw. Syst. Manag., 28(4):827–849, 2020.
[40] Duc C. Le, N. Zincir-Heywood, and M. I. Heywood. Data analytics on network traffic flows for botnet behaviour detection. In 2016 IEEE Symposium Series on Computational Intelligence, SSCI 2016, Athens, Greece, December 6–9, 2016, pages 1–7. IEEE, 2016.
[41] Ch. Lu, B. Liu, Zh. Li, Sh. Hao, H. Duan, M. Zhang, Ch. Leng, Y. Liu, Z. Zhang, and J. Wu. An end-to-end, large-scale measurement of dns-over-encryption: How far have we come? In Proceedings of the Internet Measurement Conference, IMC 2019, Amsterdam, The Netherlands, October 21–23, 2019, pages 22–35. ACM, 2019.
[42] M. Nidhal Mejri and J. Ben-Othman. Entropy as a new metric for denial of service attack detection in vehicular ad-hoc networks. In Ravi Prakash, Azzedine Boukerche, Cheng Li, and Falko Dressler, editors, 17th ACM International Conference on Modeling, Analysis and Simulation of Wireless and Mobile Systems, MSWiM’14, Montreal, QC, Canada, September 21–26, 2014, pages 73–79. ACM, 2014.
[43] M.MontazeriShatoori, L. Davidson, G. Kaur, and A. Habibi Lashkari. Detection of doh tunnels using time-series classification of encrypted traffic. In IEEE Intl Conf on Dependable, Autonomic and Secure Computing, Intl Conf on Pervasive Intelligence and Computing, Intl Conf on Cloud and Big Data Computing, Intl Conf on Cyber Science and Technology Congress, DASC/PiCom/CBDCom/CyberSciTech 2020, Calgary, AB, Canada, August 17-22, 2020, pages 63–70. IEEE, 2020.
[44] R. S. Olson, N. Bartley, R. J. Urbanowicz, and J. H. Moore. Evaluation of a tree-based pipeline optimization tool for automating data science. In Tobias Friedrich, Frank Neumann, and Andrew M. Sutton, editors, Proceedings of the 2016 on Genetic and Evolutionary Computation Conference, Denver, CO, USA, July 20–24, 2016, pages 485–492. ACM, 2016.
[45] F. Pacheco, E. Exposito, M. Gineste, C. Baudoin, and J. Aguilar. Towards the deployment of machine learning solutions in network traffic classification: A systematic survey. IEEE Commun. Surv. Tutorials, 21(2):1988–2014, 2019.
[46] R. Raghav, Pratheesh, K. Shedbalkar, Minal Moharir, N Deepamala, P Ramakanth Kumar, and MGP Tanmayananda. Analysis and detection of malicious activity on doh traffic. In 2021 2nd Global Conference for Advancement in Technology (GCAT), pages 1–5, 2021.
[47] M. Seufert, R. Schatz, N. Wehner, B. Gardlo, and P. Casas. Is QUIC becoming the new tcp? on the potential impact of a new protocol on networked multimedia qoe. In 11th International Conference on Quality of Multimedia Experience QoMEX 2019, Berlin, Germany, June 5–7, 2019, pages 1–6. IEEE, 2019.
[48] I. Sharafaldin, A. Habibi Lashkari, and A. A. Ghorbani. Toward generating a new intrusion detection dataset and intrusion traffic characterization. In Paolo Mori, Steven Furnell, and Olivier Camp, editors, Proceedings of the 4th International Conference on Information Systems Security and Privacy, ICISSP 2018, Funchal, Madeira – Portugal, January 22–24, 2018, pages 108–116. SciTePress, 2018.
[49] S.K. Singh and P.D. Roy. Detecting malicious dns over https traffic using machine learning. In 2020 International Conference on Innovation and Intelligence for Informatics, Computing and Technologies (3ICT), pages 1–6, 2020.
[50] Georgia Tech. GT Malware Passive DNS Data Daily Feed. http://dx.doi.org/10.23721/102/1354027. Accessed: 6-Mar-2021.
[51] M. Zhou, Sh. Zhang, Y. Qiu, H. Luo, and Zh. Wu. Entropy-based spammer detection. In Proceedings of the 10th International Conference on Internet Multimedia Computing and Service, Nanjing, China, August 17–19, 2018, pages 43:1–43:6. ACM, 2018.
Biographies

Yulduz Khodjaeva has recently received her Master of Computer Science degree from Dalhousie University, Canada. During her studies, she carried out research in the cybersecurity area, particularly the detection of malicious behaviours in DNS tunnels. She published her conference paper at ARES 2021: the 16th International Conference on Availability, Reliability and Security. Currently, Yulduz is working as a Software Developer at EY Canada.

Nur Zincir-Heywood is a University Research Professor of Computer Science at Dalhousie University. Her research interests include machine learning for cyber security, and network/service operations and management. She serves as an Associate Editor of the IEEE Transactions on Network and Service Management and Wiley International Journal of Network Management. She also promotes information communication technologies to wider audiences as a tech columnist for CBC Information Morning and a Board Member on CS-Can/INFO-Can.

Ibrahim Zincir is an Assistant Professor in the Department of Software Engineering at Izmir University of Economics. Dr. Zincir received his Ph.D. in Computer Engineering from Plymouth University with a focus on data mining for secure mobile networks. He is a member of the IEEE and regularly promotes software engineering to a wider audience through several media outlets. His research interests include data mining, machine learning, mobile networks and web centric business applications.
Journal of Cyber Security and Mobility, Vol. 11_3, 461–496.
doi: 10.13052/jcsm2245-1439.1135
© 2022 River Publishers