Monitoring and Identification of Abnormal Network Traffic by Different Mathematical Models
Bing Bai
Shaanxi Police College, Xi’an, Shaanxi 710021, China
E-mail: tuibai36024@163.com
Received 23 June 2022; Accepted 05 October 2022; Publication 03 December 2022
Abstract
The presence of anomalous traffic on the network causes some dangers to network security. To address the issue of monitoring and identifying abnormal traffic on the network, this paper first selected the traffic features with the mutual information-based method and then compared different mathematical models, including k-Nearest Neighbor (KNN), Back-Propagation Neural Network (BPNN), and Elman. Then, parameters were optimized by the Grasshopper Optimization Algorithm (GOA) based on the defects of BPNN and Elman to obtain GOA-BPNN and GOA-Elman models. The performance of these mathematical models was compared on UNSW-UB15. It was found that the KNN model had the worst performance and the Elman model performed better than the BPNN model. After GOA optimization, the performance of the models was improved. The GOA-Elman model had the best performance in monitoring and recognizing abnormal traffic, with an accuracy of 97.33%, and it performed well in monitoring and recognizing different types of traffic. The research results demonstrate the reliability of the GOA-Elman model, providing a new approach for network security.
Keywords: Computation mathematical model, abnormal traffic, monitoring, recognition, neural network.
1 Introduction
With the popularity of the network, more and more enterprises and individuals are saving important data online, leading to a traffic increase on the network, but at the same time, the traffic becomes more complicated, which brings a greater challenge to traffic analysis. The presence of abnormal traffic on the network occupies bandwidth resources, causes congestion and consumes a lot of memory, Central Processing Unit (CPU), etc., making the network unable to provide normal services. Monitoring and identifying abnormal network traffic is a very important task for network security [1]. By monitoring and identifying abnormal traffic on the network, abnormalities can be detected timely to ensure the transmission of useful packets better, thus enabling smooth network operation. With the development of technology, many mathematical models have been applied in the monitoring and identification of abnormal network traffic [2]. Through research on big data, abnormal traffic is monitored and identified using neural networks, machine learning, deep learning, and other methods. However, among the current studies on network anomaly traffic monitoring and identification, most of them focus on the analysis of one method and improvement of algorithm performance through improvement, optimization, etc. For example, Singh et al. [3] designed an online sequential limit learning machine (OS-ELM) approach, conducted experiments on NSL-KDD 2009, and found that the algorithm had an accuracy of 98.66% and a false alarm rate of 1.74%. Liu et al. [4] designed a math method for part matching of immune elements, which can evolve in parts, and found through experiments that the method had a good adaptive performance. Roselin et al. [5] used an optimized deep clustering (ODC) algorithm combined with a deep autoencoder to detect malicious network traffic and found through experiments that the method performed well. Nie et al. [6] proposed a method combining convolutional neural networks and reinforcement learning for anomaly detection of in-vehicle self-organizing networks and found that it was effective through experiments. Li et al. [7] proposed a model integrated temporal and spatial features using a three-layer parallel network structure, conducted experiments on ISCX-IDS 2012 and CICIDS 2017 datasets, and found that the method improved detection accuracy. Ma et al. [8] combined multi-scale Deep-CapsNet and adversarial reconstruction, optimized Deep-CapsNet with multi-scale convolution capsules, reduced noise interference with a adversarial training strategy, and found through experiments that the method showed better accuracy in two-classification and multi-classification. Zhang et al. [9] designed a parallel cross convolutional neural network integrating two branch convolutional neural networks to detect unbalanced abnormal traffic and found through experiments that the method spent less detection time and achieved better accuracy. Pan et al. [10] proposed a density and distance-based K-means algorithm and found through experiments that the method was feasible and stable. Lei et al. [11] studied low-rate distributed denial-of-service (LDDoS) attacks and designed a signal processing technique based on wavelet transform. They found that the technique effectively identified LDDoS. Li et al. [12] proposed an active defense-based router anomaly traffic detection strategy for the problem of single router anomaly arbitration information in mimetic defense and found through experiments that the method effectively detected network attacks. Ding et al. [13] designed an efficient bi-directional simple recurrent unit (BiSRU) and compressed the original high-dimensional features by stacked sparse autoencoder (sSAE). They found through experiment that it was advantageous in terms of accuracy and training time. Liu et al. [14] proposed a leaf node density ratio-based detection method for unknown anomalous network traffic data and found that the method had good accuracy and efficiency by comparing it with methods such as extended isolated forest. Compared with the recent literature, in addition to improving traditional methods (improving BPNN and Elman with the grasshopper optimization algorithm (GOA) for monitoring and identifying anomalous network traffic, this paper also conducted a comparison between multiple methods to more strongly demonstrate the advantages of a method, which is a better reference for network monitoring.
2 Monitoring Identification Methods for Abnormal Traffic on the Network
The sources of abnormal traffic in the network can be divided into two types, one is caused by the network itself, such as unreasonable network structure, equipment unavailability, etc., and the other is caused by attacks on the network, which is also the object of abnormal traffic monitoring and identification. Currently, common attacks are as follows.
(1) Distributed Denial of Service (DDoS) [15]: Distributed, large-scale network attacks launched by multiple attackers on one or more hosts, causing the hosts to overload and crash. It is highly hazardous.
(2) Remote to Local (R2L): Exploit the system vulnerability to remotely log in to the host and gain privileges to achieve some illegal operations.
(3) Probe: Scan the target’s IP, port, etc., and conduct targeted attacks on the network.
(4) User to Root (U2R): Exploit system vulnerabilities to gain access and steal important information.
In the network, there are large differences in the characteristics of abnormal traffic and normal traffic, and these characteristics can be learned through mathematical models to distinguish them.
3 Different Mathematical Models
The dimensionality of network traffic data is large [16]. During monitoring and recognition, if all the features are used in the calculation, the recognition efficiency will be low; therefore, before applying the mathematical model for monitoring and recognition, this paper first uses the mutual information (MI) method [17] to select the features. For a feature set, it is assumed that the target class is , the candidate feature subset is , and the candidate feature subset is . The calculation formula is:
| (1) |
where is the penalty factor, whose value is generally set as 0.5. refers to the correlation between the candidate features and the selected features.
| (2) |
where refers to the correlation between the candidate features and the target class:
| (3) |
By calculating the mutual information value of every feature, the obtained results are ranked, and then the top k features with the largest values are selected to reconstruct the data set. Then, the network traffic is monitored and identified using a mathematical model.
For the monitoring and recognition of network traffic, this paper compares several different mathematical models, as follows.
(1) KNN mathematical model The KNN model is a commonly used pattern recognition algorithm [18] to distinguish anomaly recognition by comparing distances, which has been widely used in information retrieval and data classification [19]. Its principle is as follows. For a datum to be recognized, K data that are the closest to the recognized datum are found and compared to determine whether the datum is anomalous or not. The distance is usually Euclidean distance:
| (4) |
It is used in the monitoring and recognition of network traffic. It is assumed that there are data and features, then there is a matrix: . The matrix of data to be monitored and recognized is: . The distance of the corresponding data in the two matrices is calculated to obtain the distance matrix: . Let the distance between the normal data matrices be . is compared with T. If , then the data are normal, otherwise they are abnormal.
(2) BPNN mathematical model The BPNN model is one of the most widely used neural network models [20], with strong self-learning and fault-tolerance capabilities. The classical BPNN model has a 3-layer structure. For a given training set , let the desired output of the BPNN model be . The input and output of the hidden layer can be written as:
| (5) | ||
| (6) |
where is the weight of the input layer to the hidden layer and is the threshold value. Similarly, the input and output of the output layer can be written as:
| (7) | ||
| (8) |
where is the weight of the implied layer to the output layer and is the threshold value.
The BPNN model adjusts the weights and thresholds by back-propagation of the error to bring the error to the target value. The error is calculated by the following formula:
| (9) |
(3) GOA-BPNN mathematical model The main drawback of the BPNN model is that it is easy to fall into local minimum and has slow convergence. This paper finds the optimal weights and thresholds through the GOA to optimize the BPNN model to obtain the GOA-BPNN model.
The principle of the GOA is the predatory behavior of grasshoppers [21]. The process of searching for food is divided into two phases, exploration and exploitation, corresponding to global and local search. It is assumed the size of a population is . The location of grasshopper is written as: , where is the social interaction force, is the gravity of the grasshopper, and is the wind force on the grasshopper. Among all the parameters, has the greatest effect on the position of the grasshopper, and its calculation formula is:
| (10) |
where refers to the distance of grasshoppers and , , is the unit vector, , and function is the social attribute intensity, , where refers to the strength of attraction, usually, and is the attraction length scale, usually.
To simplify the model, it is assumed that the wind direction is always optimal and the grasshopper’ gravity is negligible. Scaling factor is added to optimize the search capability of the algorithm. The position update formula of the grasshopper is:
| (11) | |
| (12) |
where and are the upper and lower limits of the -dimensional data, is the current optimal solution, is the total number of iterations, is the number of current iterations, is usually set as 0.00001, and is usually set as 1.
In the GOA-BPNN model, the GOA is first initialized. The population size and number of iterations are set. The fitness function of the GOA is defined as the error of the BPNN, and then the GOA algorithm is used to optimize the parameters of the BPNN. The results are input into the BPNN to obtain the GOA-BPNN model. The GOA-BPNN model is trained using data.
(4) Elman mathematical model Elman neural network [22] is obtained by adding an association layer to a BPNN, which has functions of storage and delay and improved ability to process information. For Elman, it is assumed that at time , the output of the output layer is , the vector of nodes in the hidden layer is , and the vector from the hidden layer to the association layer is . The specific expressions are:
| (13) | |
| (14) | |
| (15) |
where is the input layer vector, , , and are the weights between the layers, is the linear function, and is an S function. The training method of the Elman model is the same as that of the BPNN model; therefore, it also has the problem of slow convergence and requires parameter optimization.
(5) GOA-Elman mathematical model Referring to the GOA-BPNN model, the parameters of the Elman model are optimized by Elman. First, the population is initialized, and the fitness value is calculated. Then, the optimal parameters of the Elman model are found by continuous updating, and the obtained parameters are used as the initial parameters of the Elman model to obtain the GOA-Elman mathematical model to monitor and identify the abnormal network traffic.
4 Experiment and Analysis
4.1 Experimental Setup
The experimental environment was an Intel(R)Core(TM)i7-37703.40GHz CPU, 4 GB memory, and Windows 10 operating system. The experiments were conducted in the MATLAB R2013a environment. Programming was performed in Eclipse using Java language. The experimental dataset used was UNSW-NB15 [23], including 2,540,044 data. The experimental dataset is shown in Table 1. In addition to normal traffic, nine types of attacks were included, and every data has 49 features, as shown in Table 2. When monitoring and identifying abnormal traffic with a model, feature selection was performed first, and the filtered features were used as input to the mathematical model for training. Then, the performance of the model was tested on the test set.
Table 1 UNSW-NB15 data set
| Training Set | Test Set | |
| Normal | 56000 | 37000 |
| Fuzzers | 18184 | 6062 |
| Analysis | 2000 | 677 |
| Backdoors | 1746 | 583 |
| DoS | 12264 | 4089 |
| Exploits | 33393 | 11132 |
| Generic | 40000 | 18871 |
| Reconnaissance | 10491 | 3496 |
| Shellcode | 1133 | 378 |
| Worms | 130 | 44 |
| Total | 175341 | 82332 |
Table 2 Feature descriptions of the UNSW-NB15 dataset
| Category | Name |
| Flow Features | srcip |
| sport | |
| dstip | |
| dsport | |
| proto | |
| Base Features | state |
| dur | |
| sbytes | |
| dbytes | |
| sttl | |
| dttl | |
| sloss | |
| dloss | |
| service | |
| sload | |
| dload | |
| spkts | |
| dpkts | |
| Content Features | swin |
| dwin | |
| stcpb | |
| dtcpb | |
| smeansz | |
| dmeansz | |
| trans_depth | |
| res_bdy_len | |
| Time Features | sjit |
| djit | |
| stime | |
| ltime | |
| sintpkt | |
| dintpkt | |
| tcprtt | |
| synack | |
| ackdat | |
| General purpose features | is_sm_ips_ports |
| ct_state_ttl | |
| ct_flw_http_mthd | |
| is_ftp_login | |
| ct_ftp_cmd | |
| Connection features | ct_srv_src |
| ct_srv_dst | |
| ct_dst_ltm | |
| ct_src_ ltm | |
| ct_src_dport_ltm | |
| ct_dst_sport_ltm | |
| ct_dst_src_ltm | |
| Labelled Features | attack_cat |
| Label |
In the neural network models, the three-layer structure was used. The node in the input layer was the feature dimension, the node in the output layer was the type of abnormal traffic, and the node in the hidden layer was determined using the formula:
| (16) | |
| (17) |
In the GOA algorithm, the population size was set as 20, and the maximum number of iterations was 100. Before monitoring and recognizing, the feature was selected using the mutual information method, and the top 10 ranked features were used as the input to the mathematical model.
4.2 Evaluation Indicators
The evaluation of different algorithmic models was based on the confusion matrix (Table 3). The evaluation indicators are shown in Table 4.
Table 3 Confusion matrix
| Model Output | ||
| Actual Category | Normal | Abnormal |
| Normal | TP | FN |
| Abnormal | FP | TN |
Table 4 Evaluation indicators for mathematical models
| Evaluation Indicator | Calculation Formula |
| Accuracy | |
| Recall rate | |
| Precision | |
| F1 value |
4.3 Experimental Results
When using mutual information for feature selection, the top k features with the largest value of mutual information were retained. The KNN algorithm was used as the basis for comparing the accuracy of the algorithm when the number of retained features varied. The results are shown in Figure 1.
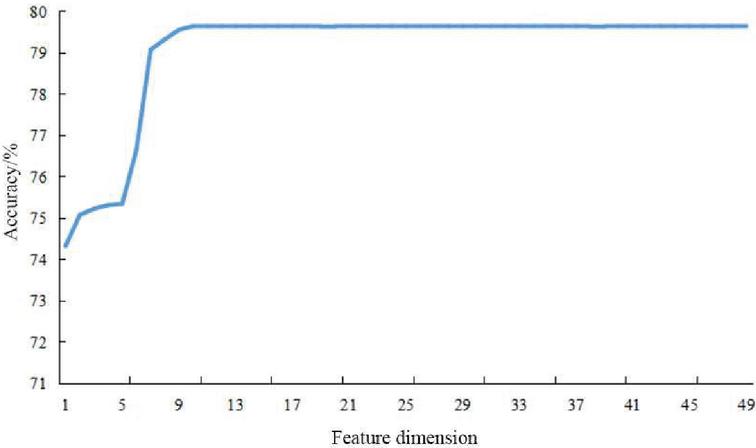
Figure 1 Changes in the accuracy under different feature dimensions.
It was seen from Figure 1 that the accuracy of the KNN algorithm gradually increased with the increase of retained features; when the retained feature dimension was ten, the accuracy of the KNN algorithm reached 79.64%, and it always remained stable after ten feature dimensions. This result indicated that the algorithm could achieve high accuracy when ten features were retained. Therefore, the feature dimension was set as ten in subsequent experiments.
The operation time before and after feature selection was compared. Different mathematical models were used. The inputs of the model were the 49-dimensional feature without feature selection and ten-dimensional features with feature selection. The comparison of the operation time is shown in Figure 2.
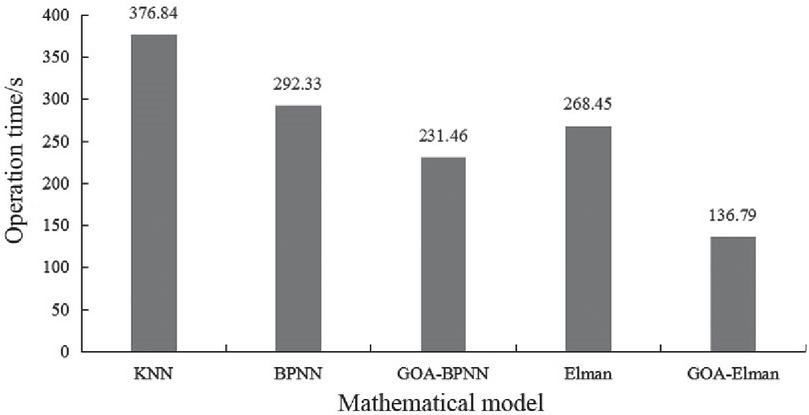
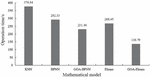
Figure 2 Comparison results of operation time.
It was seen from Figure 2 that the operation time when the 49-dimensional feature was used as the model input was significantly longer than that when the ten-dimensional feature was used. Taking the KNN algorithm as an example, the operation time was 564.36 s when the 49-dimensional feature was used and 376.84 s when the ten-dimensional feature was used, i.e., the latter saved 33.23% of time compared to the former, verifying that feature selection was effective to improve the operation efficiency. Then, when the ten-dimensional feature was used as the model input, the KNN model had the longest operation time, 376.84 s, followed by the BPNN model (292.33 s). Compared with the BPNN model, the Elman model has less operation time, 268.45 s, indicating that the Elman model was better than the BPNN model in terms of convergence speed. After GOA optimization, the operation time of both neural network models was reduced significantly. The operation time of the GOA-BPNN model was 231.46 s, which was 20.82% less than that of the BPNN model; the operation time of the GOA-Elman model was 136.79 s, which was 49.04% less than that of the Elman model. In conclusion, the GOA-Elman model has the greatest advantage in terms of operation time.
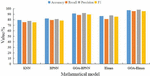
The performance of different mathematical models for monitoring and identifying abnormal network traffic was compared, and the results are shown in Figure 3.

Figure 3 Comparison results of abnormal network traffic monitoring and recognition performance.
It was seen from Figure 3 that, in general, all the indicators of the KNN model were below 80%, which indicated that it had an average performance in monitoring and identifying abnormal traffic. The comparison of the four neural network models showed that the BPNN model the Elman model. The accuracy of the Elman model and BPNN model were 86.77% and 82.33%, respectively, and the accuracy of the Elman model was 4.44% higher than that of the BPNN model. The BPNN model the GOA-BPNN model, and the Elman mode the GOA-Elman model, indicating that the performance of both models was improved after GOA optimization. The accuracy of the GOA-Elman model was 97.33%, which was 10.56% higher than that of the Elman model. The recall rate of the GOA-BPNN model was 95.64%, which was 14.52% higher than that of the Elman model. The precision of the GOA-Elman mode was 98.36%, which was 10.42% higher than that of the Elman model. The F1 value of the GOA-Elman model was 95.78%, which was 10.11% higher than that of the Elman model. The results suggested that the GOA-Elman model was reliable in monitoring and recognizing abnormal traffic.
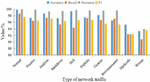
The monitoring and recognition results of different types of traffic with the GOA-Elman model are shown in Figure 4.

Figure 4 The monitoring and recognition results of different traffics with the GOA-Elman mathematical model.
It was seen from Figure 4 that all the data of the model were above 90%. Overall, the model performed well in monitoring and identifying different types of traffic. Taking Normal as an example, the accuracy was 99.87%, and the F1 value was 97.64%. In comparison, the model performed slightly lower on Shellcode and Worms, with an F1 value of 92.36% for Shellcode and 93.61% for Worms, which may be because the small number of samples for these two types made the model training inadequate. In general, the GOA-Elman mathematical model could monitor and identify different types of traffic accurately.
5 Analysis
Network traffic is an important expression of the current network situation. Analyzing network traffic can help network managers to detect attacks timely and take appropriate means to intercept, thereby achieving network security. Therefore, monitoring and identifying abnormal network traffic is very important. Many mathematical models have been applied, and this paper mainly compared and analyzed the performance of several mathematical models.
First, the experimental result showed that feature selection affected the performance of the mathematical model. This paper selected features with the mutual information-based method. Reducing the feature dimension from 49 to 10 improved not only the computational efficiency but also the performance of the mathematical model. The comparison of different mathematical models demonstrated that improving neural network models by the optimization algorithm enhanced the computational efficiency and the monitoring and recognition performance. Among all the compared algorithms, the performance of the KNN model was poor, reflected in a long operation time and a low accuracy of monitoring and recognition. The pairwise comparison showed that the performance of the Elman model was better than that of the BPNN model, so the performance of the GOA-Elman model also outperformed the GOA-BPNN model. It was seen from Figure 3 that the accuracy, recall rate, precision and F1 values of the GOA-Elman model were 97.33%, 95.64%, 98.36% and 95.78%, respectively, which were significantly better than the other three mathematical models.
The results of monitoring and recognizing different types of traffic in the dataset with the GOA-Elman model showed that the model performed the best in recognizing normal traffic and performed poor in recognizing Shellcode and Worms with small volumes, but the overall accuracy and precision were above 90%, which could satisfy the need of abnormal traffic monitoring and recognition in practice.
This paper obtained some outcomes, but there are also some shortcomings. In future research, we need to:
(1) compare more new mathematical models,
(2) conduct experiments on more datasets to further understand the performance of mathematical models,
(3) apply mathematical models in the real network environment to understand their values in practice.
6 Conclusion
This paper introduced several mathematical models for monitoring and recognizing abnormal network traffic and compared these models on the UNSW-NB15 dataset. It was found that the KNN model had the longest operation time; the Elman model outperformed the BPNN model; after GOA optimization, the performance of both BPNN and Elman models was greatly optimized, and the GOA-Elman performed the best. The research verify the reliability of the GOA-Elman model in monitoring and recognizing abnormal network traffic by comparison, which can be further promoted and applied in practice.
References
[1] Yao H, Liu Y, and Chao F. An Abnormal Network Traffic Detection Algorithm Based on Big Data Analysis. International Journal of Computers, Communications & Control (IJCCC), 11(4):567, 2016.
[2] Ma Q, Sun C, Cui B, Cui B, and Jin X. A Novel Model for Anomaly Detection in Network Traffic Based on Kernel Support Vector Machine. Computers & Security, 104(2):102215, 2021.
[3] Singh R, Kumar H, and Singla R K. An intrusion detection system using network traffic profiling and online sequential extreme learning machine. Expert Systems with Applications, 42(22):8609–8624, 2015.
[4] Liu C, Zhang Y, Xie C, Wang D, and Li Z. Network traffic detection based on part matching and section evolution of immune elements. Journal of Physics: Conference Series, 1774(1):012071 (6 pp), 2021.
[5] Roselin A G, Nanda P, Nepal S, and He X. Intelligent Anomaly Detection for Large Network Traffic With Optimized Deep Clustering (ODC) Algorithm. IEEE Access, 9:47243–47251, 2021.
[6] Nie L, Wu Y, Wang H, and Li Y. Anomaly Detection Based on Spatio-Temporal and Sparse Features of Network Traffic in VANETs. IEEE Access, 7:177954–177964, 2019.
[7] Li M, Han D, Yin X, Liu H, and Li D. Design and Implementation of an Anomaly Network Traffic Detection Model Integrating Temporal and Spatial Features. Security and Communication Networks, (1):1–15, 2021.
[8] Ma W, Zhang Y, Guo J, and Yu Q. Few-Shot Abnormal Network Traffic Detection Based on Multi-scale Deep-CapsNet and Adversarial Reconstruction. International Journal of Computational Intelligence Systems, 14(1):1–25, 2021.
[9] Zhang Y, Xu C, Guo D, Song M, Teng Y, and Wang X. PCCN: Parallel Cross Convolutional Neural Network for Abnormal Network Traffic Flows Detection in Multi-class imbalanced Network Traffic Flows. IEEE Access, 7:119904–119916, 2019.
[10] Pan F C, Han D Z, and Hu Y. Design and application of real-time network abnormal traffic detection system based on Spark Streaming. International Journal of Embedded Systems, 11(5):562–, 2019.
[11] Lei G, Ji L, Ji R, Cao Y, Wei Y, and Wang H. Can Wavelet Transform Detect LDDoS Abnormal Traffic in Multipath TCP Transmission System?. Security and Communication Networks, 2021(2):1–8, 2021.
[12] Li X, Yi P, Jiang Y, Yu J. A router abnormal traffic detection strategy based on active defense. Journal of Physics Conference Series, 1738: 1–7, 2021.
[13] Ding P, Li J, Wen M, Wang L, and Li H. Efficient BiSRU Combined With Feature Dimensionality Reduction for Abnormal Traffic Detection. IEEE Access, 8:164414–164427, 2020.
[14] Liu H, Liu Z, Liu Y, and Gao X. Abnormal Network Traffic Detection based on Leaf Node Density Ratio. ICCNS 2019: 2019 the 9th International Conference on Communication and Network Security, 69–74, 2019.
[15] Alkasassbeh M. A Novel Hybrid Method for Network Anomaly Detection Based on Traffic Prediction and Change Point Detection. Journal of Computer Science, 14(2):153–162, 2018.
[16] Nakashima M, Sim A, Kim Y, Kim J, and Kim J. Automated Feature Selection for Anomaly Detection in Network Traffic Data. ACM Transactions on Management Information Systems, 12(3):1–28, 2021.
[17] Bhuyan M H, Bhattacharyya D K, and Kalita J K. A Multi-step Outlier-based Anomaly Detection Approach to Network-wide Traffic. Information Sciences, 2016:S0020025516300779, 2016.
[18] Liao T, Lei Z, Zhu T, Zeng S, Li Y, and Yuan C. Deep Metric Learning for K Nearest Neighbor Classication. IEEE Transactions on Knowledge and Data Engineering, PP(99):1–1, 2021.
[19] Joachim W, Rolf B, and Bjrn G. Robust and efficient single-cell Hi-C clustering with approximate k-nearest neighbor graphs. Bioinformatics, 2021(22):22, 2021.
[20] Xu Y. The Abnormal Network Traffic Recognition Method Based on Optimized BP ANN Model. International Journal of Future Generation Communication and Networking, 8(3):61–70, 2015.
[21] Xu Z, Gui W, Heidari A A, Liang G, Chen H, Wu C, Turabieh H, and Mafarja M. Spiral Motion Mode Embedded Grasshopper Optimization Algorithm: Design and Analysis. IEEE Access, 9:71104–71132, 2021.
[22] Raghu S, Sriraam N, and Kumar G P. Classification of epileptic seizures using wavelet packet log energy and norm entropies with recurrent Elman neural network classifier. Cognitive Neurodynamics, 11(1):1–16, 2017.
[23] Moustafa N, and Jill S. UNSW-NB15: a comprehensive data set for network intrusion detection systems (UNSW-NB15 network data set). 2015 Military Communications and Information Systems Conference (MilCIS), 2015:1–6, 2015.
Biography

Bing Bai, born in December 1985, has received the master’s degree in computer technology from Xi’an University of technology in 2019. He is a lecturer and senior engineer. His research interests are network security and network information technology.
Journal of Cyber Security and Mobility, Vol. 11_5, 695–712.
doi: 10.13052/jcsm2245-1439.1153
© 2022 River Publishers