Construction of a Smart City Network Information Security Evaluation Model Based on GRA-BPNN
Xiang Li
Department of Electronic Information Engineering, Lanzhou Vocational Technical College, Lanzhou 730070, China
E-mail: lixiang@lvu.edu.cn
Received 11 August 2022; Accepted 15 November 2022; Publication 31 January 2023
Abstract
In this study, we propose an optimized network information security evaluation GRA-BPNN model based on gray correlation analysis method combined with BP neural network model, and make corresponding optimization for network information security evaluation index. Simulation experiments are conducted to analyze the experimental model, and the simulation results show that the test sample values reach the best training performance at the 7th iteration after 13 iterations, and the R-values in the regression of training results all reach above 0.99, and the data are well-fitted. When the number of training iterations reaches 13, the training gradient is 0.00067928, the value of Mu is 0.001, and the validity test value is 6. The GRA-BPNN model scores 0.028 higher than the GRA method, which is in line with the expected error, and the higher score also proves that the GRA-BPNN model is more comprehensive and specific in its scoring consideration.
Keywords: Smart city, network information security, GRA, BPNN.
1 Introduction
Since the information age, with the rapid development of smart city construction in China, the issue of network information security in smart cities has surfaced as a core issue [1]. To ensure the healthy and sustainable development of smart cities, it is necessary to comprehensively strengthen the construction of information security assurance system, enhance the top-level design of structured and systematic information security, and independently conduct research and equipment development of safe and controllable key technologies to meet their actual information security needs [2]. The requirements of the future information security assurance system of smart cities are the improvement of technical systems and the establishment of a stable management system [3]. On the basis of the organic combination of the three systems, a unified information security centralized operation and maintenance management center is used for control and display, forming an active defense system and a longitudinal defense system as a whole to build a comprehensive, autonomous and controllable information security assurance system for smart cities [4]. It is an undeniable fact that most cities have done a relatively complete job in the construction of defense system, but almost all major cities have not done a good job in the evaluation of the strengths and weaknesses of the defense system [5]. Therefore, this study aims to explore and investigate the method of constructing the evaluation model of network information security in smart cities. The research constructs the network information security evaluation model of safe smart city by processing the existing urban security data indicators and combining GRA and BPNN. Through the model, we can comprehensively evaluate the urban network security attributes and propose targeted improvement suggestions.
2 Related Work
To promote the development of network information security in smart cities, the study of network information security evaluation methods has become the focus topic nowadays, for which researchers at home and abroad have also conducted in-depth research. Liu et al. proposed a radar station intelligence quality evaluation method based on fuzzy back propagation neural network (BPNN), through the analysis of the radar station intelligence production process, characteristics and main influencing factors, established a radar station Intelligence quality evaluation index system, then constructed factor set, evaluation set and affiliation matrix, and designed a fuzzy BP neural network for radar station intelligence quality evaluation with reference to this index system [6]. Lin and his experimental partners proposed a new tandem evaluation method, hierarchical classification model tandem back propagation neural network (BPNN) method, for multi-metal sensors for predicting rice taste quality, which extracts the characteristic current and potential arrays and processes them appropriately to obtain potential phase plane values and current phase plane values as the current phase plane values used as input variables for the rank classification model, and uses the classification and rank values of the sample outputs and potential phase plane values for score prediction in BPNN [7]. Song et al. proposed a hierarchical analysis method to determine the weights of occupational disease hazard identification indicators for the oil industry, which is an occupational disease hazard-prone industry, in order to comprehensively evaluate the hazards of coal mines, and then built a BPNN neural network prediction model based on the identified weight indicator system [8]. Zhang et al. concluded that the traditional BPNN parameter selection is stochastic, making the network prone to local extremes in the computation process, and to address this problem they introduced the bat algorithm (BA) to optimize the parameter selection process of BP neural networks, and applied the algorithm to the evaluation of enterprise business conditions and built the corresponding enterprise business condition evaluation model [9]. Yu and his team used the particle swarm optimization (PSO) algorithm to optimize the BPNN model. A PSO-based BP neural network algorithm (PSO-BPNN) is given and an evaluation model is developed. The model was trained and applied to evaluate the operational effectiveness of energy-efficient power generation dispatch in 10 provinces in China [10].
Cai and other researchers constructed a supply chain risk evaluation model based on BP neural network, explored the factors affecting supply chain risk evaluation, and constructed a supply chain risk evaluation index system. The study showed that BP neural network has unique advantages in solving highly nonlinear problems such as supply chain risk evaluation, and the method can be used as an effective technical tool to determine supply chain risk, which can provide current enterprises with supply chain risk management to provide effective decision support [11]. Liu and his team proposed to apply the rough set theory to objectively evaluate the index weights for the problem of city economic vitality evaluation, screen the main factors affecting the index weights, and then calculate the weights of the corresponding evaluation indexes for each group of cities through multiple linear regression to form a weighted index system, and then Using gray correlation analysis method to rank the cities, the ranking of different cities’ economic vitality level was obtained [12]. Li et al. established a security evaluation index system and ranking from the perspectives of water supply security, social security, economic security and ecological security, based on which the network analysis method (ANP) was applied to the main influencing factors of water security evaluation The weight calculation was carried out, and a water resources security evaluation model was established by combining grey correlation analysis (GRA) to evaluate and analyze the water resources security situation in Guizhou from 2008 to 2018 [13]. Juan et al. proposed an evaluation method based on the technique of similarity ranking of ideal solutions (TOPSIS), and established an evaluation method including economic, social and ecological An evaluation index system of 39 indicators in three categories was established, and on the basis of this index system, an improved TOPSIS method was proposed, which assigns weights to each indicator based on the evaluation score of each indicator and uses gray correlation analysis to reduce the uncertainty in the evaluation process, so as to rank the sustainability level of cities [14]. Yang et al. proposed to evaluate the degree of integration of “Internet industry” in each province of China by using the gray correlation matrix method and established a new evaluation system to assess the degree of integration between industries and the Internet [15]. The team proposed to introduce genetic algorithm to improve BP neural network, solved the problem of slow convergence and easy to fall into local minima when BP neural network was applied to land ecological security evaluation alone, and then established GA-BP neural network to evaluate land ecological security from 2001 to 2015 [16].
Through the in-depth research of many domestic and foreign research scholars on aspects related to evaluation methods such as GRA and BPNN, it can be seen that both GRA and BPNN-based evaluation models perform well and can be used in the evaluation of network information security of smart cities. Therefore, the network information security evaluation model optimized in this study has a certain promotion effect on the construction of smart cities.
3 GRA-BPNN Smart City Network Information Security Evaluation Method Research
3.1 Grey Correlation Analysis Combined with BP Neural Network Algorithm Evaluation Model Design
For the problem of constructing the evaluation model of information security of smart city network, this study uses GRA (Grey Relational Analysis) combined with BP neural network algorithm model construction. Grey Relational Analysis is an effective scheme evaluation method, and its principle is mainly to compare the attribute values of each scheme with the ideal values, and select the scheme with high similarity by measuring the similarity of two vectors [17]. Let be the set of scenarios for decision making, be the set of attributes of the scenarios, be the individual attribute weights, , , and the attribute values under different scenarios are , then the multi-attribute decision matrix formed is shown in Equation (1).
| (1) |
In the information evaluation of multi-attribute decision making, different perspectives need to be used to objectively evaluate things from multiple aspects. The actual information may contain both positive indicators with larger values that are more favorable and negative indicators with smaller values that are more favorable, while the attributes and units of measurement of each information indicator are inconsistent, so the evaluation information should be standardized in a uniform manner. The rating matrix of the decision is standardized to the decision information matrix with the same pointing attribute values, and the standardization method for the positive indicators is shown in Equation (2), and the standardization method for the negative indicators is shown in Equation (3).
| (2) | ||
| (3) |
Then, the optimal solution is selected as the reference standard among each indicator, and the selected optimal decision information is combined into the ideal solution series , in the series . Then the distance between the decision information series of each alternative and the ideal solution series is calculated , which is shown in Equation (4).
| (4) |
Using this method, the maximum value of the distance between the two series and the minimum value are found. Calculate the correlation coefficient between the decision information sequence of each alternative and the ideal scheme, that is, calculate the relationship coefficient matrix of the two sequences. The calculation method is shown in Formula (5).
| (5) |
In Equation (5), is the relative difference between the alternative and the ideal solution under the attribute , and is the discrimination coefficient. The correlation between the decision information series of each alternative and the ideal solution is calculated and multiplied with the weight value of each indicator to obtain its weighted correlation value , as shown in Equation (6).
| (6) |
Finally, the ranking is based on the magnitude of the weighted gray correlation value , and the larger the correlation, the higher the priority of the array. BP neural network whose principle is mainly to simulate the way human brain neurons respond to external stimulus signals, mainly consists of three layers: input layer, hidden layer and output layer (Wang X R et al. 2019) [18]. External stimulus units enter the input layer, which in turn transmits the stimulus units to the hidden layer. The hidden layer relies on the transmission rules and weights of the connections between neurons to deliver the stimulus units to the output layer. The output level outputs the results of the processed stimulus units. Finally, the correct results are compared with the generated results to obtain the error. Through the error, the weights in the neural network are continuously adjusted, and the structure of this learning process is shown in Figure 1.
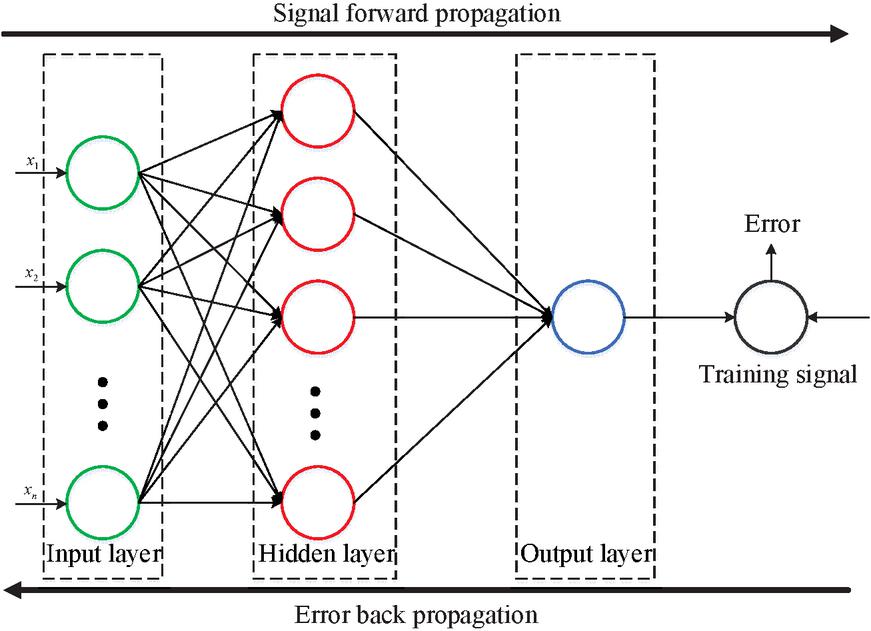
Figure 1 Structure diagram of back propagation neural network.
As shown in Figure 1, the input layer neuron nodes of the BP neural network are , . Let the neuron node of the hidden layer be , , the connection weight between the input layer and the hidden layer be interlayer threshold is , the connection weight between the hidden layer and the output layer be interlayer threshold is , the neuron node of the output layer be , and the desired output value of the output layer be , then the output value of the hidden layer is calculated as shown in Equation (7).
| (7) |
The output layer output value is calculated as shown in Equation (8).
| (8) |
The mean square error of the output value and the expected value is calculated as shown in Equation (9).
| (9) |
When the variance is less than the allowable error or the number of training exceeds the expected number, the training ends, otherwise the variance is corrected and the output layer is corrected for error as shown in Equation (10).
| (10) |
Implicit layer correction error as shown in Equation (11).
| (11) |
The weights of the neurons in each layer are corrected, and the connection weights of the input layer and the hidden layer are corrected according to Equation (3.1), and the connection weights of the hidden layer and the output layer are corrected according to Equation (3.1).
| (12) | ||
| (13) |
The thresholds of the neurons in each layer are corrected, and the interlayer thresholds of the input and hidden layers are corrected according to Equation (3.1), and the interlayer thresholds of the hidden and output layers are corrected according to Equation (3.1).
| (14) | ||
| (15) |
After the correction is completed, the neural signaling process is repeated continuously using new weights and thresholds until the output results reach the upper limit of the number of training for those with allowable errors, and the algorithmic flow of the BP neural network is shown in Figure 2.

Figure 2 Back propagation neural network operation flow chart.
There are some shortcomings in using the GRA method or BPNN method alone to build the intelligent city network information security evaluation model. In order to get a more accurate and effective evaluation model, this study uses the GRA-BPNN method to model in combination with the GRA and BPNN. Based on the GRA method, the original indicators are simplified first, and then the simplified indicators are input into the BPNN for training and simulation to get the final training model. By this combination, the computational speed and accuracy of the evaluation model can be improved. First, we set the evaluation objects as , indicators as , reference numbers as and comparison numbers as . Then calculate their gray correlation coefficients according to the gray correlation analysis method as shown in Equation (16), and then calculate the gray correlation degree as shown in Equation (17) to get the optimal desired output as the desired sample of BPNN .
| (16) | ||
| (17) |
Let the training samples be , is the number of samples, and is the number of input vectors. According to the algorithm flow of BPNN, the error value is calculated, and then the weights and thresholds of each layer are corrected according to the error, and then the comparison is repeated iteratively until the error is lower than the set target.
3.2 Evaluation Index Analysis of Network Information Security in Smart Cities
The entire index system for evaluating network information security in smart cities should be built on four principles: scientific, holistic, systematic, and normative (Li R et al. 2019) [19]. The overall tone of the evaluation index construction is determined in order to classify and stratify the overall index system on this basis, and the one at the top is the important target, which is dispersed to the next level in order, which are the primary and secondary indexes. This study sets the second-level indicators as the bottom level, which can be directly evaluated in specific applications or actual scenarios. The indicator system is divided into three layers, which are the target layer, the first-level indicators and the second-level indicators. Referring to a large amount of literature and official documents on smart cities and information security, the initial indicator system set in this study is shown in Table 1.
Table 1 Initial index system of smart city network information security evaluation
| Target Layer | Primary Index | Secondary Index |
| Research on information security evaluation of smart city | New information infrastructure security | Construction level of communication network infrastructure |
| New technology infrastructure construction level | ||
| Construction level of computing infrastructure | ||
| Information content | Legitimacy of information content | |
| security | Authenticity of information content | |
| Information content controllability | ||
| Public literacy safety | Completion of safety education and training | |
| Information security knowledge publicity | ||
| Public awareness of network information security | ||
| Data service security | Maturity of data encryption technology | |
| Data backup and recovery capability | ||
| Intrusion detection defense capability | ||
| Information | Data storage technology level | |
| technology security | Technical level of information transmission | |
| Technical level of system protection |
In Table 1, five primary indicators and 15 secondary indicators were initially selected for the evaluation index system of network information security in smart cities, and each indicator was discussed in depth after the construction was completed to discuss whether it was in line with the scientificity and normality. Then, these indicators were invited in the form of a questionnaire survey to experts in smart city network information security to participate in the construction of evaluation indicators. A total of 20 experts were sent questionnaires to this study, and a total of 20 questionnaires were returned, with a return rate of 100%. Combined with the experts’ opinions, the affiliation degree of the indexes was analyzed, and only the indexes with an affiliation degree of 0.5 or more met the scientificity and accuracy and could be used. Let the set of indicators of each level in the evaluation index system be the set of the indicator is , and its affiliation is calculated as shown in Equation (18).
| (18) |
After calculation, it was found that the affiliation degree of five indicators could not reach 0.5, and they were deleted, and the final obtained index system of smart city network information security is shown in Table 2.
Table 2 Smart city network information security evaluation index system
| Target Layer | Primary Index | Secondary Index |
| Research on information security evaluation of | New information infrastructure security | New technology infrastructure construction level |
| smart city | Construction level of computing infrastructure | |
| Information content | Authenticity of information content | |
| security | Information content controllability | |
| Public literacy safety | Information security knowledge publicity | |
| Public awareness of network information security | ||
| Data service security | Maturity of data encryption technology | |
| Intrusion detection defense capability | ||
| Information technology security | Technical level of information transmission | |
| Technical level of system protection |
In Table 2, there are 1 target level indicator, 5 primary indicators and 10 secondary indicators in the amended wisdom city network information security index system. The new information infrastructure measures are the premise of the wisdom city network information security construction and the foundation of the wisdom city information level. Its construction degree is directly related to the degree of information security of the wisdom city network. Its facilities mainly contain two categories: new technology infrastructure category, referring to cloud space, cloud services, etc.; arithmetic infrastructure, referring to data processing, big data computing, etc. Information content security, referring to the security of the information dissemination process, to ensure that information is not intercepted and tampered with in the process of dissemination. Information content security contains two aspects: reliability of information content mainly refers to the distortion of data in smart cities, as the amount of data generated and demanded in the construction of smart cities are extremely large, and human interference in data storage and transmission distorts certain data. Information content control refers to the ability to control information and communication content, develop the direction of building a smart city, and ensure the information security of the smart city communication system. Public literacy evaluation index reflects the public’s ability to identify and protect against security hazards, etc. It mainly relies on two indicators to judge the strength of information security knowledge propaganda and the strength of public network information security awareness. Information security knowledge propaganda refers to information security knowledge popularization online or offline, through which the overall information security prevention awareness of some citizens and personnel of relevant organizations involved in security knowledge propaganda activities is improved, and this part of the population then influences all people in the city to improve public awareness of information protection. When the public recognizes that network information security is to promote the improvement of smart city areas, its risk factor is greatly reduced.
Big data service security is demonstrated in the ability to address risks and defend against threats when providing big data assistance to the public or enterprises. Its main measurement indicators are the maturity of data encryption technology and intrusion prevention detection capability. The maturity of data encryption directly affects the security performance of data, and the more mature encryption technology, undoubtedly the higher its security; intrusion prevention and detection capability is one of the important capabilities to prevent network attacks, which can detect and stop network attacks in time. Information technology security indicators refer to the security of various technologies used to guarantee the processing and storage of information, and its main evaluation indicators are the level of information transmission technology and the level of system protection technology. Information transfer technology mainly refers to the information transfer technology in use, which is the main way for information to play its value and the source of threats. System protection level mainly refers to the protection level of the system in the face of viruses, hackers and other attacks, and is the core index of the network information security evaluation system.
4 GRA-BPNN Smart City Network Information Security Evaluation Model Simulation Experiment and Analysis
The experiment was implemented by MATLAB, and the data were obtained from the evaluation report of the development level of smart cities and the comprehensive report of cybersecurity self-inspection in each region, and the annual data of 10 cities, such as Shenzhen, Hangzhou and Shanghai, in 2018 were screened as the data set. According to the 10 indicators set in this study, the original data are normalized, and the data values after normalization are between , the city names are replaced by C1–C10 in order, and the indicator names are replaced by I1–I10 in order, and the indicator data of 10 cities are normalized as shown in Table 3. In the table, I1 represents the new technology infrastructure construction level. I2 stands for Construction level of computing infrastructure. I3 stands for Authentication of information content. I4 stands for Information content controllability. I5 stands for Information security knowledge public. I6 stands for Public awareness of network information security. I7 stands for Mathematics of data encryption technology. I8 stands for Intrusion detection defense capability. I9 stands for Technical level of information transmission. I10 stands for Technical level of system protection.
Table 3 Index data of each city after normalization
| / | I1 | I2 | I3 | I4 | I5 | I6 | I7 | I8 | I9 | I10 |
| C1 | 0.998 | 0.997 | 0.942 | 0.996 | 0.601 | 0.602 | 0.987 | 0.994 | 0.995 | 0.431 |
| C2 | 0.939 | 0.937 | 0.885 | 0.776 | 0.612 | 0.223 | 0.675 | 0.791 | 0.875 | 0.305 |
| C3 | 0.881 | 0.948 | 0.833 | 0.547 | 0.994 | 0.621 | 0.742 | 0.583 | 0.841 | 0.435 |
| C4 | 0.834 | 0.865 | 0.773 | 0.658 | 0.217 | 0.974 | 0.851 | 0.531 | 0.828 | 0.257 |
| C5 | 0.865 | 0.875 | 0.993 | 0.981 | 0.591 | 0.208 | 0.673 | 0.469 | 0.938 | 0.991 |
| C6 | 0.558 | 0.621 | 0.651 | 0.391 | 0.236 | 0.211 | 0.377 | 0.419 | 0.718 | 0.508 |
| C7 | 0.9343 | 0.551 | 0.288 | 0.282 | 0.218 | 0.213 | 0.162 | 0.418 | 0.671 | 0.162 |
| C8 | 0.748 | 0.103 | 0.348 | 0.003 | 0.214 | 0.212 | 0.468 | 0.371 | 0.562 | 0.783 |
| C9 | 0.498 | 0.281 | 0.535 | 0.439 | 0.212 | 0.213 | 0.228 | 0.254 | 0.829 | 0.418 |
| C10 | 0.442 | 0.029 | 0.408 | 0.393 | 0.211 | 0.245 | 0.289 | 0.114 | 0.897 | 0.473 |
The number of Input Layer neurons is 10 and the number of Output Layer neurons is 1. The general formula of BP neural network structure neurons is , and the number of Hidden Layer neurons is [4, 13], which contains 10 neural network structures, and the 10 neural network structures are trained separately to compare the optimal. The network structure is shown in Figure 3.
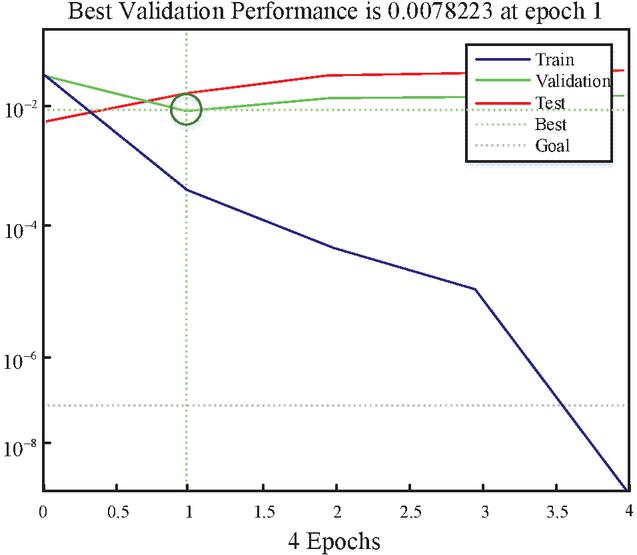
Figure 3 Training results with 11 hidden layer nodes.
As shown in Figure 3, the training performance is optimal when the number of neuron nodes in the hidden layer is 11, yielding an optimal solution of 0.0078223, after 4 iterations at this point. The different training results are classified after the training is completed. indicates poor, indicates fair, indicates good, and indicates excellent. Continue the simulation training of GRA-BPNN model using MATLAB software, create the network net newff (p1,T,11); set the training number to 5000, set the convergence error to and set the learning rate to . The normalized data in Table 3 are used as the training sample data for the GRA-BPNN model for input, and the average value obtained using the gray correlation analysis is used as the test sample input, and the simulation results obtained are shown in Figure 4.
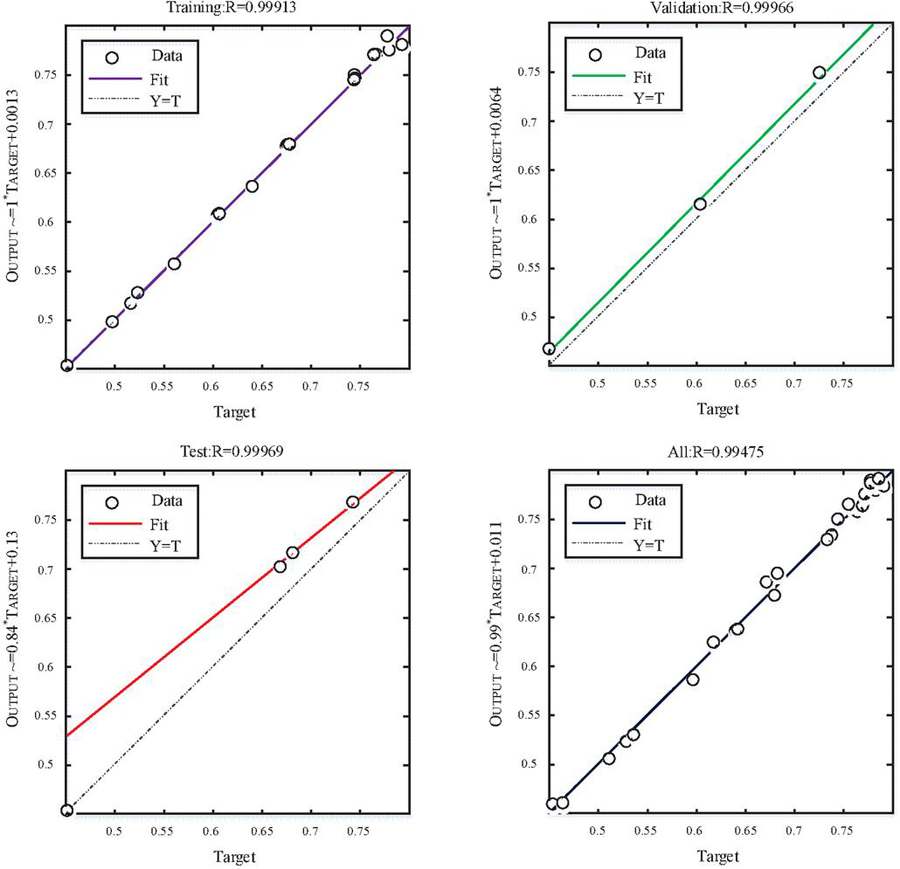
Figure 4 GRA-BPNN model simulation result output.
In Figure 4, the Train solid line represents the training error, the Validation solid line represents the validation error, and the Test solid line represents the testing error. From the experimental results, it can be seen that the sample underwent a total of 13 iterations and reached the best training performance at the 7th iteration, and its actual output results were very close to the expected, and the difference between them was within the expected error, and the regression diagram of the training results is shown in Figure 5, in which the R values all reached above 0.99, indicating a good fit of the data.
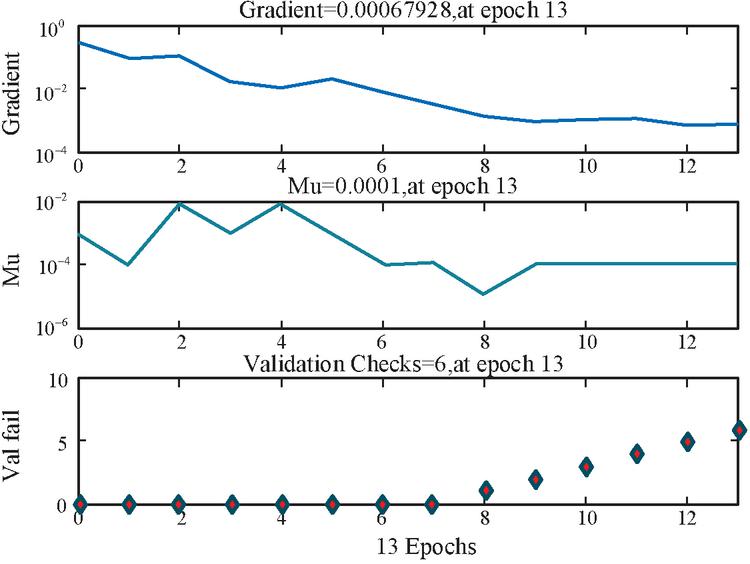
Figure 5 Regression chart of training results.
As can be seen from Figure 5, when the number of training iterations reaches 13, the training gradient is 0.00067928, and from the overall view, the training gradient shows a decreasing trend. The Mu value varies greatly in the early stage of training, and tends to be stable in the late stage of training. By the 13th iteration, the value of Mu was 0.001 and the training state was stable. The validity test value of the training is 6. The validity test value starts to increase gradually only after the 8th iteration, and at the 13th iteration, the validity test value is 6 and shows a continuous increasing trend. The state diagram of the GRA-BPNN model training is shown in Figure 6.
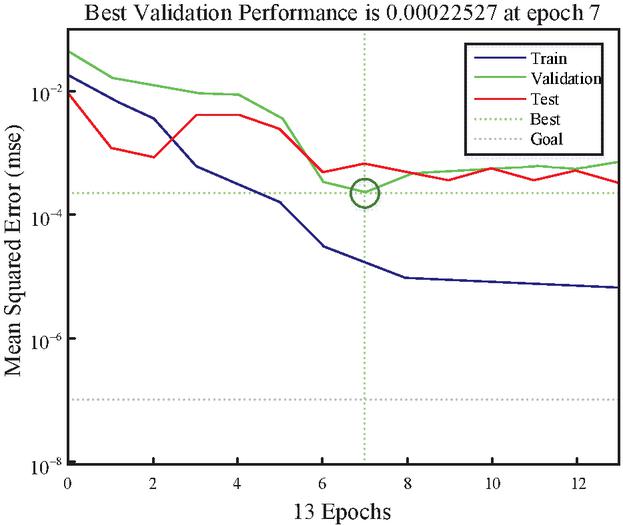
Figure 6 GRA-BPNN model training state diagram.
As shown in Figure 6, the test sample value reached the best training performance after seven iterations with a result of 0.0022527. The simulation results of the GRA-BPNN model were compared with the results obtained using the gray correlation analysis alone, as shown in Table 4.
Table 4 Comparison of results of different evaluation methods
| City | GRA-BPNN | Simulation Result | GRA |
| C1 | 0.8 | Excellent | 0.78 |
| C2 | 0.81 | Excellent | 0.76 |
| C3 | 0.79 | Excellent | 0.75 |
| C4 | 0.8 | Excellent | 0.74 |
| C5 | 0.77 | Excellent | 0.76 |
| C6 | 0.76 | Excellent | 0.73 |
| C7 | 0.74 | Fine | 0.72 |
| C8 | 0.72 | Fine | 0.69 |
| C9 | 0.75 | Excellent | 0.72 |
| C10 | 0.74 | Fine | 0.72 |
As can be seen from Table 4, the simulation results of the GRA-BPNN model are very close to the results of the GRA method as a preset ideal, indicating that the GRA-BPNN model is successfully constructed and achieves the desired goal. From the results of the scores of the 10 cities, the results obtained by using the GA-BPNN model will have relatively higher scores, with an average score of 0.765 for the 10 cities, while the average score of the 10 cities obtained by using the GRA method alone is 0.737. In terms of the average score, the GRA-BPNN model is 0.028 higher than the GRA method, which is 2.8 points higher when converted into a percentage system, and its error is as expected. From the model design perspective, the GRA-BPNN model designed in this study considers more factors, is more comprehensive, and is more complex to calculate, yielding results that are higher compared to those of the simple use of the GRA method, which is also in line with expectations. Because both algorithmic models are additive, the high score also proves that the GRA-BPNN model takes more factors into account comprehensively and the scoring indexes are considered more carefully.
5 Conclusion
In this study, a GRA-BPNN evaluation model is constructed by combining the gray correlation degree analysis method and BP neural network algorithm for the evaluation of information security of smart city networks. The results of simulation experiments show that the test sample was conducted for 13 iterations and reached the best training performance at the 7th iteration, and its actual output results were very close to the expected ones, and the difference between them was within the expected error. The R-values in the regressions of the training results all exceeded 0.99, indicating that the data fit well. At the 13th iteration of training, the training gradient is 0.00067928, the value of Mu is 0.001, and the validity test value is 6. From the results of the scores of the 10 cities, the results obtained by using the GA-BPNN model will have relatively higher scores, with an average score of 0.765 for the 10 cities, while the average score of 0.737 for the 10 cities obtained by using the GRA method alone. The GRA-BPNN model scores 0.028 higher than the GRA method, which is in line with the expected error, and the higher score proves that the GRA-BPNN model is more comprehensive and detailed in its scoring consideration. Of course, there are some shortcomings in this study, such as the selection and consideration of smart city data in the experiment is not objective enough, and only 10 groups are not comprehensive enough. In addition, the construction of network information security evaluation indexes in smart cities is not rich enough. It is expected that in future research, more comprehensive and complete evaluation indexes can be constructed, and more cities’ network information security data can be used for the experiment to improve the accuracy of the experiment.
Acknowledgement
The research is supported by The 2019 Innovation Fund of Industry-University-Research in China – New Information Technology Innovation Project (Grant No. 2019ITA02009), the 2021 Innovation Fund of Industry-University-Research in China – New Information Technology Innovation Project (Grant No. 2021ITA05021) and The 2020 Project on the Teaching Reform of Vocational Education in Gansu Province (Grant No. 2020gszyjy-29).
References
[1] Kim S M, Jung H S, Lee Y W. Smart City Cyber Security Based on Information Security Industry. The Journal of Korean Institute of Information Technology, 2020, 18(4):129–136.
[2] Li D, Deng L, Lee M, et al. IoT data feature extraction ion and intrusion detection system for smart cities based on deep migration learning. International Journal of Information Management, 2019, 49(1):533–545.
[3] Rashid A M, Yassin A A, Alkadhmawee A A, et al. Smart City Security: Face-Based Image Retrieval Model Using Gray Level Co-Occurrence Matrix. Journal of Information and Communication Technology, 2020, 19(3):437–458.
[4] Scholl M C. Raising Information Security Awareness in the Field of Urban and Regional Planning. International Journal of E-Planning Research, 2019, 8(3):62–86.
[5] Song H H. Testing and Evaluation System for Cloud Computing Information Security Products. Procedia Computer Science, 2020, 166: 84–87.
[6] Liu R, Fan X, Wang Z, et al. Fuzzy BP neural network in radar intelligence quality evaluation. Journal of Physics Conference Series, 2020, 1601(1):032018–032018.
[7] Lin L, Cfa B, Zha B, et al. Grade classification model tandem BpNN method with multi-metal sensor for rice eating quality evaluation – ScienceDirect [J ScienceDirect. Sensors and Actuators B: Chemical, 2019, 281(15):22–27.
[8] Song Y, Wang J J, Chen Z, et al. Research on Occupational Hazard Supervision System of Petroleum Enterprises Based on Cloud Computing. IEEE Access, 2020, 8(1):45356–45367.
[9] Zhang Y, Hu Z, Ji L, et al. Evaluation model of enterprise operation based on BP neural network optimization algorithm. Journal of Physics: Conference Series, 2020, 1570(1):012084–012084.
[10] Yu M, Ding X, Sun H, et al. Role of fuzzy fractional differential equation in the construction of low carbon economy statistical evaluation system. AEJ - Alexandria Engineering Journal, 2020, 59(4):2765–2775.
[11] Cai X, Qian Y, Bai Q, et al. Exploration on the financing risks of enterprise supply chain using Back Propagation neural network. Journal of Computational and Applied Mathematics, 2019, 367(1):112457–112457.
[12] Liu Y, You X, Zhang C. Regional Economic Vitality Based on Weighted Grey Relational Analysis. Journal of Economic Science Research, 2020, 3(2):12–18.
[13] Li B, Wu Q, Zhang W, et al. Water resources security evaluation model based on grey relational analysis and analytic network process: A case study of Guizhou Province. Journal of Water Process Engineering, 2020, 37(1):101429–101429.
[14] Juan, Tang, Hong-Lin, et al. Urban Sustainability Evaluation under the Modified TOPSIS Based on Grey Relational Analysis. International Journal of Environmental Research & Public Health, 2019, 16(2): 256–256.
[15] Yang L, Xie N. Evaluation of provincial integration degree of “internet + industry” based on matrix grey relational analysis. Grey Systems: Theory and Application, 2019, 9(1):31–44.
[16] Wu L, Zhou J, Li Z. Applying of GA-BP Neural Network in the Land Ecological Security Evaluation. IAENG International journal of computer science, 2020, 47(1):11–18.
[17] Tan Y S, Chen H, Wu S. Evaluation and implementation of environmentally conscious product design by using AHP and grey relational analysis approaches. Ekoloji, 2019, 28(107):857–864.
[18] Wang X R, Zhou Y. Study on the Application of Neural Network in the Computer Network Security Evaluation. Journal of Intelligent Computing, 2019, 10(3):97–101.
[19] Li R, Tian B, Li Y, et al. Information Security Evaluation based on Artificial Neural Network. International Journal of Performability Engineering, 2019, 15(11):2908–2908.
Biography

Xiang Li obtained his ME in Computer Science and Engineering (2010) from Xidian University, Xi’an, Shaanxi. Currently, he is working as an Associate Professor and the Director of Information Security Office in Department of Electronic Information Engineering, Lanzhou Vocational Technical College, Lanzhou, Gansu. He was invited as an expert to deliver various technical talks on computer network technology and information security. He is also serving and served as a supervising arbitrator for National Vocational College Skills Competitions. He has published articles in more than 10 national and international journals and conferences proceedings. His areas of interest include computer network, computer application, information security and streaming media technology.
Journal of Cyber Security and Mobility, Vol. 11_6, 755–776.
doi: 10.13052/jcsm2245-1439.1162
© 2023 River Publishers