Network Security Prediction and Situational Assessment Using Neural Network-based Method
Liu Zhang and Yanyu Liu*
Department of Electronic Information Engineering, Beihai Vocational College, Beihai, 536000, China
E-mail: Yanyu_Liu2023@outlook.com
*Corresponding Author
Received 07 February 2023; Accepted 17 March 2023; Publication 21 June 2023
Abstract
Technology development has promoted network construction, but malicious network attacks are still inevitable. To solve the problem that the current network security assessment is not practical and the assessment effect is poor, this study proposes a network security monitoring tool based on situation assessment and prediction to assist network security construction. The framework of the evaluation module is based on convolution neural network. The initial module is introduced to convert some large convolution cores into small convolution cores in series. This is to reduce the operating cost, because building multiple evaluators in series can maximize the retention of characteristic values. This module is the optimized form of Elman neural network. The delay operator is added to the model to respond to the time property of network attack. At the same time, particle swarm optimization algorithm is used to solve the initial weight dependence problem. The research adopts two methods of security situation assessment and situation prediction to carry out model application test. During the test, the commonly used KDD Cup99 is used as intrusion detection data. The experimental results of the network security situation evaluation module show that the optimization reduces the evaluation error by 3.34%, and the accuracy meets the evaluation requirements. The model is superior to the back propagation neural network and the standard Elman model. The model proposed in this study achieves better prediction of posture scores from 0.3 to 0.9, which is more stable than BP neural network. It proves that the model designed by the research can achieve more stable and higher prediction than similar models. It is more practical to obtain better results on the basis of a more stable model architecture and lower implementation costs, which is a meaningful attempt in the wide application of network security.
Keywords: Cybersecurity, situational assessment, convolutional neural network, Elman neural network, performance optimization.
1 Introduction
Network security situation refers to the changing trend of security status at a specific time in the future. Posture assessment and prediction are essential elements in network security construction [1, 2]. Data processing based on sensing existing network security elements and situational assessment is the key to defending against unknown risks. The characteristics of attitude assessment determine that the method used has backward and forward correlation based on space-time. The data from various devices need to be multi-source heterogeneous fusion [3, 4]. The methods of situational assessment are broadly mathematical paths, logical reasoning paths and pattern recognition paths. The mathematical approach represented by hierarchical analysis has the advantage of being convenient and easy to implement. But the subjective factor of weight construction makes the assessment unable to cope with new threats. The logical argument represented by the D-S evidence theory has a good concept of evidence. It is prone to produce wrong results when there are conflicts in the data or when a large number of unknown situations emerge conclusions. In addition, the construction of inference rules makes the method less efficient. In contrast, neural networks have sound data processing and autonomous learning capabilities. It has good logical capabilities from the construction level of neural networks. Another advantage of this type of method is to identify unknown risks [5–7]. Neural networks also have their drawbacks, where the massive data sources are usually multiple sources. There is a particular accuracy problem in sample training and computation. For this situation, the research will be carried out in line with the improvement of the assessment and prediction of the security situation for developing the application of deep learning in relevant fields. In this study, neural network is selected as a network architecture with high reliability and low difficulty in implementation. On this basis, innovative performance improvements are made. By converting some large convolution kernels into small convolution kernels in series and building multiple evaluators in series, the eigenvalues can be preserved to the maximum extent. This improved method can reduce the cost of model operation. At the same time, it can improve the data processing performance and information analysis ability of the algorithm, and then balance the economic and performance. While ensuring the realizability of the network security situation balance technology in a low-cost and low-technology environment, it also improves the implementation effect of the technology and provides an innovative path for wide application.
2 Related Work
Convolutional Neural Networks (CNNs) have received much attention in the field of feature extraction due to the deep feedforward mechanism. The networks are commonly used for potential assessment work in various industries. Scholars have developed applications based on them. Wang and Majewicz used convolutional neural networks for the performance assessment of surgical robots. They combined CNNs with kinematic data as a mediator for the conversion of individual skill levels. The obtained results showed that a robot built with this method was more than 90% accurate in the suture, needle threading and knot tying operations and the operations were all completed within 3 seconds [8].
Ma S et al. used CNNs for quality assessment of tracks. They performed fault localization from body vibration when abnormalities could not be detected by conventional track geometry criteria. The localization method was CNN combined with long and short-term memory network for feature extraction of driving data. The results confirmed that the acceleration of the car body could be used as one of the parameters for track quality assessment [9].
Malware can be used as one of the elements of network security assessment. Chen B’s team used CNN as a detection tool for malwar. They attacked existing detectors with new white box and black box attack methods. The results showed a high success rate. For this case, they proposed a pre-detection mechanism to prevent confrontation, thus ensuring that the confrontation training had a detection performance enhancement [10].
In the field of potential assessment, Elman neural networks have better performance than feedforward neural networks. Yu D’s team used this local regression network as a basis and improve it optimally. Four different operating conditions proved that this algorithm was superior to the conventional algorithm in parameter extraction [11]. They fused the gray wolf algorithm with Elman on the basis of accurate derivation of outage probabilities. The results showed that the performance of this model was better than that of the standard Elman and SV and BP neural networks. Their experiments demonstrated the good prediction performance of Elman [12].
Elman is prone to fall into local minimal leading to convergence failure. Zhang et al. a proposed CSO improvement path where absolute error and accuracy were taken as indexes to evaluate the model. The accuracy of the improved model was the highest. Their experiments provided an optimization idea for the case where the model had nonlinear characteristics [13].
With the increase in network applications and demands, security has become a necessary task. Scholars have optimized and improved from the network infrastructure and software framework construction. Fawcett introduced SDN for the difficulty of designing network security due to the existing network distribution method. To test the performance of the framework, they developed four attack scenarios for simulation. The results showed that the proposed method had better accuracy. Their research provided targeted security improvements from the characteristics of the network itself [14].
Wu H T and Tsai C W conducted a study on network information security for smart farms. They used darknet technology to explore privacy protection, through the monitoring of data transmission frequency to prevent distributed service attacks. The results proved that darknet technology could protect server ID addresses while reducing distributed denial of service attacks. Their research improved network security through encryption of data [15].
Wheelus and Zhu conducted a scientific analysis of the situation where unsuspecting IoT users were at risk of being attacked. They designed an IoT system platform with secure access control to defend against attack threats. The test results showed that the approach worked [16].
Xiao J’s team worked on distribution network security assessment research. They innovatively used DSSR for security alliance. The specific implementation path was to supplement the existing DSSR with the DSSR with limited normal operation. Then the safety distance between the OP and the safety boundary was calculated to determine the safety of an OP. If there is insecurity on the safety boundary, the overload component could be identified. According to this logic, the security of distribution network could be predicted by the trend of SD level. The results was effectively proved [17]. Qin et al. found that the traditional network entity naming method based on fine-grained analysis of multi-source threat intelligence had poor performance. They proposed to use the deep neural network method combined with feature templates for secure entity recognition. The results showed that this method had the best performance [18].
The improvement and application of CNN and Elman neural networks by scholars confirmed their excellent performance in the field of feature recognition and extraction. It is widely used in various fields and provides ideas for network security situation assessment and prediction. The hardware structure and software framework construction in the field of network security make it difficult to comprehensively consider traditional improvements. The method selection based on these characteristics conforms to the performance characteristics of neural network. Therefore, it will be a meaningful attempt to apply deep learning to network security construction.
3 Framework Construction of Neural Network-based Network Security Assessment and Prediction
3.1 Construction of a Posture Assessment System Based on Improved CNN
Neural networks have powerful functions, among which CNNs have attracted much attention because of their powerful representational learning ability. The standard CNNs are composed of an input layer, convolutional layer, activation function, pooling layer, fully connected layer, and Soft max layer. The basic unit is the neuron [19]. Among them, the input module is the port to receive experimental data. The data type is generally divided according to the dimension. The input layer has the responsibility of normalizing the data due to the different morphology of the data signal in each domain. The convolutional layer is one of the functional layers for obtaining feature information of the dataset, where the size and number of convolutional kernels jointly determine the relationship between CNN and globalized features. The nodes within the channels of this layer are convolved from small areas of the previous layer. The rules of concatenation are related to the parameters inside the convolution kernel. Larger convolutional kernels are used in lower layers to increase the convolutional attribute. The value decreases with the running order of the model. The specific corresponding expression is given in Equation (1).
| (1) |
In Equation (1), is the two-dimensional vector in the convolutional layer. and are the eigenvalues respectively. is the convolutional kernel. and represent the length and width of the kernel respectively. is the bias value. is the activation function, whose function is to activate the data of the nodes in each layer of the model to enhance the learning nonlinear functions of the model. The type of function should be selected not only for accuracy but also for operational feasibility. Common activation functions include linear rectification function (Re LU), hyperbolic tangent function (Tanh) and Sigmoid function. The selection of the function requires consideration of the specific scene.
The pooling layer can replace the matrix of sliding window with numbers. This is similar to the principle of image compression. The model parameters are reduced by reducing the dimension in the feature selection process. There are three pooling modes according to the operation type. The mean value type takes the mean value of the window as the output, which is often used in the higher-level network. The output of extremum type is the maximum value of the window, which can effectively save information. The fully-connected layer is responsible for identifying features while performing deeper sorting and filtering of the resulting feature values. The filtering results are mapped to the category space. The connectivity feature of the fully connected layer is that the neurons within the layers are not connected, but the neurons between the layers are fully connected. The function is to improve the nonlinear mapping ability of the whole CNN. The expression is shown in Equation (2).
| (2) |
In Equation (2), is the node value of the channel in the convolutional layer . is the value of the th node of the convolutional layer . is the connection weight of the neuron. represents the input value domain of the neuron. represents the bias value of the neuron. is the activation function.
The Soft max classifier is behind the fully connected output layer. The role is to minimize the Soft max loss. It is assumed that the dataset is . is the maximum value of the sample set label. has multiple values. The estimation formula for each classification probability is as in Equation (3).
| (3) |
The in Equation (3) is the parameters of the model. is the normalized probability distribution, and the sum is 1. The cost function can be defined as in Equation (4).
| (4) |
The in Equation (4) is a schematic function. If the value is 1, then it is a true expression. If the value is 0, then it represents a false expression. One of the advantages of convolutional neural networks for network security posture is the interconnectedness of neurons within layers, which is lacking in other neural networks. Secondly, CNNs themselves have the characteristic of global mining using local features, which is helpful for the evaluation of network attacks and other security problems. However, the network potential assessment will deal with a huge amount of data, which makes the parameters increase sharply and easily leads to overfitting of the results. The gradient is easy to disappear, leading to difficult training of the model. Therefore, the CNN needs to be optimized [20]. At this time, Inception module is added to the model to solve the above problems. Sample classification is carried out before CNN operation. The results are output as the model from the input layer to the output layer. The operation optimization principle is to reduce the volume of convolution kernel and increase the number. The adapted and improved process is shown in Figure 1.
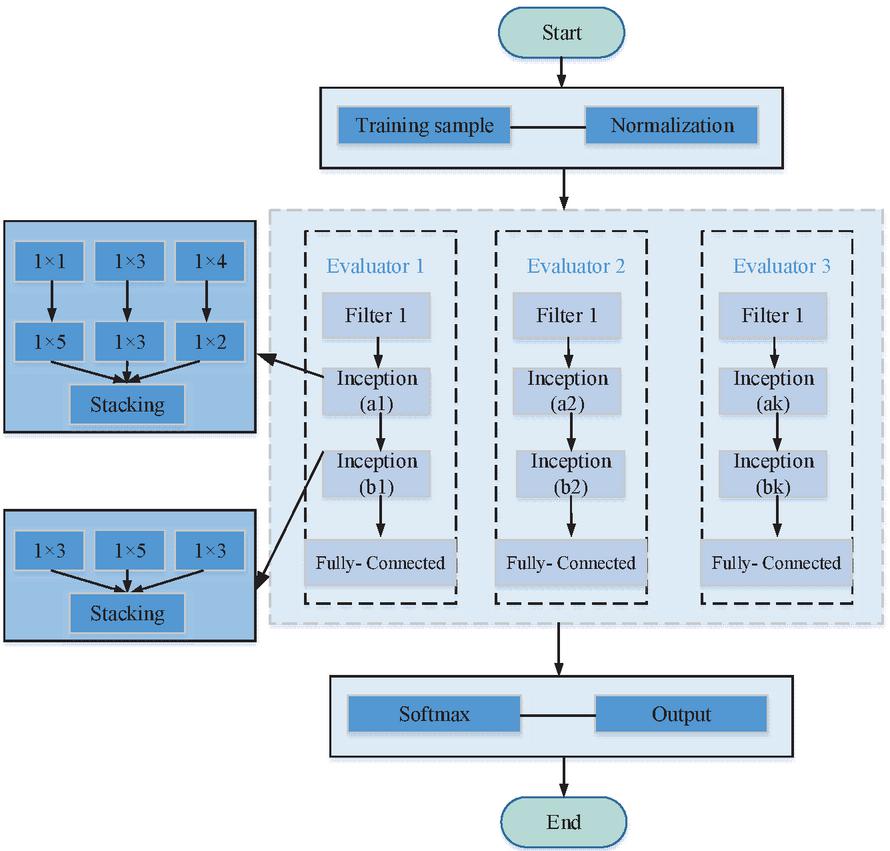
Figure 1 Valuation structure of the Inception module CNN.
As in the flow presented in Figure 1, the sample set needs to be divided into training and test samples before the neural network is run. There are a total of sample features and a total of classes of features. The constructed Inception module will replace the original convolutional layer structure. The large convolutional kernels will be divided into small convolutional kernels in series. Some large convolution cores retained will obtain global features, which significantly reduces the computational difficulty [21]. The number of Inception neural nodes inside the network is calculated as in Equation (5).
| (5) |
and in Equation (5) represent the number of convolution kernel and pooled kernel at the first layer of Inception module. The height and width of feature map after convolution operation are and respectively. The height and width of the convolution kernel are and respectively. The height and width of the feature map after the pooling operation are and respectively. is the height of the pool core. is the width of the pool core. After the sample enters the neural network, the features are first divided. Each feature needs to be sharpened. At this time, the differential operator can sharpen the indicators based on spatio-temporal one-way. The gradient-type differential operator used in the study is shown in Equation (6).
| (6) |
In Equation (6), is the filtering operation of the -th filter on the input features. is the sharpening operator. The differential operator processes all but the first feature into the Inception module. Subsequent feature types will be sharpened by the same initial logical type for consistent feature extraction. The feature map size after convolution or pooling in the module is calculated as in Equation (7).
| (7) |
In Equation (7), and are the height and width of the feature map before operation. and are the height and width of the feature map after convolution or pooling. and are the height and width of the kernel. is the number of image padding. is the step length. The feature classification of the network posture will be used as the number of evaluators. The final decision is made by Soft max to perform probability statistics on the results of all evaluators, as shown in Equation (8).
| (8) |
The of Equation (8) is the parameter vector of the model. is the probability. Sample belongs to category . Before adding the complete network structure to the potential assessment, the indicators of data need to be established. These indicators are usually multi-source heterogeneous, so the standardization process is the basis for the construction of the characteristic indicators. The elements of the obtained data need to be collected before sample creation. The results is the basis for sample creation. The divided elements calculate the indicator values according to the quantization formula, and the normalization process generates the database. A part of the database is used as a training sample, and another part is a test sample. After being calculated by the above assessment model, the output is the basis for decision analysis. The assessed value of the overall situation and the most influential sub-stance is the final decision result.
3.2 Modified Elman-based Posture Prediction Model Construction
The Inception module inserted into the convolutional neural network for situational assessment model is constructed in the previous subsection. However, the results of the situational assessment are necessary for network security prediction, so there is also a need for network security prediction based on situational awareness. The results play a key role in enhancing network risk prevention construction. The study addresses the need for cybersecurity posture prediction and uses Elman neural network as the prediction part. Compared to feedforward neural network, the model is temporal and can handle linear indivisibility. The difference between Elman network and the prediction method is that the feedback of the results is done in real time. However, the feedforward neural network is fed back after the entire result is input [22]. The structure of this difference is almost the way of inter-layer connection. The feedforward neural networks represented by BP neural networks are unable to perform cross-layer vectoring. Elman neural networks are able to connect across layers, as shown in Figure 2.
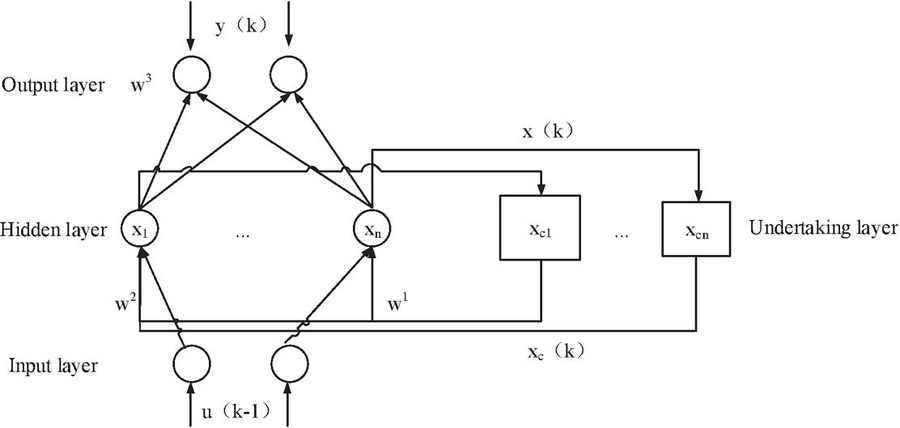
Figure 2 Elman neural network structure.
As presented in Figure 2, the takeover layer is another structural feature of this neural network construction. The function is to keep the output of the implicit layer at one moment and input it to the implicit layer at the next moment. This temporary storage operation makes the neural network have time characteristics. The neural network uses instantaneous weights for correction. After correction, the mathematical models of the input layer, the implicit layer and the absorption layer are shown in Equation (9).
| (9) |
, , are dimensions of the neural network. and are dimensional output vectors. and are dimensional intermediate layer output vectors. and are dimensional takeover layer output vector. is the dimensional input vector. is the time step of the iteration. and are the interlayer connection weights of input layer, undertaking layer, intermediate layer, and output layer respectively. and are transfer functions of the intermediate layer and the output layer respectively. The process involves the input layer to the intermediate layer and the output error inverse transfer. This calculation and transfer mechanism will correct the weights to reduce the error. This process follows the logic shown in Figure 3.
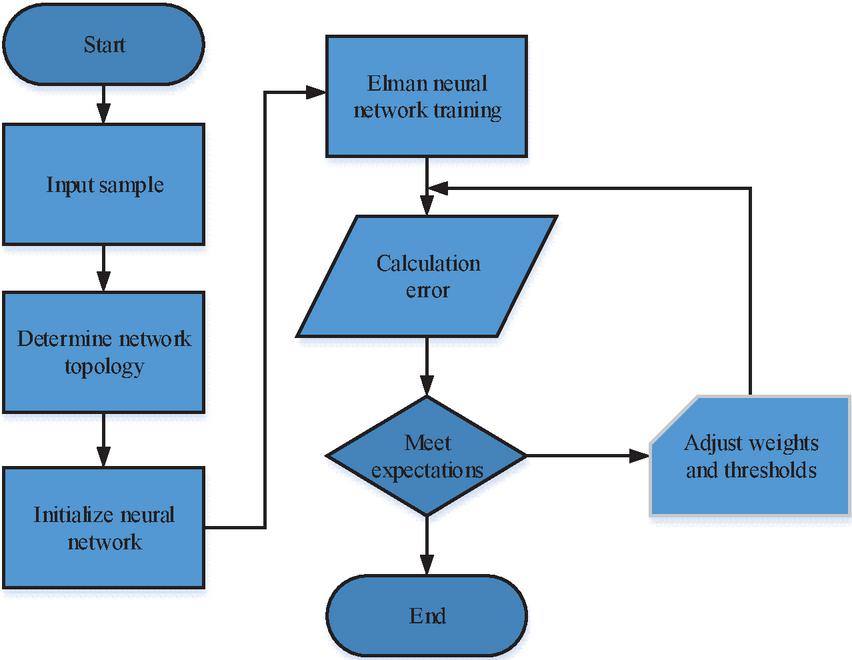
Figure 3 Elman algorithm flow chart.
In Figure 3, the value of the neuron in the input layer is . The output is . The calculation of the neuron passed to the neuron in the intermediate layer is shown in Equation (10).
| (10) |
The in Equation (10) is the intermediate layer input value. is the output value. is the connection weight of the middle layer neuron and the input layer neuron . The input and output of this layer neuron is as shown Equation (11).
| (11) |
The in Equation (11) is the input. is the output. is the weight of the output layer neuron and the intermediate layer neuron . The error function set in the neural network is calculated as in Equation (12).
| (12) |
The in Equation (12) is the calculated output value. denotes the expected value. is the output difference. is the number of neurons in the output layer. The negative gradient of the error function will be used as the basis for correcting the weights. The output layer weights are calculated as in Equation (13).
| (13) |
The and in Equation (13) are weights before and after updating. is the learning rate. is the final iteration number. is the model parameters. The values are related to the output results. Therefore, the weights of neurons in the middle layer change as in Equation (14).
| (14) |
From Equations (13) and (14), the results of weight adjustment for the output and intermediate layers can be obtained. The Elman algorithm can determine the closest desired value by increasing the gain factor. It increases the efficiency of network training. Therefore, the Particle Swarm Optimization (PSO) algorithm is selected for optimization to improve the convergence efficiency [23]. When the original algorithm determines the distribution of each layer particle swarm initialization will be performed. Then the particle position and velocity parameters of PSO are set. The fitness of the particle swarm is calculated by the mean square error of the Elman neural network as a basis, as shown in Equation (15).
| (15) |
In Equation (15), is the number of input samples. is the number of output samples. is the output error generated when the neuron trains the samples . Then the new property of the particle swarm is determined. If this moment is better than the previous moment, the optimal value will be calculated. Otherwise, it will be repeated until reaching the optimal value. The best position of the particles at this moment is output when the adaptation of the particle swarm reaches the accuracy requirement or the maximum of the iteration. This output will be used as the initial weights and self-feedback gain factors of the network security desktop prediction neural network. The network security situation prediction model is built by PSO-optimized Elman network. The data set still consists of the reference set and the training set. The distance between the predicted value and the reference value will be used as the evaluation criterion for the prediction performance.
4 Neural Network in the Assessment and Prediction of Security Posture Application and Analysis
The performance test of the prediction model is divided into security posture assessment and situation prediction. Among them, the prediction of security posture is needed to support the former, so the performance of the improved CNN for posture assessment is tested first. The dataset uses the currently commonly used KDD Cup99 as the intrusion detection dataset, which has the first 42 bits of each data as the feature segment. The threat level will reach a new level as the attack authority and system impact degree increase. The study uses Python 3.8 as well as other development libraries for model building. 16 neurons are identified for the improved CNN input and filter layer, and 2 neurons are identified for the output layer. The model runs after inserting the Inception module to evaluate the cyber security posture. The posture evaluation is trained in groups of 10 data each. Figure 4 shows the fitting of the improved CNN posture evaluations with real values.
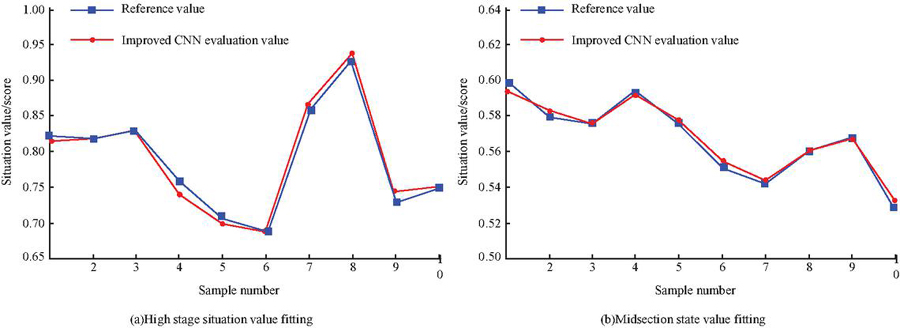
Figure 4 Improvement of the fit of CNN evaluation training.
In Figure 4, the the evaluation value of the improved CNN model is close to the real value, with a high degree of fit. The two subfigures presents the fitting performance of the high situation value and the mid-section situation value respectively, with good results of the two segmental fits. This indicates that the model is adaptable to the state evaluation, and does not depend on the strength of specific network attacks. The study also adds standard CNNs and Support Vector Machines to the experiments, and evaluates the performance of each model by comparison with the same test environment and sample conditions. Figure 5 shows the results of the posture evaluation of the centralized model for 60 samples.
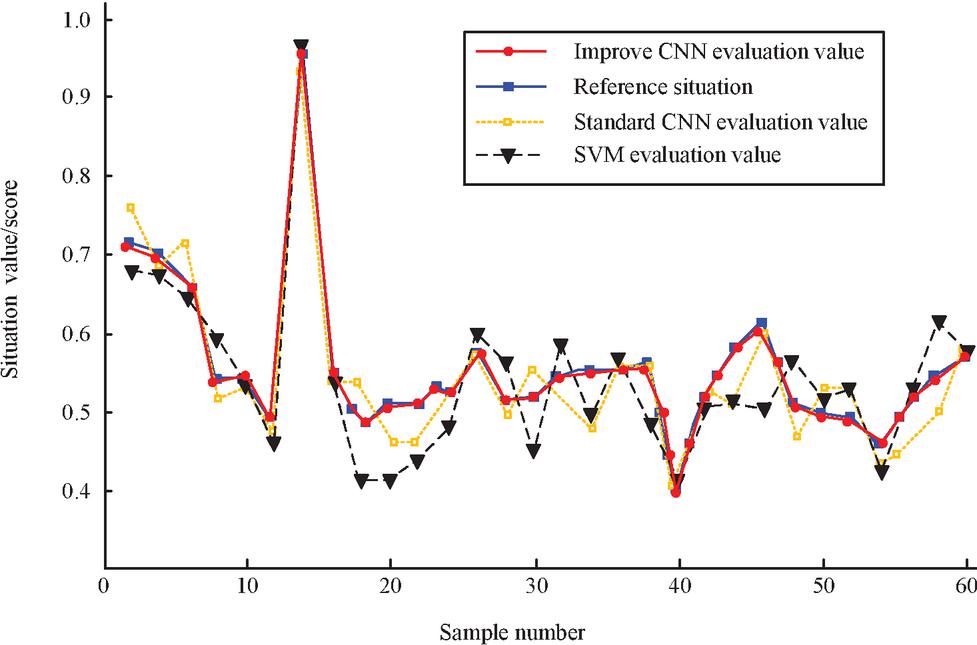
Figure 5 Evaluation of network security situation by different models.
In Figure 5, the best fit with the reference value of network security situation is the improved CNN proposed in the study, with a fitting degree of more than 85%, followed by the standard CNN and SVM. The improved fitting of the optimized convolutional neural network indicates that the Inception module is effective in processing the convolutional kernel, at least in evaluating the improved network security situation. The error profile provides a more intuitive sense of the accuracy of the models. Figure 6 shows the absolute error graphs of the three evaluated models.
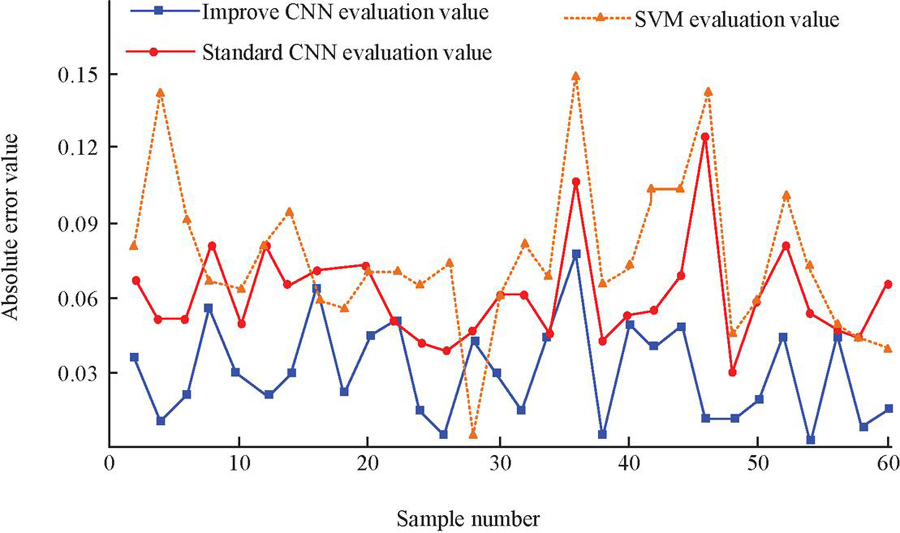
Figure 6 Error values of network security situation assessment by three models.
Among the 60 groups of sample evaluation results in Figure 6, the absolute error of SVM is generally high, with the highest value of 0.147. The lowest error is achieved for the improved CNN, with all samples within 0.1. The accuracy satisfies the network security posture requirements. The security level is evaluated by dividing the interval of posture values according to A–E. The most dangerous interval of E level is (0.9,1], and the intermittent points of A–D area are 0.2, 0.4, 0.75, and 0.9 respectively. The performance of the model under different posture values is shown in Table 1.
Table 1 Effect of three models on the evaluation of random samples
| Sample No. | Improved CNN | CNN | SVM | True Value | Safety Level |
| 5 | 0.7511/D | 0.7312/C | 0.7134/C | 0.76 | D |
| 7 | 0.8012/D | 0.8322/D | 0.8441/D | 0.81 | D |
| 12 | 0.6734/C | 0.6791/C | 0.6821/C | 0.67 | C |
| 41 | 0.9012/E | 0.8922/E | 0.9335/E | 0.91 | E |
| 67 | 0.7673/D | 0.7491/C | 0.7537/D | 0.77 | D |
| 79 | 0.4742/C | 0.4836/C | 0.4397/C | 0.47 | C |
| 92 | 0.6274/C | 0.6212/C | 0.6361/C | 0.63 | C |
| 103 | 0.5864/C | 0.6061/C | 0.6047/C | 0.59 | C |
| 121 | 0.3946/B | 0.4017/C | 0.4062/C | 0.39 | B |
| 135 | 0.8355/D | 0.8532/D | 0.8541/D | 0.84 | D |
| MAPE | 2.39% | 5.73% | 7.43% | / | / |
The 10 random samples tested in Table 1, labeled 5 and 121, have different model cross-interval results. The improved CNNs are all within the reference interval according to the reference value and rank, while the standard CNNs and SVMs have cross-interval errors, with the lowest error of 2.39% for the improved CNNs among all samples. Although the average error of the test on random samples is less than 8%, the cross-interval errors appearing in the standard CNN and SVM affects the ranking of the security posture. Therefore, the security posture analysis is based on the evaluator constructed by the study.
In the case of accurate cybersecurity posture assessment methods, the prediction of the posture can be performed. The study tests the prediction performance of the PSO-Elman model to obtain accuracy data. The FCCX-15 dataset released by Carnegie Mellon University is selected as the sample library. The number of particle swarm iteration termination steps is 2000, and the maximum iteration steps of Elman neural network is 1000. The network security posture prediction needs to consider the time factor. Therefore, the samples from the first 5 days is used as the prediction training samples, and the samples from the last day is used as reference set. Together with BP neural network and RBF Neural network, two feedforward neural networks and the standard Elman neural network are compared. The prediction performance is shown in Figure 7.
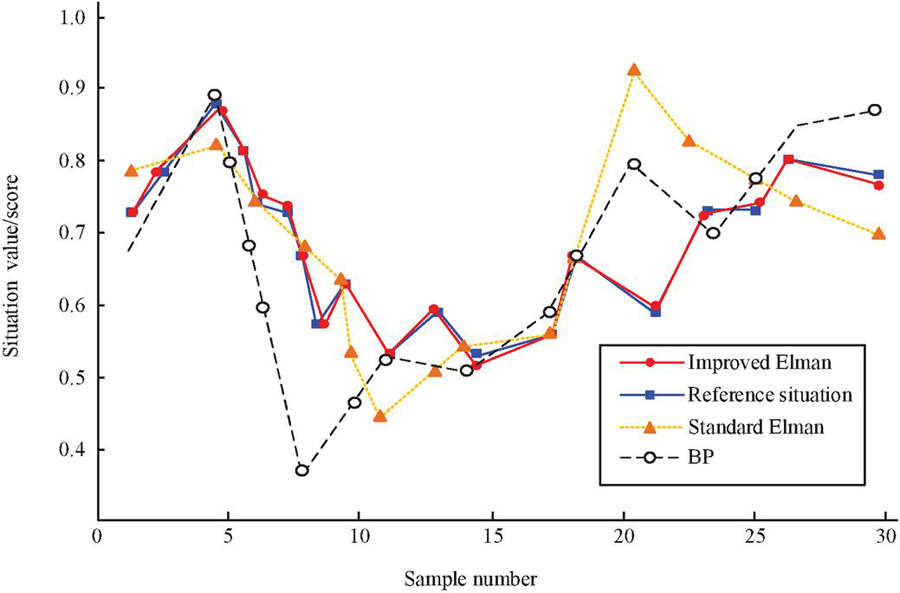
Figure 7 The situation values predicted by the three models.
In Figure 7, the prediction model that is closest to the true value is the improved Elman neural network, followed by the BP neural network and the standard Elman. The prediction performance of Elman model before and after improvement is significantly different. The fitting degree of the predicted value of the standard Elman model is not as good as that of the BP neural network, which indicates that the particle swarm optimization approach works well. In addition, the models constructed in the study achieve better prediction results from the posture score 0.3 to 0.9. Figure 8 presents the prediction error values of the three models.

Figure 8 Prediction errors of the three models.
As shown in Figure 8, the prediction error of the three models does not exceed 0.1. The smallest error is the particle swarm optimization Elman model built by the research, with the error value less than 0.06, and the largest error is the standard Elman model. To further validate the BP model the constructed model, iterative experiments are conducted. The model running time and error values are shown in Figure 9.
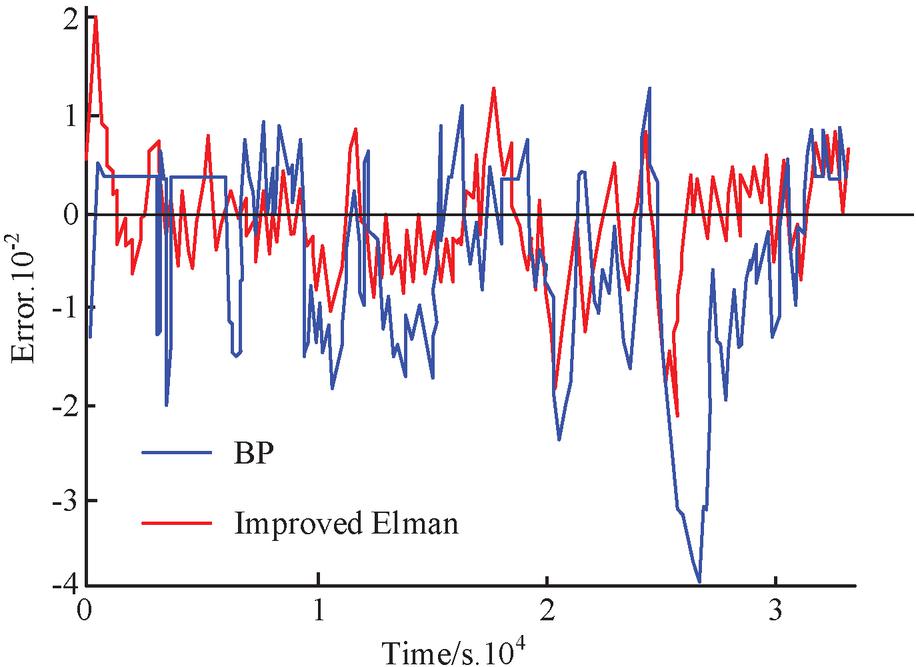
Figure 9 The relationship between error and running time of BP and improved Elman model.
In Figure 9, the prediction error of the model constructed by the study fluctuates around 0, and these fluctuations do not exceed 0.02. At the early stage of the model operation, the error reaches stable. On the other hand, for the BP model, the error is close to the research model in some time periods. However, the fluctuation is slightly more prominent, and the model oscillations occur with the operation. Therefore, the stability problem is likely to cause deviation in the prediction of network dynamics, which brings risk.
5 Conclusion
The assessment and prediction of security posture are essential to network security work. Accurate posture data can support subsequent defense work. The study conducts two analyses on the characteristics of the network security problem itself, namely, situational assessment and prediction. The difficulty of situational evaluation lies in the multi-source heterogeneous structure of data and the unknown characteristics of threats. The results show that the improved model is optimal for both network posture value and rank assessment, with a fit of more than 85% and an error of 2.39% for random samples, which meets the accuracy requirements of network posture assessment. Based on accurate posture assessment, the posture prediction work is carried out. The prediction model is PSO-Elman central architecture. The model provides excellent performance in the posture prediction experiment. The prediction error is controlled within 0.06, which is more stable than the ordinary BP neural network. The accuracy of this model has specific positive significance for the network security construction work. Although the above two optimized neural models can meet the accuracy requirements of security assessment and prediction, the convergence speed still has room for improvement. The subsequent work will be devoted to improving the efficiency of the model and making it practical.
References
[1] Network security situation detection of internet of things for smart city based on fuzzy neural network. International Journal of Reasoning-based Intelligent Systems, 2020, 12(3): 222–227. https://doi.org/10.1504/IJRIS.2020.109650.
[2] A novel method of network security situation assessment based on evidential network//International Conference on Machine Learning for Cyber Security. Springer, Cham, 2020: 530–539. https://doi.org/10.1007/978-3-030-62223-7\_46.
[3] ISA evaluation framework for security of internet of health things system using AHP-TOPSIS methods. IEEE Access, 2020, 8: 152316–152332. https://doi.org/10.1109/ACCESS.2020.3017221.
[4] QoS aware trust-based routing algorithm for wireless sensor networks. Wireless Personal Communications, 2020, 110(4): 1637–1658.
[5] A Security Policy Protocol for Detection and Prevention of Internet Control Message Protocol Attacks in Software Defined Networks. Sustainability. 2022; 14(19):11950. https://doi.org/10.3390/su141911950.
[6] Design of Intrusion Detection System based on Cyborg intelligence for security of Cloud Network Traffic of Smart Cities. Springer J. Cloud Comp 11, 26 (2022). https://doi.org/10.1186/s13677-022-00305-6.
[7] Robot visual navigation estimation and target localization based on neural network Paladyn, Journal of Behavioral Robotics, vol. 13, no. 1, 2022, pp. 76–83. https://doi.org/10.1515/pjbr-2022-0005.
[8] Deep learning with convolutional neural network for objective skill evaluation in robot-assisted surgery. International journal of computer assisted radiology and surgery, 2018, 13(12): 1959–1970.
[9] Deep learning for track quality evaluation of high-speed railway based on vehicle-body vibration prediction. IEEE Access, 2019, 7: 185099–185107. https://doi.org/10.1109/ACCESS.2019.2960537.
[10] Adversarial examples for cnn-based malware detectors. IEEE Access, 2019, 7: 54360–54371. https://doi.org/10.1109/ACCESS.2019.2913439.
[11] System identification of PEM fuel cells using an improved Elman neural network and a new hybrid optimization algorithm. Energy Reports, 2019, 5: 1365–1374.
[12] Intelligent outage probability prediction for mobile IoT networks based on an IGWO-elman neural network. IEEE Transactions on Vehicular Technology, 2021, 70(2): 1365–1375. https://doi.org/10.1109/TVT.2021.3051966.
[13] An improved OIF Elman neural network based on CSO algorithm and its applications. Computer Communications, 2021, 171: 148–156.
[14] Tennison: a distributed SDN framework for scalable network security. IEEE Journal on Selected Areas in Communications, 2018, 36(12): 2805–2818. https://doi.org/10.1109/JSAC.2018.2871313.
[15] An intelligent agriculture network security system based on private blockchains. Journal of Communications and Networks, 2019, 21(5): 503–508. https://doi.org/10.1109/JCN.2019.000043.
[16] IoT network security: threats, risks, and a data-driven defense framework. IoT, 2020, 1(2): 259–285.
[17] Distribution network security situation awareness method based on security distance. IEEE Access, 2019, 7: 37855–37864. https://doi.org/10.1109/ACCESS.2019.2906779.
[18] A network security entity recognition method based on feature template and CNN-BiLSTM-CRF. Frontiers of Information Technology & Electronic Engineering, 2019, 20(6): 872–884.
[19] PCCN: parallel cross convolutional neural network for abnormal network traffic flows detection in multi-class imbalanced network traffic flows. IEEE Access, 2019, 7: 119904–119916. https://doi.org/10.1109/ACCESS.2019.2933165.
[20] AdaptAhead optimization algorithm for learning deep CNN applied to MRI segmentation. Journal of digital imaging, 2019, 32(1): 105–115.
[21] A dilated inception network for visual saliency prediction. IEEE Transactions on Multimedia, 2019, 22(8): 2163–2176. https://doi.org/10.1109/TMM.2019.2947352.
[22] System identification of PEM fuel cells using an improved Elman neural network and a new hybrid optimization algorithm. Energy Reports, 2019, 5: 1365–1374. https://doi.org/10.1016/j.egyr.2019.09.039.
[23] Triple archives particle swarm optimization. IEEE transactions on cybernetics, 2019, 50(12): 4862–4875. https://doi.org/10.1109/TCYB.2019.2943928.
Biographies

Liu Zhang obtained an engineering degree from Guilin University of Electronic Technology in 2008. She is currently an information system project manager and lecturer in the Department of Electronic information engineering of Beihai Vocational College. She has participated in research on multiple projects, including big data analysis and blockchain applications. She has published multiple articles in the journal. Her areas of interest include information security, system development, and machine learning.

Yanyu Liu obtained his Master in Computer Application Technology (2010) from Guilin University of Technology, Guilin. Presently, he is working as Associate Professor in the Department of Electronic Information Engineering, Beihai Vocational College, Beihai. He has participated in the research of multiple projects, including natural human-computer interaction, software reverse engineering, Web3D education software. He has published more than 20 articles in journals and conferences proceedings. His areas of interest include human-computer interact, emotion recognition, action recognition and machine learning.
Journal of Cyber Security and Mobility, Vol. 12_4, 547–568.
doi: 10.13052/jcsm2245-1439.1245
© 2023 River Publishers