Research on Anomaly Detection in Vehicular CAN Based on Bi-LSTM
Xiaopeng Kan1, Zhihong Zhou2, 3, Lihong Yao1,* and Yuxin Zuo1
1School of Cyber Science and Engineering, Shanghai Jiao Tong University, Shanghai, China
2Institute of Cyber Science and Technology, Shanghai Jiao Tong University, Shanghai, China
3Shanghai Key Laboratory of Integrated Administration Technologies for Information Security, Shanghai, China
E-mail: yaolh@sjtu.edu.cn
*Corresponding Author
Received 07 March 2023; Accepted 29 March 2023; Publication 12 August 2023
Abstract
Controller Area Network (CAN) is one of the most widely used in-vehicle networks in modern vehicles. Due to the lack of security mechanisms such as encryption and authentication, CAN is vulnerable to external hackers in the intelligent network environment. In the paper, a lightweight CAN bus anomaly detection model based on the Bi-LSTM model is proposed. The Bi-LSTM model learns ID sequence correlation features to detect anomalies. At the same time, the Attention mechanism is introduced to improve the model’s efficiency. The paper focuses on replay attacks, denial of service attacks and fuzzing attacks. The experimental results show that the anomaly detection model based on Bi-LSTM can detect three attack types quickly and accurately.
Keywords: Internet of vehicles, CAN, anomaly detection, Bi-LSTM.
1 Introduction
The Internet of Vehicles (IoV) is the product of the integration of the new communication technology and the automobile industry. The automobile industry is developing towards the direction of electrification, network connection and intelligence. At the same time, vehicle security issues are increasingly prominent, such as network security and data security. All these have become obstacles to the development of intelligent connected vehicles. Based on the traditional mechanical structure, the intelligent connected vehicle integrates various components efficiently, such as sensors, electronic control components, actuators, and communication facilities. The components form a complete in-vehicle network through interconnection to ensure the normal operation of the vehicle. All kinds of electronic control units (ECU) in the car cooperate to realize the vehicle’s functions. Generally, a car has about 50–70 electronic control units of various types [1]. They acquire information from sensors, transmit information, process information and finally feed the processed information back to the appropriate actuators to realize the various functions in the car.
A controller area network has a wide range of applications, low cost and a certain fault tolerance ability. The CAN network generally used in critical system functions such as control and power systems. The CAN network was mainly used for in-vehicle communication at the beginning of the design, so the plaintext transmission lacks effective authentication and encryption mechanism. When the vehicle communicates with the external network, CAN network security risks continue to increase. CAN network is easy to suffer from external intrusion.
In recent years, there have been more and more attacks on the internet of vehicles. According to the 2020 Automotive Cybersecurity Report, automotive cybersecurity incidents have increased by 605% from 2016 to January 2020 and more than doubled in 2019 alone [2]. In 2020, a hacker successfully developed a new key cloning “Relay Attack” for Tesla cars and demonstrated it on the Tesla Model X electric car [3]. Security researchers have found a vulnerability in Honda cars that allows attackers to unlock and start the vehicle [4].
The series of incidents shows that car security should receive more attention, so it is necessary to perform anomaly detection on the CAN network. To ensure the security of the CAN network, researchers have proposed various anomaly detection methods for the CAN network, but most of them face the following challenges:
First, the resources of ECUs are limited. The system structure of an intelligent connected vehicle determines the limit of available ECU resources in the vehicle, and the anomaly detection system deployed on the ECUs should be lightweight.
Second, it is difficult to ensure a timely response to various attacks. The capability of an anomaly detection system is limited by the detection method, which may miss some kinds of attack. In addition, some specific types of anomaly attacks, such as replay attacks, are hidden and difficult to detect.
To solve the above problems, the paper proposes a lightweight CAN network anomaly detection method based on the Bi-LSTM model. Firstly, the attacks of the CAN network are analyzed and summarized, and the characteristics of various attack types are clarified. Secondly, the CAN ID in the CAN message is explored in depth. Next, the Bi-LSTM model is optimized to improve the training efficiency. Finally, the model parameters are adjusted to optimize the anomaly detection model.
The main contributions of the paper are as follows:
(1) Only ID sequences are used as the input of the detection model. The detection model is simple and efficient for the attacks introducing different ID sequences.
(2) Attention mechanism is combined in the Bi-LSTM model. Thus the anomaly detection is faster than those detection algorithms based on the ordinary LSTM model, and can obtain better detection efficiency.
(3) The detection efficiency of replay attacks is improved by considering the characteristics of replay attacks. A replay attack usually changes the association relationship between CAN IDs. So the association relationship between CAN IDs is explored and used in the detection model. The detection efficiency of replay attacks is significantly higher than other anomaly detection models based on LSTM.
The rest of the paper is organized as follows. Section 2 discusses the latest research progress of CAN network anomaly detection. Section 3 introduces the CAN message structure, the characteristics of the CAN protocol, and the security risks. Then, Bi-LSTM model and attention mechanism are described. Section 4 introduces the anomaly detection model proposed in the paper. Section 5 analyzes and compares the experimental results. Section 6 summarizes the work of the paper and proposes the future research.
2 Related Work
For a long time, researchers have carried out continuous research on various security risks of CAN networks. In practice, several methods are often combined. The differences in detection methods can be roughly divided into three types: protocol-based, feature-change-based, and machine learning-based [5, 6]. The anomaly detection model in the paper belongs to the machine learning-based detection methods.
Groll et al. proposed a structured anomaly detection method for an in-vehicle CAN network. By introducing a set of anomaly detection sensors to test the data characteristics such as message ID, data field, and message frequency, the anomaly detection method can detect vehicles in everyday driving and almost no false positives [7]. Mubarak Jedh et al. proposed an anomaly detection model based on Long short-term memory (LSTM) and Recurrent Neural network (RNN). The threshold and LSTM-RNN models detect malicious messages injected into the CAN network [8]. Konglin Zhu et al. proposed a multi-task LSTM mechanism based on mobile edge-assisted technology for anomaly detection in in-vehicle CAN networks, which integrates the features of the time dimension and data dimension to improve the accuracy of the anomaly detection model [9]. Taylor et al. also designed an LSTM-based anomaly detection system to detect whether the CAN network is under attack. The model learns and predicts the data field content of each CAN message from the same sender and realizes anomaly detection by comparison. The advantage of the model is that it can identify various attacks with low false positives [10]. Loukas et al. proposed a detection system for vehicular networks using several machine learning classifiers. They performed the detection by injecting a cloud-based attack into the experimental vehicle. The experimental results show that the LSTM method is more suitable for anomaly detection in the vehicle [11].
Considering the limited resources in the vehicle, the paper studies the lightweight anomaly detection technology of the in-vehicle CAN network based on the Bi-LSTM model to quickly detect abnormal attacks against the CAN network.
3 Related Background
This section briefly introduces CAN packets and their characteristics while analyzing three typical attack modes against in-vehicle CAN networks.
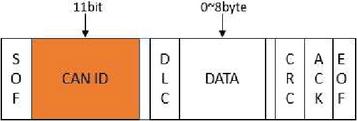
Figure 1 Format of CAN data frame.
3.1 Characteristics of CAN Packets
CAN protocol is an integral part of vehicle communication. It is responsible for the transfer of information between ECUs. CAN network is widely used in necessary system functions such as body control systems and power systems because CAN network is low cost, suitable for long-distance transmission [12]. The standard frame format for CAN networks is shown in Figure 1.
• SOF: frame starts bit. They are generally used to synchronously notify all nodes about the start of transmission of the relevant CAN message.
• CAN ID: Identifier. The CAN ID is the identification number for the message received by the ECU and it is 11 bits in size, with a lower ID value indicating a higher priority.
• DLC: Length of data. DLC indicates the data field length in bytes and should range between 0 and 8 bytes.
• DATA: Data field. It records the specific information content of the CAN packet transmission, interpreted by the received ECU.
• CRC: Check code. It is used to detect an error in the transmission of the message. The CRC field size is 16 bits.
• ACK: Confirmation code. They are used to get an acknowledgment reply from the receiver node that the CAN message was correctly received.
• EOF: End of the frame. This field indicates the end time of the CAN message.
CAN ID can uniquely determine a kind of message and represent the priority order of the message. Due to the vehicle operation having a particular law, the ID sequence is also periodic. The IDs are correlated with each other, providing conditions for constructing an anomaly detection model.
3.2 CAN Network Attack Methods
The attack scenario of the anomaly detection technology studied in the paper is as follows: assuming that the attacker has controlled some ECUs in the CAN network, various types of attack packets are sent to the CAN network through these ECUs. Therefore, three types of attack are mainly introduced as follows [13]:
(1) Replay attack: the attacker intercepts the CAN packets generally transmitted in a period and resends them to the CAN network at any time. The attacker can send them alone or continuously [14]. Although these replayed messages are regular, the running state of the vehicle changes in real-time, and the replayed messages are likely to cause wrong operation responses, which will bring risks to driving safety. Replay attacks will cause the periodicity and correlation of CAN message ids in the CAN network to change, so we can build a model to detect replay attacks based on the feature.
(2) Denial of Service (DoS) attack: the attacker uses the CAN network’s arbitration mechanism to inject many high-priority message-ids into the CAN network, such as the standard message with an ID value of ‘0000’. The high-priority message has no practical significance, but it will be preferentially responsive, occupy vehicle resources, and in severe cases, the system will be paralyzed, which is more harmful [15]. Denial of service attacks can also cause changes in the periodicity and interrelatedness of ids.
(3) Fuzzing attack: the attacker generates random CAN message data in line with the CAN message format and sends these data to the CAN network. These CAN messages may consume resources meaninglessly or cause unexpected behavior in the CAN network, which brings security risks [16]. Due to the lack of security mechanisms in the CAN network system, attackers can easily inject all kinds of fuzzy information into the CAN network, which will cause system failures, such as the abnormal switch of signal lights. The randomly injected ids have a low correlation with the current packet flow, so the correlation relationship and time interval characteristics between the original CAN packets are broken.
It can be seen that the three kinds of attacks will lead to changes in the periodicity and correlation of CAN ID. Therefore, the paper uses CAN ID as the feature to build an anomaly detection model.
4 The Anomaly Detection Model of the In-vehicle CAN Network
The anomaly detection model proposed in the paper has three stages: data processing, model training and testing. In the data processing stage, the data set is processed adequately according to the needs of our model, and the data format is unified to facilitate subsequent feature selection and training. The model training stage is the core content of our anomaly detection. By constructing an anomaly detection model, continuous training, and optimizing various parameters, the detection effect of the model is improved. In the testing phase, our proposed model is compared with other models.
4.1 Data Processing
The data set used in the paper is the HCRLab public data set of Korea [17] (the HCRLab dataset), which contains the normal dataset, the DoS attack dataset, and the Fuzzing attack dataset. The data set is recorded through the OBD-II port. The normal dataset is the one that does not contain the attack data and records the data when the vehicle is in regular motion. The attack injection of the dataset is as follows:
• DoS attack: Inject ‘0000’ CAN ID message every 0.1 ms, “0000” has the highest priority and no valid information.
• Obfuscation attack: Injecting messages with completely random CAN ids every 0.5 ms.
At the same time, the replay attack dataset in the paper adopts the replay attack dataset of the official competition dataset of South Korea [18]. The dataset constructs the replay attack by extracting regular traffic within a specific time from average data and randomly replaying it on the CAN network.
We preprocess the data to unify the format of CAN packets. In the paper, CAN message ID is extracted from original CAN message data for learning and detection.
4.2 ID Sequence Processing
In the CAN message data stream, the messages with different ids correspond to different functional purposes. Therefore, the ids in the data stream are not uniform. There may be some with higher frequency and some with lower frequency. In the paper, the situation’s actual test and analysis are carried out using the HCRLab data set [17]. The frequency of ID occurrence in the whole data set represents the probability of ID occurrence, and the distribution probability of each ID in the data set is statistically analyzed. The results are shown in Figure 2.

Figure 2 ID distribution probability diagram.
For normal packets in the data set, there is usually a strong correlation between specific ids. Therefore, the Bi-LSTM model is adopted in the paper to detect anomalies.
The correlation in the ID sequence is that whenever a specific ID appears, the following ID has a significant probability of appearing as the ID with a strong correlation with the ID. In contrast, the other IDs have no such characteristics.
The paper considers the ordered pair of (ID, following ID) as a binary array. The probability of different binary arrays is different in the normal CAN network packet flow. The combination of binary arrays is called ID transition, and its probability of occurrence is the transition probability of ID.
Based on the HCRLab data set [17], the heat map shown in Figure 3 can be obtained by analyzing the typical data set. The heat map represents the correlation between the different ids. The darker the color, the closer the correlation and the stronger the correlation. The results presented in Figure 3 are consistent with the expected data set analysis.
The Bi-LSTM model constructed in the paper only takes ID as the feature input, so the model input is one-dimensional data. In order to speed up the convergence of the model, each legal ID is assigned a different positive index. When the ID is used as a feature input, it is mapped to the specified index. The mapping method is fixed, and the hexadecimal ID is mapped to a discrete integer. The specific mapping method counts the different ids in the ordinary packet. It maps them to a discrete integer (0 – the total number of all ids minus 1) according to the sequence of different ids that appear in the statistical process. If an illegal ID occurs, its index is specified as 10. The mapping diagram is shown in Figure 4.
In Figure 4, the ID with an ID value of 0350 is assigned the index 0, and the ID with an ID value of 02c0 is assigned the index 1…When an ID with 0350 is reencountered, its index is 0.
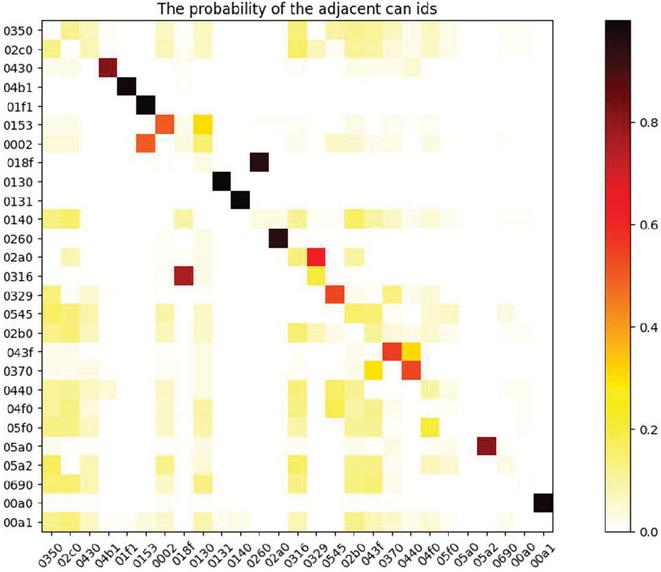
Figure 3 Adjacent ID bivariate heat map.
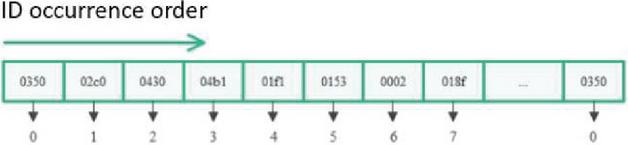
Figure 4 ID mapping diagram.
4.3 Model Construction
The paper adopts the Bi-LSTM model combined with the Attention mechanism. The attention mechanism’s introduction further accelerates the model’s training speed. The Bi-LSTM model further improves the analysis and learning ability of time series information. It can more fully reflect the association of ID sequences so that the anomaly detection model can effectively detect multiple attacks by only relying on a single ID feature. During prediction, the next most likely ID value is predicted according to the input ID value, and the predicted value is compared with the actual value. The paper sets a threshold. The difference between the predicted and actual values is calculated. The anomaly is determined if the average value of the difference exceeds the threshold in a certain period.
Bi-LSTM is a network that combines forward LSTM and backward LSTM. The forward LSTM encodes information from backward to forward, while the backward LSTM is just the opposite [19]. Bi-LSTM can better capture the bidirectional semantic dependence. The weight matrix and state information of Bi-LSTM comprises the matrix corresponding to the forward and backward LSTM. After using Bi-LSTM, it is generally necessary to construct a fully connected layer for the output of each step of the loop body to obtain the final result and then use the function to normalize. The architecture of Bi-LSTM is shown in Figure 5.
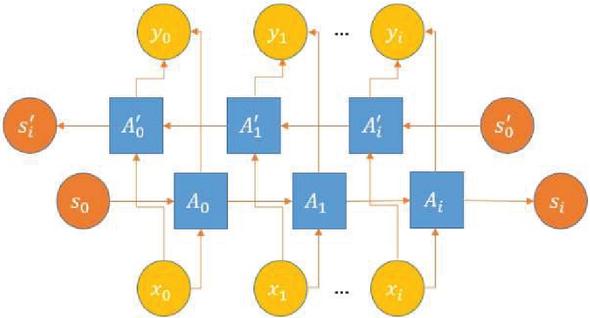
Figure 5 Bi-LSTM structure diagram [20].
The LSTM model used in the paper does not join and together but does the corresponding operation, which makes the LSTM model parameters change in more detail. The front and back sequence is more closely related. The formula of the model is as follows:
| (1) | ||
| (2) | ||
| (3) | ||
| (4) |
Where is the current moment, is the activation function of , is the memory cell, is the hidden state, is the data input, is the forget gate, is the update gate, is the output gate, is the weight, is the residual, and the and subscripts correspond to the actual state.
Next, the Bi-LSTM structure is further built based on the modified LSTM model in the paper. The model parameter configuration is shown in Table 1, and the Attention mechanism is introduced when building.
The Attention mechanism is introduced to speed up the training speed of the model. Its core content is how to calculate the weight, so the paper uses the multi-layer perceptron method. When the attention mechanism is applied to the Bi-LSTM model, it can make the model quickly lock sufficient information from a large amount of information, eliminate useless information, and improve learning efficiency.
The attention mechanism used in the paper is the multi-layer perceptron method, which three formulas can express:
| (5) | |
| (6) | |
| (7) |
Table 1 Model parameter configuration
| Parameters | Configuration/Values |
| Batch size | 512 |
| Scrambling or not | no |
| Learning rate | 0.002 |
| Input dimension | 1 |
| Step length | 30 |
| Number of hidden layers | 1 |
| Hidden state size | 100 |
| Direct output vector size | 100 |
| Tail | Attention 1 layer fully connected layer |
| Optimizer | Adam |
| Loss function | MSELoss |
The variables in the formula have the following meaning:
:Hidden layer and output.
:The result of H after the hyperbolic tangent function tanh.
:Initialize a random value matrix parameter [batch_size * (hidden_size * 2) * 1]. It will be updated according to the model and can be understood as a parameter of the model.
:The matrix product of and is output by the softmax function
:The matrix product of and , the result of the Attention mechanism, replaced participate in subsequent calculations.
Next, we construct the network structure shown in Figure 6. The model read the pretreatment ID index data and input it into the model for training. Currently, the input is the ID index value obtained by mapping in the preprocessing process. The relationship between IDs is learned through forward and backward learning, and the output value is given as a prediction.
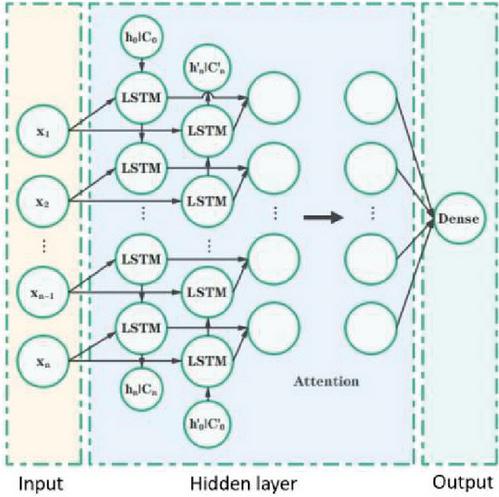
Figure 6 Bi-LSTM model network structure.
5 Experimental Results and Discussion
In the section, we will train the constructed model, adjust the experimental parameters, optimize the model, conduct an experimental comparison, and show the superiority of our experimental results by comparison.
5.1 Data Processing
The preprocessed CAN message data is large in scale. The paper only needs big data in the training process. The test process does not need it. In order to improve the detection efficiency, we further divide the CAN message. The paper segments the data set according to 3 s time, so 176 sub-datasets are obtained. Each sub-data set has 5000 CAN messages. According to statistics, each sub-dataset contains all ID sequences, ensuring the completeness of each sub-dataset ID sequence. We divided the data set into training and test sets in an 8:2 ratio.
The model uses the CAN message ID as the only feature value. The ID length in the CAN protocol is 11 bits. However, the number of IDs in the actual in-vehicle CAN network is far less than 2. Therefore, the paper assigns a corresponding integer index value to each ID, which is convenient for the training and detection of the model. During training, the Bi-LSTM model fully learns the correlation between the index values. The correlation between the ids can be determined through the association between the index values. The predicted value of each round of learning is compared with the actual value, and the effect of learning can be seen through comparison.
5.2 Performance Metrics
The goal of anomaly detection in the paper is to determine whether there is abnormal data in the sequence, so regular messages and message sequences are taken as ordinary data, and abnormal attack messages or sequences are taken as abnormal data. ACC is used as the primary judgment basis. The higher ACC is, the higher the detection ability of data is. The main three formulas are shown in (8), (9), and (10):
| (8) | |
| (9) | |
| (10) |
Where ACC stands for accuracy, TPR stands for the proportion of correct predictions, and FPR stands for the proportion of incorrect predictions. These formulas are most commonly used in anomaly detection. In addition, P/N represents average/abnormal data in the dataset, TP represents standard data, and the model’s output for the data is also normal. FP means the data is abnormal, but the model output is standard. TN indicates that the data and the model’s output are also abnormal. FN means the data is standard, but the model’s output is abnormal.
5.3 Training Process
In the process, the data set is first read, and the data set is divided into the training data set and a test data set according to the ratio of 8:2, which are used for model training and testing, respectively. For the training data set, the model will read the ID feature of the training data set. The ID feature is not used directly but is mapped to an integer sequence starting from 0 by fixed mapping according to the ID preprocessing method in Section 4.1, and all IDs are given a corresponding index. The length and step of the ID sequence for a single input are the same, all 30. For the predicted data set, the window of statistical threshold should be determined. The difference between the predicted and actual values is the basis for judgment in the test process. The single difference is accidental, so the average difference in a fixed time window should be counted. Through many experiments, the final window is 30, which is consistent with the length of the input ID sequence. At the same time, the average time taken to process a single data is defined as the total time divided by the length of the data set.
Next, the obtained ID index was input into the Bi-LSTM model network structure for training. The loss function of the training process was the Mean Square Error (MSE) loss function. The loss value was saved in the training process, and the model parameters were saved. In the training process, a threshold was also needed to determine whether it was an illegal ID sequence in the detection stage. Due to the occasional difference between the predicted value and the real value, the model selects the maximum value of the average loss of each feature vector in a batch as the threshold, rather than the maximum value of all feature vector loss, which allows the occurrence of occasional abnormal situations in the prediction process. The calculation of Avg Loss within a batch is shown in Figure 7.
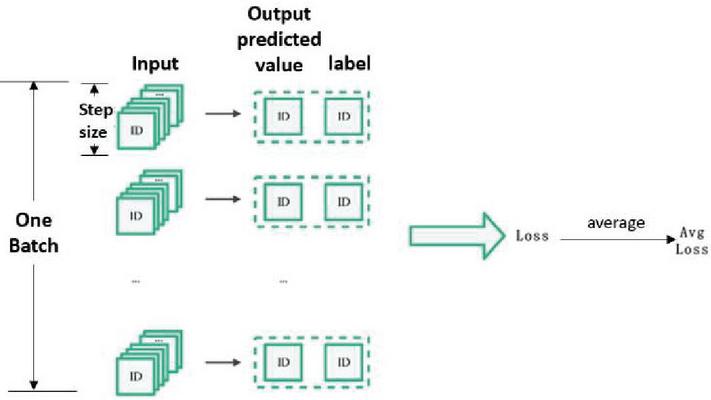
Figure 7 Schematic diagram of the calculation process of Avg Loss value.
At the same time, training draws the lost image and saves the loss for the next training. Through many experiments, it is found that 300 training rounds can achieve the best training effect.
After the model is trained with the training data set, the prediction data set is input into the model for prediction. The current threshold is determined and the predicted label is determined according to the threshold. The line chart is drawn to compare the predicted and actual values. The data values of ACC, TPR, and FPR are calculated for result analysis.
5.4 Experimental Comparison
Firstly, the effect of the Attention mechanism in Bi-LSTM is verified. In the Bi-LSTM implementation, the Loss results of the model using four linear layers plus function and the Attention mechanism plus function are compared, as shown in Figures 8 and 9.
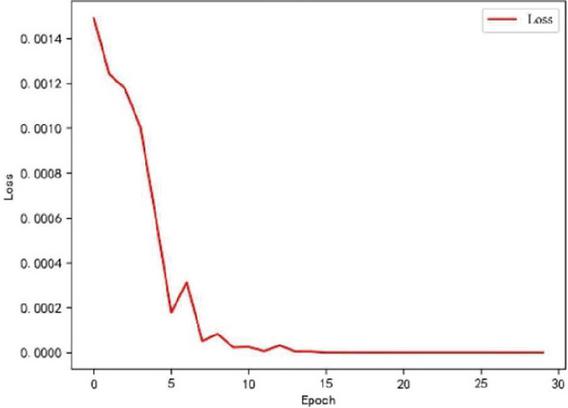
Figure 8 Change in loss value without attention.
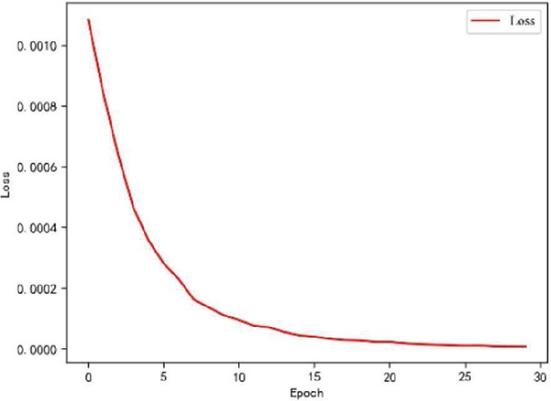
Figure 9 Change in loss value with attention.
The horizontal axis of Figures 8 and 9 is the training rounds, and the vertical axis is the loss value. The convergence of LSTM is more stable after using the Attention mechanism, and the convergence of the model in the early stage of training is accelerated.
Second, we observe whether the training converges. The parameters are adjusted appropriately according to the training results in model training, and the training rounds are gradually adjusted. With increasing training rounds, the loss value gradually decreases and tends to be stable.
Figures 10 and 11 show the change in Loss for 100 and 300 training rounds, respectively. Here, the horizontal axis is the number of training rounds, and the vertical axis is the Loss. As the number of training rounds increases, the loss function gradually becomes stable. At 100 rounds, the Loss still does not converge, showing a diagonal line. At 300 rounds, the Loss value has converged.

Figure 10 Loss chart for training 100 rounds.
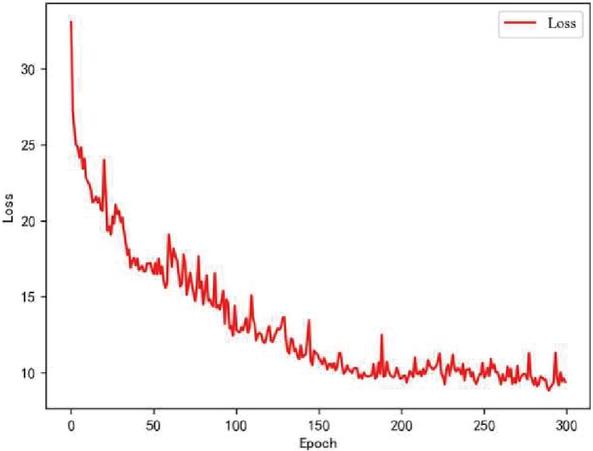
Figure 11 Loss chart for training 300 rounds.
In the experiment, the matching between the predicted value and the actual value during the training process is recorded. The specific situation of the training is observed by observing the degree of overlap between the predicted curve and the actual value curve. With the gradual completion of training, the difference between the predicted value and the actual value will gradually become smaller. The coincidence degree of the predicted value curve and the actual value curve will become higher. The training effect will improve. The changes in the training effect of the model are shown in Figures 12, 13, and 14. They represent the effects of 30 rounds, 150 rounds, and 300 round, respectively. The red line in the figure represents the model’s predicted value, and the blue line represents the actual ID value.
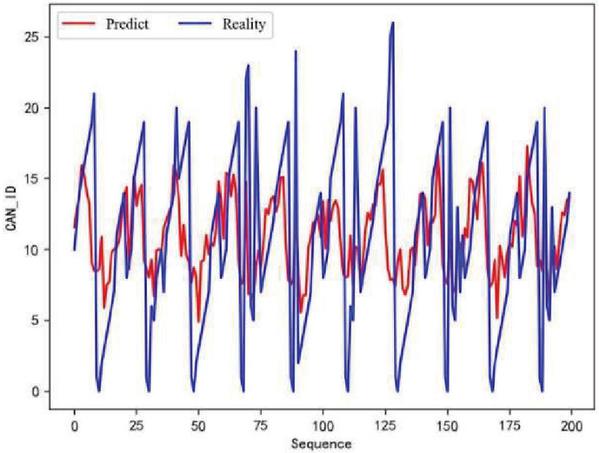
Figure 12 30 rounds of training effect.
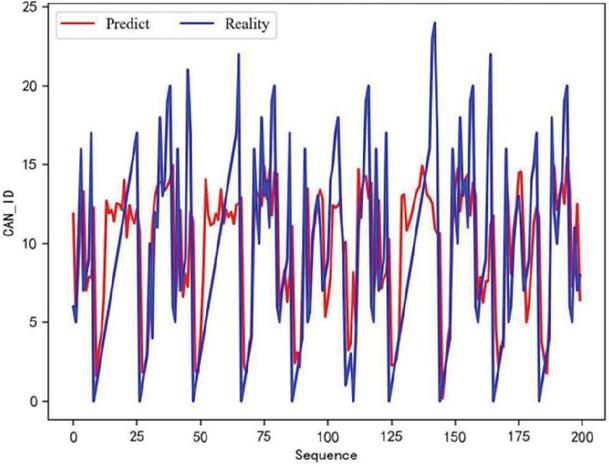
Figure 13 150 rounds of training effect.
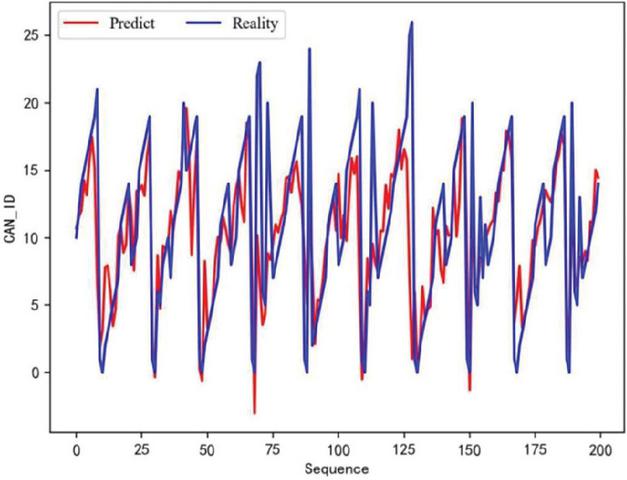
Figure 14 300 rounds of training effect.
As shown in the figure, as the number of training rounds of the model increases, the consistency of the red and blue lines becomes closer and closer. This indicates that the gap between the predicted value and the actual value is narrowing.
Finally, to verify the effectiveness of the method proposed in the paper, the paper [21] and paper [22] are selected for testing and comparison. In the paper [21], Araya Kibrom Desta et al. proposed a CAN network anomaly detection algorithm based on LSTM. It first injected attacks into the CAN network system in a car and then generated attack data sets and used them to train and test the model. The paper [21] does not test replay attacks. The paper tests the model of the paper [21] with replay attacks and compares it with the model of the paper.
In the paper [22], Safifi Ullah et al. proposed an anomaly detection method based on Long Short-Term Memory (LSTM) and Gated Recurrent Unit (GRU). It first optimizes the data set and combines Short-Term Long Memory (LSTM) and Gated Recurrent Unit (GRU) to build an anomaly detection model. The paper [22] mainly tested the detection effect of distributed denial of service attacks. It did not test replay attacks, so we used its model structure to test three attacks.
The detection results for the three attacks are shown in Table 2. The detection effect of the Bi-LSTM model for the Fuzzing attack in the paper is not much different from that of the paper [22] and [22]. However, the detection effect of the Bi-LSTM model in the paper on replay attacks and DoS attacks is significantly higher than that of paper [22] and [22]. For replay attacks, the detection effect of paper [21] is 86.3746 %, and the detection effect of paper [22] is 90.3990 %. The detection effect of the model on the Replay attack can reach 92.7993%, which is better than other models. This is because the Bi-LSTM model has a more efficient learning ability for the correlation between time series, which can better explore the correlation between time series to detect Replay attacks better.
| Attacks | ACC | FPR | TPR | |
| Paper [21] | Replay | 86.3746% | 7.7064% | 83.4969% |
| Paper [22] | 90.3990% | 8.3647% | 89.8193% | |
| Our paper | 92.7993% | 2.9135% | 90.7889% | |
| Paper [21] | DoS | 92.8571% | 12.5131% | 100.0000% |
| Paper [22] | 89.4689% | 18.8811% | 100.0000% | |
| Our paper | 97.9898% | 3.3889% | 99.7286% | |
| Paper [21] | Fuzzing | 96.1585% | 5.5802% | 99.8138% |
| Paper [22] | 91.2391% | 12.9448% | 99.9078% | |
| Our paper | 95.8296% | 5.8719% | 99.3548% |
In addition to testing the detection effect of DoS, Fuzzing and Replay attacks, the three models’ training and detection speeds are also compared. Taking the replay attack as an example, the average training time was calculated through several experiments, including the training time of a single message and the total time to complete the detection. As shown in Table 3, the time results are obtained.
Table 3 Comparison table of training times
| Average Individual Training Time (s) | Average Total Testing Time (s) | |
| Paper [21] | 0.381096 | 47.4391 |
| Papers [22] | 0.391578 | 50.6457 |
| Our paper | 0.363567 | 38.2989 |
According to Table 3, in terms of training time, the proposed model is consistent with the general LSTM model. Although the Bi-LSTM model is more complex, thanks to the acceleration of the Attention mechanism, the training speed of the Bi-LSTM model is significantly improved, and the more training rounds, the more pronounced the effect of the Attention mechanism. The model combining LSTM and GRU in the paper [22] is relatively complex, and the detection speed is slow.
Regarding detection time, the detection speed based on the Bi-LSTM model in the paper is significantly faster than that in papers [21] and [22]. As can be seen from Table 3, the detection speed is more than 20% faster, This is because the Bi-LSTM model in the paper has stronger ability and higher efficiency in learning the associated features of ID sequences. Hence, the detection effect is better.
6 Conclusion
The paper proposes a CAN network anomaly detection method based on the Bi-LSTM model. The Bi-LSTM model combines the Attention mechanism to speed up the training and convergence of the model. The model only uses the single feature of the CAN message ID sequence, which CAN quickly detect the attack type that destroys the characteristics of the CAN message ID sequence. After sufficient training, the model in the paper has satisfactory effects against DoS, Fuzzing and Replay attacks. With the powerful learning ability of the Bi-LSTM model and the correlation relationship between ID sequences, our model can accurately detect the abnormal changes in ID sequence context, thus effectively improving the detection effect of three attacks.
In the future, more in-depth research will start from the following two aspects:
It is necessary to obtain or construct more suitable and available public datasets. The paper uses two public datasets from South Korea for testing but needs further data comparison. The first is to expand the dataset.
Second, the Bi-LSTM model has a pronounced detection effect on attacks that destroy the characteristics of the ID sequence. If we want to detect an attack on the data field, it is necessary to combine the content of the data field further.
Fundings
This work was supported by Shanghai Automotive Industry Sci-Tech Development Foundation (No. 2001).
References
[1] F. Amato, R. Nardone and A. Santone, et al. “CAN-Bus Attack Detection With Deep Learning [J].” IEEE Transactions on Intelligent Transportation Systems, pp. 5081–5090, 2021.
[2] “Upstream security’s 2020 global automotive cybersecurity report.” [Online]. Available: https://upstream.auto/upstream-security-global-automotive-cybersecurity-report-2020/. [Accessed 15 March 2023].
[3] “Hackers steal Tesla Model X in two and a half minutes: Bypass new encryption technology”. [Online]. 2020, Available: https://www.thepaper.cn/newsDetail\_forward\_10116839. [Accessed 15 March 2023].
[4] “BLACKHAT issues reading: new attack that enter the system for auto remote keyless. ROLLBACK.” [Online]. 2022, Available: http://blog.nsfocus.net/blackhat/. [Accessed 15 March 2023].
[5] M. Yan, J. Li, and G. Harpak, “Security research report on mercedes benz cars”, Black Hat USA, 2020, 38.
[6] Gmiden M, Gmiden M H, Trabelsi H. “An intrusion detection method for securing in-vehicle CAN bus[C].” Sciences and Techniques of Automatic Control and Computer Engineering (STA), 17th International Conference on. IEEE. pp. 176–180, 2016.
[7] T. Liu, H. Jin, and A. Li, et al. “Bi-LSTM Model for Time Series Leaf Area Index Estimation Using Multiple Satellite Products[J].” IEEE Geoscience and Remote Sensing Letters, pp. 1–5, 2012.
[8] T. C. M. Donmez, “Anomaly Detection in Vehicular CAN Bus Using Message Identifier Sequences[J].” IEEE Access, pp. 105–108, 2021.
[9] Peng J, Zhang Z H, He H. “A Method for Detecting Abnormality of CAN Bus in Vehicle[J].” Chinese Journal of Scientific Instrument. pp. 28–33, 2017.
[10] Woo S, Jo H J, Lee D H. “A practical wireless attack on the connected car and security protocol for in-vehicle CAN[J].” IEEE Transactions on Intelligent Transportation Systems, pp. 993–1006, 2015.
[11] S.-F. Lokman, A. T. Bin Othman and M.-H. Abu-Bakar. “Optimized Structure of Convolutional Neural Networks for Controller Area Network Classification[C].” 14th International Conference on Natural Computation, Fuzzing Systems and Knowledge Discovery (ICNC-FSKD), pp. 475–481, 2018.
[12] Huang Y, Qin G H, Liu T, et al. “Strategy for ensuring in-vehicle infotainment security[C].” Applied Mechanics and Materials. pp. 5460–5465, 2014.
[13] T. Liu, H. Jin, and A. Li, et al. “Bi-LSTM Model for Time Series Leaf Area Index Estimation Using Multiple Satellite Products[J].” IEEE Geoscience and Remote Sensing Letters, pp. 1–5, 2012.
[14] Song H M, Kim H R, Kim H K. “Intrusion detection system based on the analysis of time intervals of CAN messages for the in-vehicle network[C].” International conference on information networking (ICOIN). pp. 63–68, 2016.
[15] Qin J, Li M, Shi L, et al. “Optimal denial-of-service attack scheduling with energy constraint over packet-dropping networks[J].” IEEE Transaction on Automatic Control, pp. 1648–1663, 2018.
[16] T. C. M. Donmez, “Anomaly Detection in Vehicular CAN Bus Using Message Identifier Sequences[J].” IEEE Access, pp. 109–108, 2021.
[17] E. Seo, H.M. Song, H.K. Kim. “GIDS: GAN based intrusion detection system for in-vehicle network[C].” 2018 16th Annual Conference on Privacy, Security and Trust (PST), pp. 1–6, 2018.
[18] Hyunjae Kang, Byung Il Kwak, Young Hun Lee, et al. “Car Hacking: Attack and Defense, 2020 Dataset.” https://dx.doi.org/10.21227/qvr7-n418. [Accessed 15 March 2023].
[19] T. Zhang, X. Liu, H. Lin, et al. “End-to-end Answer Selection via Attention-Based Bi-LSTM Network[C].” 1st IEEE International Conference on Hot Information-Centric Networking (HotICN), pp. 264–265, 2018.
[20] T. Liu, H. Jin, and A. Li, et al. “Bi-LSTM Model for Time Series Leaf Area Index Estimation Using Multiple Satellite Products[J].” IEEE Geoscience and Remote Sensing Letters, pp. 1–5, 2012.
[21] A. K. Desta, S. Ohira, I. Arai, et al. “ID Sequence Analysis for Intrusion Detection in the CAN bus using Long Short Term Memory Networks[C].” IEEE International Conference on Pervasive Computing and Communications Workshops (PerCom Workshops), pp. 1–6, 2020.
[22] Ullah S, Khan MA, and Ahmad J, et al. “HDL-IDS: A Hybrid Deep Learning Architecture for Intrusion Detection in the Internet of Vehicles.” Sensors 22, no. 4: 1340.
Biographies

Xiaoping Kan is currently studying for a master’s degree at the School of Cyberspace Security, Shanghai Jiao Tong University, China. His main research areas are the security of Internet of Vehicles.

Zhihong Zhou received the Ph.D degree in Electronic engineering from Zhejiang University in 2005. He is currently working as an assistant researcher at the Institute of Cyber Science and Technology of Shanghai Jiao Tong University. His research areas include Network Security Risk Assessment, Cryptographic Application Security Assessment etc.

Lihong Yao received the Ph.D degree in Computer Science from Nanjing University in 2003. Now, she is an associate professor at the School of Cyberspace Security, Shanghai Jiao Tong University, China. Her research interests mainly include security of Internet of Vehicles and Big Data Analysis.

Yuxin Zuo is currently studying for a bachelor’s degree at the School of Cyberspace Security, Shanghai Jiao Tong University, China. His main research interests are the security of Internet of Things and Big Data Analysis.
Journal of Cyber Security and Mobility, Vol. 12_5, 629–652.
doi: 10.13052/jcsm2245-1439.1251
© 2023 River Publishers