Camera Network Topology Mapping Based on the Integration of Network Information and Physical Distribution Under the Background of Communication Security
Min Chen
Overseas Development Company, Zhejiang Post & Telecommunication Construction Co., Ltd, Hangzhou, 310016, China
E-mail: min_chen310@126.com
Received 20 April 2023; Accepted 21 May 2023; Publication 12 August 2023
Abstract
At present, most cameras use internal networks and use methods such as Traceroute for security protection, which cannot meet the requirements of camera network mapping. Therefore, a camera mapping scheme of network information and physical distribution is proposed. Firstly, the network topology problem of video content information collection was analyzed. This paper uses the mapping relationship between network space and physical space to propose the subnet division conjecture method and complete the preliminary mapping of the network through video data screening. Considering the insufficient coverage of topology mapping, a judgment and inference method based on Bayesian classification technology and network information is proposed, and the results are corrected and evaluated through the test of Jackard coefficient. In the preliminary network topology performance test, two state-of-the-art schemes are selected for experimental comparison. When the number of nodes in the proposed scheme is 5, 25, and 50, the mapping can be completed in the shortest time, and the accuracy reaches 80%. However, the surveying and mapping accuracy of the proposed scheme in the preliminary test is low, and the network information method is used for data screening. In the final surveying and mapping performance test, when the number of nodes is 40, the accuracy of the proposed scheme is 96%, which is better than previously proposed schemes, while the testing delay time is shorter. The technology proposed in the study has the best overall performance. It can effectively solve the problem of intranet surveying and mapping and has important reference value for the security protection of the camera network.
Keywords: Communication security, network information, physical distribution, camera network, topological mapping, network division inference method.
1 Introduction
Cameras are important devices for recording image, audio, and video data. They are used in all aspects of people’s lives including remote monitoring, video communication, traffic security, and other fields. Cameras meet people’s various functional needs through open networks and cloud technology, but the problem of data and information security is becoming more and more serious. Malicious parties can obtain important data from cameras through network vulnerabilities, and even interfere with the use of its functions. Most of the camera output information is a fixed protocol, and most cameras do not have the characteristics of heterogeneous protocols. In addition, there is no effective security standard for cameras, which makes the security problem of cameras more and more serious.
Network surveying and mapping are the basis for ensuring network security [1]. Through the use of cyberspace information and geographic information to obtain cyberspace and security features, a more effective and real cyberspace information map can be obtained. Traditional surveying and mapping cannot meet the security requirements of cameras that is why in this work we focus on research on network topology surveying and mapping [2]. Through the acquisition of information such as packet loss rate, hop count, and delay in the video, effective network space surveying for cameras can be performed. However, due to the large amount of network data information, data mining is more difficult, making it difficult to accurately identify camera position information through network information. Therefore, based on the relationship between the spatial position of the camera and the network topology, a topology mapping scheme integrating the two technologies is proposed. Compared with traditional network measurement technologies, the proposed technical solution can combine the advantages of spatial location relationships and network topology technology to improve the accuracy of network measurement through network positioning data and spatial location information. The solution designed in this work is of great significance for improving the security of camera network data.
Considering above the novel contribution of this work is:
(1) Regarding the issue of using video content information to determine the structure of camera networks, based on the idea of mapping between physical spatial distribution and network topology, a camera physical distribution inference method and a camera network spatial connection analysis method based on physical distribution are proposed. Compared to traditional network surveying, they are completer and more accurate.
(2) In response to the issue of incomplete initial mapping topology coverage, Bayesian classification technology and network information technology were innovatively adopted to describe information more accurately based on network information such as delay, hop count, and packet loss rate in local networks.
The specific workflow is mainly introduced in three parts. The first part analyzes and summarizes the latest research technologies, the second part constructs models for two camera network topology mapping methods, and the third part analyzes the model results.
2 Related Work
The arrangement of the camera in the physical space mainly refers to the positional arrangement relationship of the camera devices in the space environment. In the physical distribution, the camera equipment will collect the surrounding location parameters and correspond with the camera identification code.
Poliarus et al. [3] presented a scheme to represent landmark probability through camera coordinate feature parameters. The first is to select the color parameter distribution jump and obtain the position parameter according to the scanning of the environment. Secondly, the jump on the Hilbert-Huang transform scheme is used, and the corresponding position information is obtained.
According to Srisamosorn et al. [4], a video device is installed on the ceiling to monitor the movement information of the human head and limbs. Considering the spatial relationship of cameras, a directional gradient descriptor histogram is used instead of the traditional scheme. The description of various motion information and head parameters of things is suitable for monitoring and processing fish eye images. The obtained results show that the scheme can obtain the direction within 40 errors and has a good effect.
Bernhard et al. [5] observed the driving scene behind the car through different vertical and horizontal positions of the camera, and focused on the spatial relationship between the camera and the rearview mirror through the study of the traditional rearview mirror, so as to obtain the influence of different position information on the distance estimation of the driver. In the lower camera position, the distance will be high, while the lower position will cause the distance to be underestimated. Different rear viewpoints have an impact on the driver, and the position needs to be selected reasonably.
Yun et al. [6] studied the city monitoring system and used it to detect unauthorized garbage dumping in the camera, but it was not obvious in fact. In order to effectively improve the visibility of the monitoring, the space position of the camera is studied, the image of the person is analyzed to identify the object’s behavior, and the position relationship between the camera and the person is established. After verification, the scheme can effectively supervise the behavior information of the characters and has a good effect.
Fukuhara et al. [7] installed a thermal infrared camera for observation in space. Effectively set the camera position parameters to capture the image of the orbit of the sun. By comparing the camera data with the data before and after the experiment, the infrared camera perception brightness and target are determined.
Broadley et al. [8] concluded that cameras are often used in the observation environment of wild animals and plants, which is an effective monitoring scheme and can be used to judge the density of unlabeled animal populations. But dynamic object detection affects camera assumptions. Therefore, the position parameters of the camera system are studied to simulate the corresponding data of animal movement. Simulations were carried out to find that changes were underestimated for populations with a small range and low movement speed. Therefore, when using a special camera to monitor the relevant animals, it is necessary to determine the density and movement of the animal and to assume the animal movement law (in a more reasonably way) through the arrangement of the camera.
Camera space mapping is closely related to network topology. Based on network positioning technology, it can be applied to camera space mapping. Through effective network analysis and measurement, real geographic parameters and corresponding resources can be obtained, and the type and topology of the network can be obtained. Safety plays an important role. Xu et al. [9] found that the localization performance of underwater equipment is affected by the formation topology. Therefore, under the Fisher information matrix and the camera distance parameter, the relationship between distance and acoustic error is analyzed. Considering the ambiguity of information, a step-by-step recursive scheme is proposed to solve the system constraint problem. Simulations show that the MACL system composed of the following and the first three derivatives can complete the configuration optimization in the position fuzzy state, and the recursive scheme proposed cannot rely on the initial position information and is not affected by the optimal solution.
In their research, Jiang et al. [10] revealed that there is an error interference problem in the management of network topology, and interpret the problem as a low-rank matrix problem, and consider using an alternating algorithm to intervene in the problem to ensure an effective topology of the network. After experimental verification, the data shows that the proposed low-rank scheme can effectively improve the degree of freedom of the network and meet the corresponding requirements of the network.
Hou et al. [11] observed that the network topology in the network construction is the basis of the entire system construction. However, in most cases, enterprises do not expose topology data. To avoid malicious acquisition or destruction of network topology information and to obtain location information parameters, a scheme of active topology ambiguity is proposed. Use training behavior to identify abnormal behavior in network detection, and design topological confusion results to detect network delay and deceive attackers. The final experimental result proves that the adopted scheme can realize the efficient detection of information and effectively intervene in the external intervention of network topology information.
Zheng et al. [12] found that network security is very important in the information age, and the use of network virtualization technology is one of the key solutions to ensure security. The network mapping is the key, so the heuristic algorithm is used to solve the problem. The first step is to classify network information sources and apply faults and normal environments. And establish a new detection mechanism, optimize the network load, and select nodes for testing. After testing, the proposed scheme has excellent performance in network load, revenue and acceptance rate, and meets the target requirements.
It can be seen from the above research results that the camera position distribution is closely related to the network topology mapping. Using network topology information research, it can reflect network node information and location information, achieve high-precision network positioning, and ensure the safety and effectiveness of the camera network.
From the above research, traditional network surveying has low overall accuracy due to the detection of object information using a single node information. In the research, the overall surveying effect is improved by extracting network topology mapping relationships and location information. In the future, it is necessary to improve the extraction of node information to improve the accuracy of surveying and mapping.
3 Construction of the Camera Network Topology Mapping Model
In IoT systems, cameras are one of the important devices, which can capture environmental data. By calculating video content and traffic, the physical spatial distribution of cameras can be identified. At the same time, combining network topology with the spatial position relationship of objects can provide important references for camera network topology mapping.
3.1 Construction of Topology Model Based on Physical Distribution
Most of the urban surveillance cameras use the intranet blocked by firewall technology, which makes it difficult to map the network. Therefore, based on the physical distribution mapping scheme, through the analysis of the video data captured by the camera, regardless of the accuracy of the camera video image recognition, the behavior data of the characters in the video content is judged to complete the network mapping [13]. Among them, the behaviors and actions of the characters are recognized, and the transfer relationship of the person in each camera interval is calculated, so as to realize the recognition of the camera distribution, and obtain the position distribution relationship between the various cameras. Therefore, according to the mapping relationship between the network topology and the camera position, the preliminary mapping of the camera network can be realized. Figure 1 is a schematic diagram of pedestrians passing through the camera area.
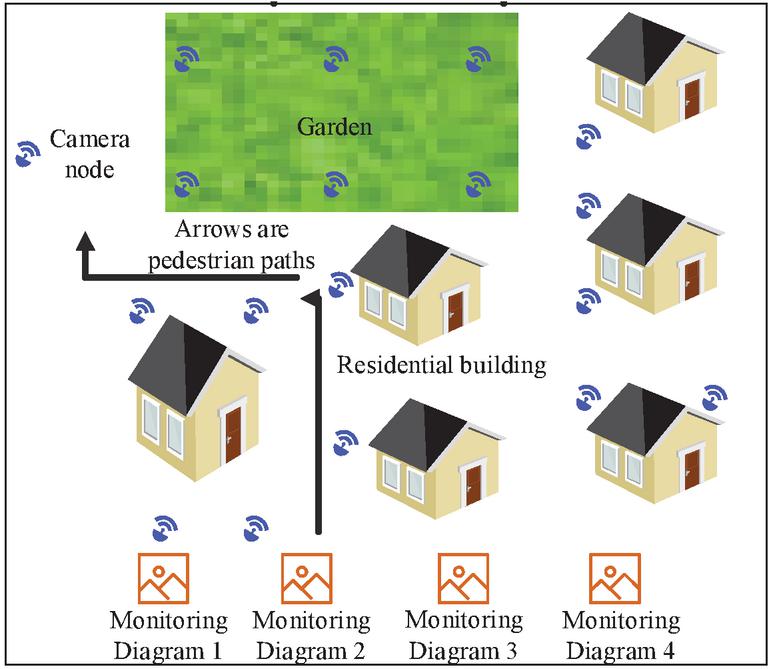
Figure 1 Schematic diagram of camera recognition.
The path information passed by passers-by can identify the location information of the camera in the physical space. However, the path information of people passing through the camera at the same path location may not be the same. When the distance in the space is long, the time consumption increases, the number of path cameras rises, and the error will elevate, too [14]. Therefore, all cameras in the target path cannot be used as position references, and judgments need to be made based on the effective range. In the camera network mapping, extracting the effective path information of passers-by is the key. Due to the particularity of the distribution of the physical space position of the camera, the pedestrian path recognition is complex and changeable. Therefore, in order to reduce the computational difficulty, only two events of pedestrian entering and leaving the range are recorded, but there are irrelevant data in the identification data, and the useless data are filtered by filtering rules and LBG (Linde, Buzo, Gray) methods [15]. Define two events as , where and represent the camera corresponding to the start and end, and the entry (IN) and exit (OUT) events obtained by the two cameras are represented as and , respectively, and the expression is as shown as Equation (1).
| (1) |
In the same target, the camera gets an event and prepares to receive subsequent events. Two events are a group, and some targets may have the possibility of multiple groups of events. The acquisition principle of different events of the camera is shown in Figure 2 [16].
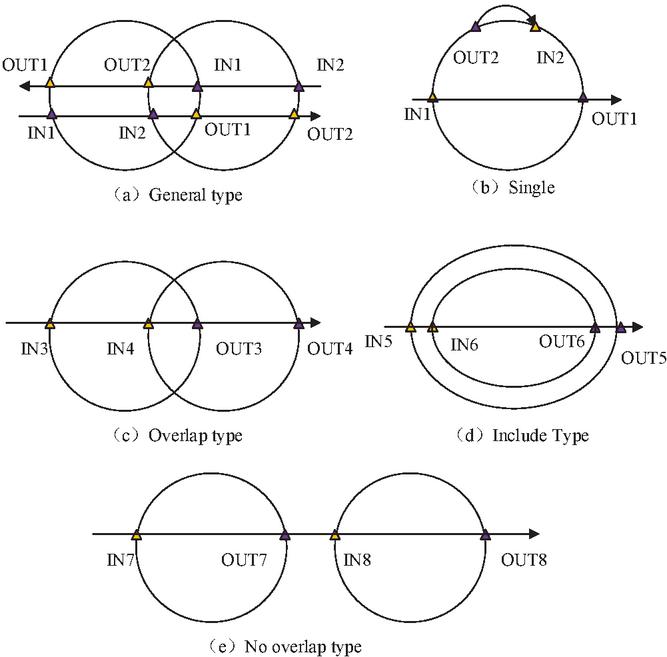
Figure 2 Schematic diagram of different event combinations.
Figure 2 shows the combination principle of various events, including five combination types, including one camera, two cameras overlapping, one camera containing another camera, and no overlapping. If the camera event cannot be classified into any of them, the event combination is invalid information and needs to be removed [17]. In the calculation of the physical space position of the camera, different spatial distributions correspond to different groups, and weights are assigned. Considering the complex relationship of the real scene, the LBG method and filtering strategy are used to filter the data, and the valuable combination data is retained. Therefore, the received data is mapped into five combinations, and the vector expression is as seen in Equation (2).
| (2) |
In formula (2), are the coordinate parameters of the target in the camera, and the table is the duration, indicating the camera coordinates. The five combined standard deviations and the norm are calculated, as visible in Equation (3).
| (3) |
In formula (3), is the standard deviation, is the mean, is a constant, and sets the acceptable range. By comparing the information, data that does not meet the requirements will be discarded. Next, the LBG algorithm is used to filter out valuable data, and the five combinations are used as a training set, and the training mean is shown in Equation (4).
| (4) |
In formula (4), is a combination type and is a combination vector, and the initial distortion degree is expressed as shown in formula (5).
| (5) |
Then search for the nearest code vector as shown in Equation (6).
| (6) |
In formula (6), represents the mapping combination vector and is code loss. Using the minimum value of the record index, the corresponding code loss is close to the data, and the total distortion degree at this stage is shown in Equation (7).
| (7) |
In Equation (7), if is close to the data, then the selection is realized by threshold setting, as seen in Equation (8).
| (8) |
denotes the threshold. If the actual threshold is less than the threshold set, you can continue to the next step. If it is greater than the set threshold, you need to return to find the closest code error. The research in this work is mainly based on the calculation of the physical distribution of the camera space to map it to the network topology. According to this idea, based on the sub-network division inference method, the camera space relationship is abstracted into a network space connected subgraph, and made into an independent subnet, so as to realize the camera preliminary mapping of the network. The schematic diagram of the preliminary surveying and mapping of the camera is shown in Figure 3.
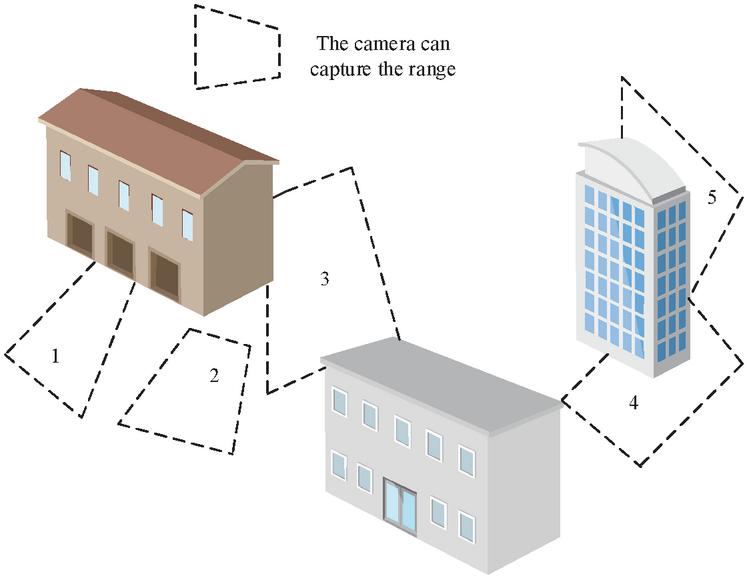
Figure 3 Network topology preliminary mapping scene diagram.
In Figure 3, five cameras are selected as an example, to collect information within a certain period of time, the pedestrian transition matrix probability is as shown in Equation (9).
| (9) |
It is calculated by the camera correlation degree, and the correlation degree expression is as shown in Equation (10).
| (10) |
In formula (10), the combination weight can reflect the relationship between the camera and different combinations through calculation. Set and both to 1, to 1.5, and to 0.5. Then, the degree of correlation between cameras can be calculated, and if the degree of correlation is low, it is removed. According to the relationship between the topological network and the physical distribution, the topological graph of the five cameras can be deduced, and the connected graph with many nodes is reserved, as shown in Figure 4.
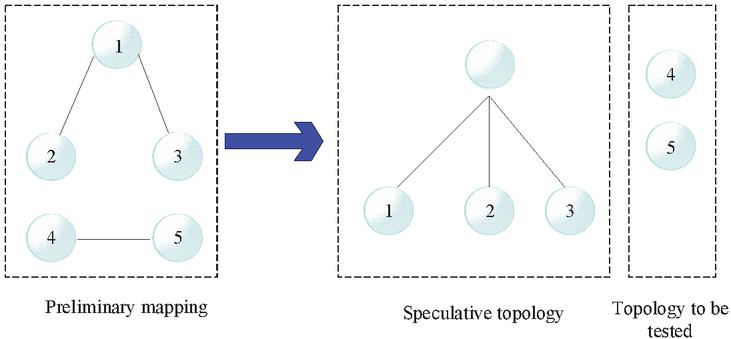
Figure 4 Preliminary topology mapping results of the camera.
Multi-node paths are reserved, as shown in Figure 4, Nodes 1, 2, and 3 constitute a connection diagram, which is divided into the same intranet as a clear subnet. The remaining nodes 4 and 5 are used as nodes to be measured, and the preliminary topology mapping is finally completed through the calculation of network attribution.
3.2 Construction Based on Network Information Topology Model
The preliminary mapping of the camera network is achieved through physical space, but the topology results of this method are not perfect, and there are still many camera node subnets that cannot be clearly assigned. Therefore, on the basis of physical space mapping, a topology mapping scheme based on network information is given to improve the shortcomings of the physical space solution. The principle of this method is to supplement the topology mapping by integrating parameters such as the number of network hops and delay on the basis of combining video resources and use the Bayesian inference method to judge the remaining node attribution [18]. The final test result is corrected by the Jaccard coefficient and Bloom filter to achieve the purpose of topological mapping of the camera’s intranet. The first is based on the network information positioning technology, using network parameters to identify the position of the camera, and mark the device reference mark. In identifying the sub-network attribution, the reference sign selected for judging the pending node is defined as the core, and can reflect the node information parameters. Therefore, it is only necessary to calculate the centroid and analyze the difference of the centroid. This can reduce the error and the amount of computation. The calculation of the centroid is illustrated in Figure 5.

Figure 5 Schematic diagram of the calculation of the centroid.
The calculation of the centroid needs only to solve the data of the corresponding group, but the network fluctuation makes the data quite different, and the value in the abnormal state cannot effectively reflect the centroid value. Therefore, the kernel density method is used to estimate the centroid network information, and the largest density is judged as the core [19]. Then the subnet device information data vector is defined as , the expression is as shown in Equation (11).
| (11) |
In formula (11), refers to various information data, such as hop count, time delay, etc. In the sub-network, the combination of single information is defined as , then its density function expression is as shown in Equation (12).
| (12) |
In formula (12), represents the kernel function and denotes the smoothing parameter, and is the number of data. To determine the ownership of the remaining nodes, it is necessary to establish the subnet locations of the remaining nodes. It can be seen from the single data vector analysis as Equation (13).
| (13) |
In Equation (13), is the remaining node, is the probability detection function, and Bayesian reasoning is used to transform Equation (13), as shown in Equation (14).
| (14) |
In Equation (14), is the probability that the node data is detected in the subnet, and the number of devices is obtained according to the initial solution, and the solution expression is as shown in Equation (15).
| (15) |
After determining the sub-network centroid data and node data, it is necessary to calculate the similarity between the data through Mahala Nobis distance, as shown in Equation (16).
| (16) |
In formula (16), is the distance and the higher the similarity, the smaller the distance. In the analysis of transforming from a single time series to a set of time series, the similarity calculation of the time series can effectively reverse the similarity between the sub-network and the node network, so as to better identify the ownership of the remaining cameras [20]. Therefore, the dynamic time rule is used to calculate the similarity, the node network time series is defined as , the sub-network centroid sequence is , then the remaining nodes belong to, as shown in Equation (17).
| (17) |
In formula (17), the denotes time series calculation function. According to the above calculation, the ownership of the remaining camera subnets can be determined, and the network mapping results can be improved. However, in order to ensure the accuracy of the results and avoid abnormal networks, the Jaccard similarity coefficient and Bloom filter are mostly used to calculate the difference of surveying and mapping [21]. The principle is shown in Figure 6.
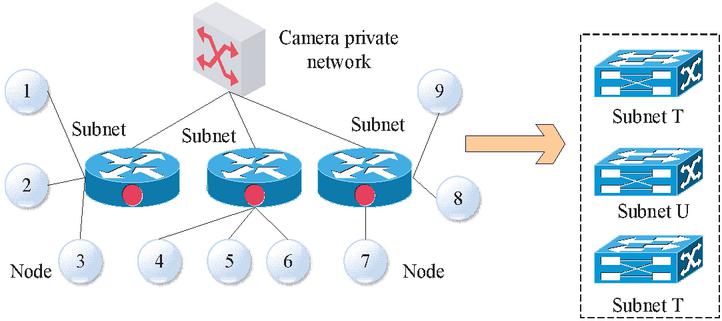
Figure 6 Schematic diagram of network topology collection.
The topology is abstracted into multiple sets, and the Bloom filter is used to judge whether the set contains another set. Figure 6 shows an abstract camera topology network with multiple subnets, which in turn contain multiple nodes. In surveying, the subnets are divided separately [22]. Because the identification cannot accurately determine the intranet subnet network number. Therefore, it is necessary to compare the degree of difference with other groups. The similarity between sets is calculated using the Jaccard coefficient, and the calculation expression is as shown in Equation (18).
| (18) |
In formula (18), and both represent the result of the difference degree of the two sets of sets, which are subsets, and are the Jaccard calculation function. In the end, the smaller the difference of the calculated structure, the higher the similarity, and it can be controlled within a certain interval after stabilization, and the difference of the subnets can be accurately compared. The final network topology mapping scheme is explained in Figure 7.
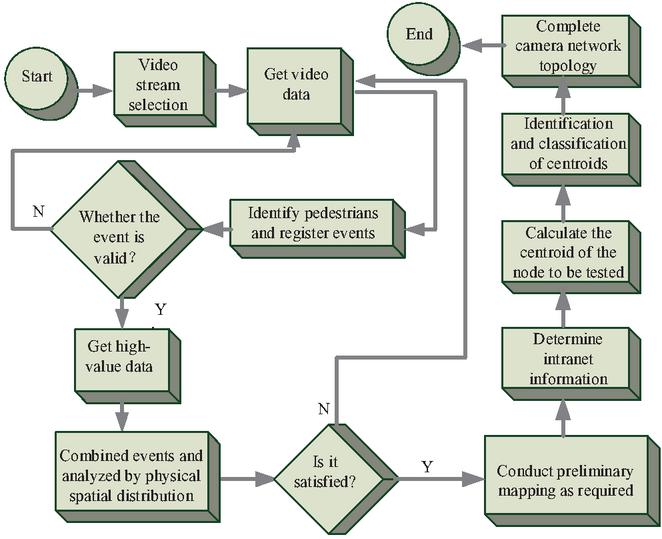
Figure 7 Schematic diagram of network topology mapping.
4 Network Topology Mapping Performance Analysis
A new camera distribution estimation method based on physical distribution and network technology was proposed in the study. In order to verify the performance of this method, corresponding experiments were conducted to verify the feasibility of the proposed method. The testing process uses the same network and equipment, while selecting the same flow time period for testing.
4.1 Performance Analysis of Physical Distribution Topology Model
In the performance test of the physical distribution scheme, the experiment will be performed under the intranet of three groups of cameras, and the number of cameras in the three networks is set to 5, 25, and 50. During the whole experiment, the physical location of the camera and the network location could not be obtained, only the video data was collected. Moreover, we compare our proposed solution with the schemes of Cho [14] and Lei [15]. At the same time, in the actual test, the effect of target recognition is not considered, and the pedestrian events in three network scenarios are counted. To ensure the fairness of the comparison, the test is performed during the same period of peak traffic. The event data in each time period is shown in Figure 8.
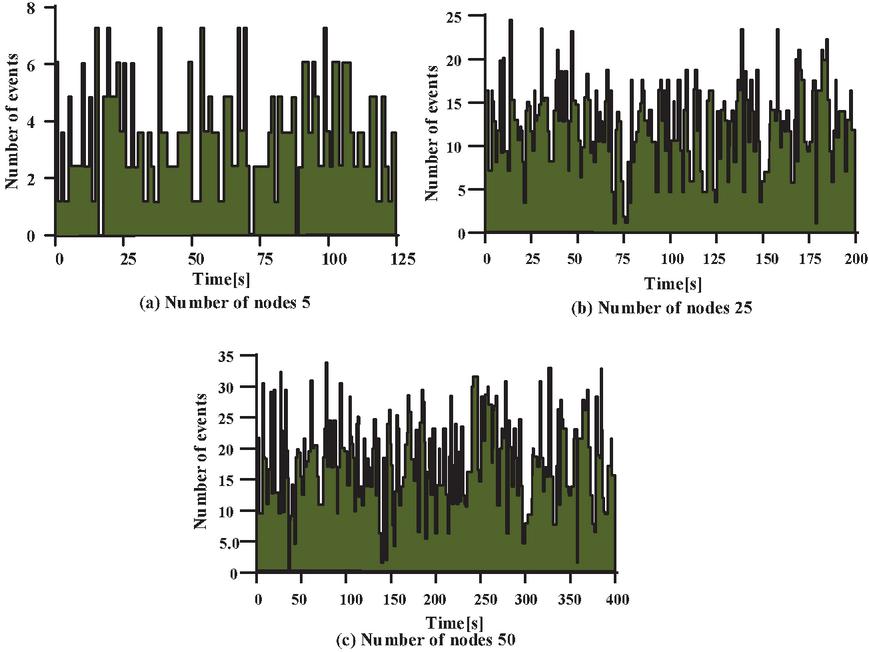
Figure 8 Event data at different times.
In Figure 8, the data information collection is divided into 5 nodes, 25 nodes and 50 nodes. From the number of events collected at different times, the more nodes there are, the more events are collected. Due to different scene locations, there are differences in the peak flow of people. The more nodes, the longer the peak period and the more time for event collection. Among them, the node 50 scene collection time is 400 s, the maximum number of nodes per second is 31, the number of single nodes is the largest, and the time is the longest. At the same time, the event prediction accuracy in the three scenarios is tested to reach an accuracy of 80%, as shown in Figure 9.
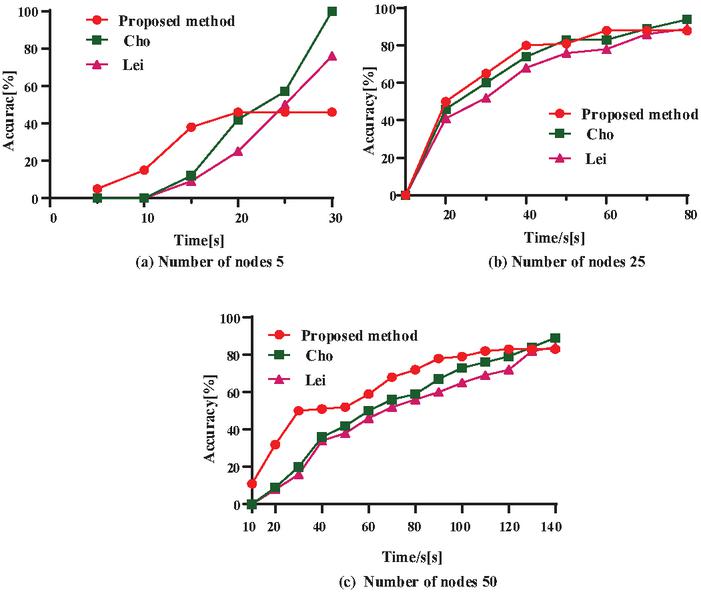
Figure 9 The relationship between accuracy and time.
Judging from the results presented in Figure 9, the proposed scheme performs better in event collection efficiency. For example, in the scene with 25 nodes, the accuracy rate reaches 80% in 40 s, and the Cho scheme and Lei J scheme reach 80% after 40 s. In the scenario with 50 nodes, the proposed scheme reaches 80% in 90 s, while the Cho and Lei schemes obtain this level after 90 s and 100 s, respectively. Since the proposed solution only records camera behavior events and discards low-cost events, the overall calculation is lower and the time consumption is shorter. However, the proposed scheme has lower recognition accuracy when there are fewer nodes. For example, when the number of nodes is 5, the proposed scheme reaches the highest point in 20 s, and the accuracy rate is 46%. When there are 25 and 50 nodes, with the increase of time, the overall accuracy advantage of the proposed scheme is not. Therefore, it is necessary to use network information later to improve the surveying and mapping effect and improve the accuracy of surveying and mapping.
4.2 Performance Analysis of Network Information Topology Model
During the network information topology mapping, the camera dedicated network in a certain cell is used as the test point, and there are about 120 cameras in this area. The first is to obtain the preliminary mapping results through physical distribution topology mapping, retain the largest three connected sub-graphs, and define the subnet division, which is represented by subnet T, subnet Y, and subnet Y, and the rest of the unmarked locations are considered to be measured. Nodes, the preliminary physical distribution mapping results are shown in Figure 10.
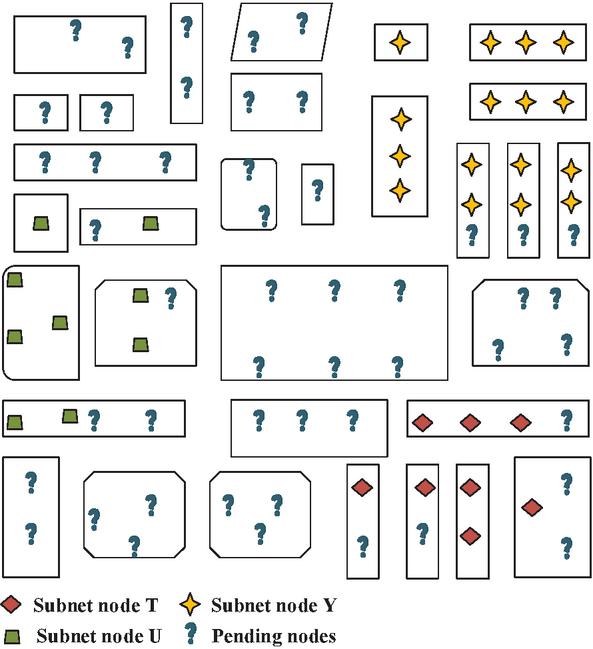
Figure 10 Preliminary physical distribution map.
For the three sub-networks that are clearly assigned, the core density method needs to be used to calculate the centroid of the network data, and a total of 10 judgments are made. The final results are shown in Table 1.
Table 1 The information data of the determined sub-network centroid
| The 8 Test Results | The 9 Test Results | The 10 Test Results | |||||||
| Number | Time | Number | Time | Number | Time | ||||
| Network | of | Delay/ | of | Delay/ | of | Delay/ | |||
| Classification | Nodes | Hops | ms | Nodes | Hops | ms | Nodes | Hops | ms |
| Subnet T | 20 | 4 | 4.35 | 20 | 4 | 4.45 | 21 | 4 | 4.31 |
| Subnet Y | 25 | 5 | 5.35 | 25 | 5 | 5.45 | 25 | 5 | 5.01 |
| Subnet U | 22 | 5 | 4.75 | 22 | 5 | 4.62 | twenty-three | 5 | 4.79 |
Table 1 partially determines the subnet information data, including subnet T, subnet Y, and subnet U. In the 8, 9, and 10 tests, the number of child nodes, the number of hops, and the delay are basically the same. After the data information of the subnet is clearly known, the subnet to which the remaining undetermined nodes belong can be judged. The total number of judgments is 10. The centroid information and judgment results of some nodes to be tested are shown in Table 2.
Table 2 Node information and attribution to be tested
| The 8 Test Results | The 9 Test Results | The 10 Test Results | |||||||
| Time | Time | Time | |||||||
| Network | Delay/ | Delay/ | Delay/ | ||||||
| Classification | Hops | ms | Subnet | Hops | ms | Subnet | Hops | ms | Subnet |
| Camera coding 5 | 4 | 4.35 | Subnet T | 4 | 4.45 | Subnet T | 4 | 4.31 | Subnet T |
| Camera coding 7 | 4 | 4.24 | Subnet T | 4 | 4.35 | Subnet T | 4 | 4.23 | Subnet T |
| Camera coding 10 | 4 | 4.26 | Subnet T | 4 | 4.42 | Subnet T | 4 | 4.32 | Subnet T |
| Camera coding 13 | 4 | 4.35 | Subnet T | 4 | 4.36 | Subnet T | 4 | 4.46 | Subnet T |
| Camera coding 16 | 4 | 4.45 | Subnet T | 4 | 4.38 | Subnet T | 4 | 4.54 | Subnet T |
| Camera coding 15 | 5 | 5.12 | Subnet Y | 5 | 5.23 | Subnet Y | 5 | 5.35 | Subnet Y |
| Camera coding 21 | 5 | 5.15 | Subnet Y | 5 | 5.42 | Subnet Y | 5 | 5.43 | Subnet Y |
| Camera coding 24 | 5 | 5.25 | Subnet Y | 5 | 5.34 | Subnet Y | 5 | 5.42 | Subnet Y |
| Camera coding 32 | 5 | 5.18 | Subnet Y | 5 | 5.35 | Subnet Y | 5 | 5.56 | Subnet Y |
| Camera coding 34 | 5 | 4.75 | Subnet U | 5 | 4.56 | Subnet U | 5 | 4.58 | Subnet U |
| Camera coding 38 | 5 | 4.65 | Subnet U | 5 | 4.79 | Subnet U | 5 | 4.45 | Subnet U |
| Camera coding 46 | 5 | 4.36 | Subnet U | 5 | 4.65 | Subnet U | 5 | 4.58 | Subnet U |
| Camera coding 47 | 5 | 4.56 | Subnet U | 5 | 4.47 | Subnet U | 5 | 4.59 | Subnet U |
| Camera coding 50 | 5 | 4.65 | Subnet U | 5 | 4.61 | Subnet U | 5 | 4.56 | Subnet U |
According to the results presented in Table 2, a camera number represents a node to be tested, and the network information of the remaining nodes is obtained by identifying and judging the node information 10 times. For example, the camera number 4 is the node to be tested. According to the centroid calculation, the number of hops and the delay of the node number 5 in the 8th test are 4 and 4.35 ms, respectively, 4 and 4.45 in the 9th test, and 4 and 4.45 in the 10th test. The subnet information data parameters have been determined according to Table 1. By comparison, it can be seen that the information data of the node to be tested number 4 is basically consistent with the information data of the subnet T, so it can be determined that the node to be tested number 4 belongs to the subnet T. By analogy, the remaining nodes to be tested can determine the final subnet ownership. When the final selected nodes are 40 and 60, the final comparison effect between the proposed scheme and Cho and Lei ones is shown in Figure 11.
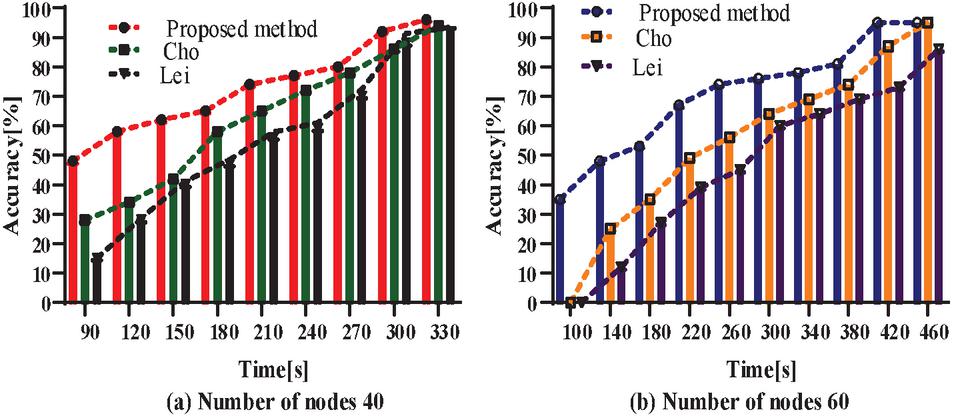
Figure 11 Performance test results of multiple schemes.
In the surveying and mapping performance comparison of the three schemes, the advantages of the proposed solution are more obvious in the comprehensive comparison. As shown in Figure 11(a), in the test environment with 40 nodes, after topological mapping of network information, combined with the data information accumulated by physical distribution mapping, the proposed scheme has advantages in recognition accuracy and time-consuming of mapping. The accuracy of the introduced method has reached 80% at 270 ms. At the same time, through network information surveying and mapping, the problem of inaccurate physical distribution surveying has been compensated. As time increases, the accuracy is up to 96%, while the accuracy of Cho and Lei schemes is up to 94% and 90%, respectively. In Figure 11(b) for an environment with 60 nodes, the proposed scheme reaches 80% in 365 ms, while the Lei and Cho solutions reach 80% in 398 ms and 450 ms, respectively. At the same time, the final accuracy of the proposed scheme, Cho and Lei methods are 95%, 95% and 86%, respectively. The overall network surveying and mapping effect of the proposed scheme is better, the surveying and mapping accuracy meets the corresponding requirements, and the surveying and mapping time is shorter.
5 Conclusion
In the network security environment, the security of camera network data has attracted much attention. Using a dedicated intranet is an effective strategy to ensure information security, but camera network mapping under the intranet is a difficult task. In order to solve the problem of intranet surveying and mapping, the relationship between intranet topology and camera physical distribution is studied, and a physical distribution camera network surveying and mapping scheme is proposed. Taking into account the problem of surveying and mapping coverage and the accuracy of surveying and mapping, in the preliminary surveying and mapping, the network hop count and delay are analyzed. Bayesian reasoning is used to realize the identification of the node to be measured. Finally, the judgment results are revised and evaluated. After the specific test of the experiment, in the test of the physical distribution mapping scheme, the Lei and Cho schemes are selected to compare with the proposed solution. In the performance test of preliminary surveying and mapping, when the number of nodes is 25, the proposed method reaches 80% accuracy in the 40 s while Cho and Lei schemes both reach 80% after 40 s. The proposed solution has obvious advantages from the time-consuming perspective, but the mapping accuracy is insufficient as the time increases. Therefore, the network information mapping is carried out on the basis of this physical topology, and the final performance test shows that the proposed method is superior to the existing techniques in terms of time-consuming and accuracy. This research solves the problem of camera surveying and mapping under the private network. The innovative combination of the two schemes has advantages in efficiency and accuracy.
In the study, the problem of difficult mapping of internal network camera network topology was solved by analyzing video streams. However, in the method design process, the focus was on network mapping without considering the accuracy of target recognition in the video, and there were also certain requirements for the performance of the camera itself. The development of hardware technology in the future will solve this problem, while network topology discovery is only a part of network security situational awareness. To achieve true camera security situational awareness, there is still a lot of work that needs to increase research data to improve the final surveying effect.
References
[1] A. R. Tajary, H. Morshedlou, “A Simulated Annealing-based Throughput-aware Task Mapping Algorithm for Manycore Processors”. Journal of AI and Data Mining, 2022, 10(3): 311–320.
[2] T. D. Potter, E. L. Barrett, M. A. Miller, “Automated Coarse-Grained Mapping Algorithm for the Martini Force Field and Benchmarks for Membrane–Water Partitioning”. Journal of Chemical Theory and Computation, 2021, 17(9): 5777–5791.
[3] O. Poliarus, Y. Poliakov, A. “Lebedynskyi Detection of landmarks by autonomous mobile robots using camera-based sensors in outdoor environments”. IEEE Sensors Journal, 2020, 21(10): 11443–11450.
[4] V. Srisamosorn, N. Kuwahara, A. “Yamashita. Human position and head direction tracking in fisheye camera using randomized ferns and fisheye histograms of oriented gradients”. The Visual Computer, 2020, 36(7): 1443–1456.
[5] C. Bernhard, H. Hecht. The ups and downs of camera-monitor systems: The effect of camera position on rearward distance perception. Human Factors, 2021, 63(3): 415–432.
[6] K. Yun, Y. Kwon, S. Oh. “Vision-based garbage dumping action detection for real-world surveillance platform”, ETRI Journal, 2019, 41(4): 494–505.
[7] T. Fukuhara, Y. Sakamoto, T. Kuwahara, et al. “Commercial Uncooled Microbolometer Camera Applied to 50-kg Class Satellite.” IEEE Geoscience and Remote Sensing Letters, 2019, 17(2): 332–336.
[8] K. Broadley, A. C. Burton, T. Avgar, et al. “Density-dependent space use affects interpretation of camera trap detection rates.” Ecology and evolution, 2019, 9(24): 14031–14041.
[9] B. Xu, X. Wang, A. A. Razzaqi, et al. “Topology optimisation method for MACL formation based on acoustic measurement network.” IET Radar, Sonar & Navigation, 2019, 13(6): 927–936.
[10] X. Jiang, B. Zheng, W. P. Zhu, et al. “Topological Interference Management with Inaccurate Topology of Network.” IEEE Communications Letters, 2021, 25(11): 3724–3728.
[11] T. Hou, T. Wang, Z. Lu, et al. “Combating adversarial network topology inference by proactive topology obfuscation.” IEEE/ACM Transactions on Networking, 2021, 29(6): 2779–2792.
[12] Zheng X., Tian J., Xiao X., et al. A heuristic survivable virtual network mapping algorithm. Soft Computing, 2019, 23(5): 1453–1463.
[13] X. Liu, X. Zhang, L. Chen, et al. “Data-driven transient stability assessment model considering network topology changes via mahalanobis kernel regression and ensemble learning”. Journal of Modern Power Systems and Clean Energy, 2020, 8(6): 1080–1091.
[14] Y. J. Cho, K. J. Yoon, “Distance-based camera network topology inference for person re-identification”. Pattern Recognition Letters, 2019, 125: 220–227.
[15] J. Lei, L. Niu, H. Fu, et al. “Person re-identification by semantic region representation and topology constraint”. IEEE Transactions on Circuits and Systems for Video Technology, 2018, 29(8): 2453–2466.
[16] C. Huo, L. Liu, H. Bai, “Physical impairments awareness based virtual network mapping strategy of elastic optical networks”. Optoelectronics Letters, 2021, 17(1): 36–39.
[17] R. Nugmanov, N. Dyubankova, A. Gedich, et al. “Bidirectional Graphormer for Reactivity Understanding: neural network trained to reaction atom-to-atom mapping task. Journal of Chemical Information and Modeling, 2022, 62(14): 3307–3315.
[18] X. Wang, Y. Sun, H. Gu, “BMM: A binary metaheuristic mapping algorithm for mesh-based network-on-chip”. IEICE TRANSACTIONS on Information and Systems, 2019, 102(3): 628–631.
[19] A. R. Tajary, H. Morshedlou, “A Simulated Annealing-based Throughput-aware Task Mapping Algorithm for Manycore Processors”. Journal of AI and Data Mining, 2022, 10(3): 311–320.
[20] T. D. Potter, E. L. Barrett, M. A. Miller, “Automated Coarse-Grained Mapping Algorithm for the Martini Force Field and Benchmarks for Membrane–Water Partitioning”. Journal of Chemical Theory and Computation, 2021, 17(9): 5777–5791.
[21] M. McMillan, E. Haber, B. Peters, et al. “Mineral prospectivity mapping using a VNet convolutional neural network”. The Leading Edge, 2021, 40(2): 99–105.
[22] R. P. Astuti, E. Rachmawati, E. Edwar, et al. “Vegetation classification algorithm using convolutional neural network ResNet50 for vegetation mapping in Bandung district area”. Journal In fotel, 2022, 14(2): 146–153.
Biography

Min Chen graduated from Xidian University in China, majoring in Electrical Engineering and Automation. He serves at China Communication Service Co., Ltd., a subsidiary of China Telecom, with the title of Senior Engineer, and has been appointed as an expert in the company. He has also been recognized as a Class E high-level talent in Hangzhou, China. He holds a First-Class Constructor qualification certificate issued by the Ministry of Housing and Urban-Rural Development of the People’s Republic of China and is recognized as a project bid evaluation expert for communication engineering construction projects by the Ministry of Industry and Information Technology of the People’s Republic of China. He has published research papers in several core journals in China. His research areas include electronic information, communication engineering, network information security, and project management. Currently, he is pursuing a Master’s degree in Business Administration at the Newhuadu Business School of Minjiang University in China.
Journal of Cyber Security and Mobility, Vol. 12_5, 733–756.
doi: 10.13052/jcsm2245-1439.1256
© 2023 River Publishers