An Evaluation Model for Network Security Based on an Optimized Circular Algorithm
Xingfeng Li
Department of Commerce and Logistics, Linyi Vocational College, Linyi, 276000, China
E-mail: Xingfeng_Li2023@outlook.com
Received 06 May 2023; Accepted 29 May 2023; Publication 12 August 2023
Abstract
With more and more control systems accessing computer networks, the increase in their associated vulnerabilities has led to a decreasing security evaluation of the networks. It is essential to secure computer networks from attacks. To this end, the study constructs a network of computer network security evaluation model based on an optimized circular algorithm. To avoid detecting the model’s parameters falling into the local optimum, the model is first optimized based on the Corsi grey wolf optimization (CGWO) algorithm for the hyperparameters of the Gaussian process (GP). To solve the problem of unbalanced data and the GP not having memory capability, the study proposes an optimized Gaussian Mixture Model-Recurrent neural networks (GMM-RNN) algorithm. Experimental results of attack type recognition accuracy showed that the research CGWO-GP algorithm can jump out of the local optimum, and its average value of accuracy reached 98.99%. The average value of the leakage rate was 0.42%, and the average value of the false alarm rate was 0.11%. The average detection accuracy of the GMM-RNN model for eight attack types was 95.899%. The optimal detection accuracy of this model performance was 96.3948%. The training time of the GMM-RNN model was 67.96 s, and the detection time of the test set was 6.45 s, which greatly optimized the real-time performance. The GMM-RNN model was more effective in predicting the security posture of computer networks, and the prediction value can reach 97.65%. The research model was significantly better than other algorithmic models in the performance and evaluation of computer network security and had certain research values.
Keywords: Recurrent neural networks, computer network security assessment, gaussian processes, intrusion detection, grey wolf optimization.
1 Introduction
In recent years, the problem of security attacks on computer network control systems has become increasingly severe. Offenders often take advantage of vulnerabilities in computer networks to steal confidential information using viruses or intrusions, which is indeed a massive challenge for computer technology [1, 2]. There are many computer network security assessment systems in China, but only a few of them are being utilized. Their main task is to detect vulnerabilities in network security. Still, they do not involve simple analysis of network security risk assessment and do not involve computer network security posture assessment [3]. As this network safety assessment system fails to integrate assessment and detection techniques, it lacks a framework and a strong support platform to serve as a comprehensive system for network information security testing and assessment. Consequently, it cannot act as an effective guide for network security risk assessment and detection in diverse industries. It is, therefore, essential to establish a computer network security assessment system that includes multiple testing methods and security assessment tools. GP (Gaussian Process) has flexible non-parametric properties and computational simplicity. It can provide effective estimates of uncertainty for prediction and general model selection processes as non-linear optimization problems [4]. RNN has the advantage of memory and can detect intrusions in a timely and accurate manner due to its memory properties, especially for temporally continuous datasets [5]. Considering above the main novel contributions of this work are:
• The Gaussian process model does not need to specify the size of the input data set and the number of parameters, so it has good adaptability to the input data set. It can predict the model with an infinite number of parameters (weights) in a limited computation time. One of the important influencing factors in the Gaussian process is the selection of hyperparameters. Currently, the implementation of the meta-heuristic optimization algorithm is simple and the search speed is fast. Therefore, aiming at the problem of high false alarm rate and false alarm rate of computer network intrusion detection, this paper improves the Gaussian process model based on the characteristics of the data set and puts forward the Gaussian process optimization algorithm based on gray Wolf.
• Under the condition that the attack situation is constantly changing and developing, the characteristics selected for one type of attack may be ineffective for other types of attack, which cannot significantly improve the prediction ability of the model. The Gaussian mixture model can handle high dimensional data, but increasing the dimension of data or adding more features to the data set will reduce the accuracy of the model by introducing noise. RNNS can handle structurally rich data. Therefore, a Gaussian Mixture Model (GMM) is proposed to preprocess the unbalanced data. The processed data is then classified as input to the RNN.
The rest of this paper is structured as follows. Section 2 describes the most relevant related works. The research mainly includes five parts. Firstly, the introduction mainly introduces the background and significance of computer network security detection and puts forward the corresponding research methods. The second part mainly introduces the relevant theory and technology research and elaborates the extensive application of machine learning in network intrusion detection system. This paper summarizes the shortcomings of previous studies and leads to this research method. The third part of the paper focuses on the detailed elaboration of the method, which is divided into two sections. In the first section, a method of computer network data processing based on Gaussian model is presented. In the second section, the method proposed in the first section is improved and a computer network security detection model based on Gaussian mixture model and RNN is constructed. The fourth part of this paper is to study the effectiveness of the constructed model. Based on the attack description and the data set of the computer control system, the detection accuracy of the computer network security evaluation model based on the improved loop algorithm is tested. The last part summarizes the research results, analyzes the shortcomings, and looks forward to the future research direction.
2 Related Works
Once the security of a computer network is breached, it may cause many threats, such as leakage of confidential data from the state or individuals, suspension of infrastructure, or even destruction of equipment to make it unusable. Therefore, how to optimize the safety of computer network control systems and quickly and efficiently defend against network intrusions has become a current research hotspot.
Wen et al. [6] studied network security assessment using hierarchical analysis and conducted an example analysis using a campus network to experimentally prove the reliability of the method.
Ij et al. [7] experimentally analyzed the impact of the convolutional neural network (CNN) technique to detect network attacks. The experiments showed that appropriate adjustment of hyperparameters and data input preprocessing significantly impacted the attack detection rate.
Yang et al. [8] constructed a novel layered distributed network risk evaluation model with a shared hyperparameter mechanism to optimize learning efficiency and established a network risk assessment hierarchical framework. Experiments showed that the model had the characteristics of fast processing speed and high accuracy.
Experts such as Tang [9] constructed a safety monitoring model of the system and analyzed the computational scale selection strategy. And prefix span algorithm was used to optimize their algorithm, and the relationship between intrusions was analyzed based on data mining of prefixes. The study showed that the algorithm had good adaptability and a better auxiliary effect on system security practical training.
Wang et al. [10] used neural networks to analyze computer network security and constructed a corresponding index system. The study results showed that the security management policy had the maximal threat to system network safety.
Aldwairi et al. [11] trained their models on the high dimensions of network traffic data to distinguish network behavior. They proposed a method to differentiate between abnormal and normal network traffic using Restricted Boltzmann Machine (RBM). Results showed that RBM can be reliably trained to identify secure network traffic.
To improve the detection rate of network attacks, Hl et al. [12] have proposed an RNN-based payload classification method. Experiments showed that methods had high detection precision, comparable to or even better than the most advanced methods.
Rehman et al. [13] used a Gated Recurrent Unit (GRU) and an RNN to defend against new Distributed denial of service attack (DDoS) attacks in the real world. Results showed that this method had a high detection precision for DDoS classification in the case of reflection attacks.
Shen et al. [14] established a machine learning-based ReliefF-P-Naive Bayes and SoftMax regression (RP-NBSR) network attack detection model to optimize the false drop probability and value of unknown network intrusions. Experimental results on the UNSW-NB15 dataset showed that the RP-NBSR-based attack detection model had a lower false detection rate and higher values.
Zhang et al. [15] mainly studied noise removal methods to provide security for computer networks and propose a noise removal method with GMM as a priori. Experiments showed that this method had a better noise reduction effect than the traditional method.
In summary, the safety of computer network control systems affects the economy and people’s livelihoods. Early and more mature safety technologies focus mostly on network information security, but the relevant technologies still need to be optimized. And to completely prevent intrusions, the current technology is not yet achievable. Therefore, designing a computer network security evaluation system with better real-time performance is of great research value. To this end, the study proposes a computer network safety assessment model based on an optimized circular algorithm.
3 Construction of Computer Network Security Evaluation Model Based on Improved Loop Algorithm
At present, the problem of computer network control system security attack events is increasingly serious. The increase in related vulnerabilities leads to the decline of network security evaluation. Therefore, it is very important to ensure the security of the computer network and avoid being attacked. The false alarm rate and false alarm rate are high in intrusion detection of industrial computers and the real-time detection system is poor. This paper presents a computer network security detection model based on the Gaussian mixture model and improved loop algorithm and verifies its validity.
3.1 Network Data Processing Method Based on Gaussian Process
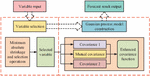
GP is a natural generalization of multivariate Gaussian random variables to an infinite index set with flexible non-parametric properties and computational simplicity. GP not only makes predictions about the mean but also measures uncertainty based on the standard deviation of the test sample to show its generalization ability, with a significant standard deviation indicating the absence of any training data in the vicinity of the test sample [16]. A specific GP is shown in Figure 1.
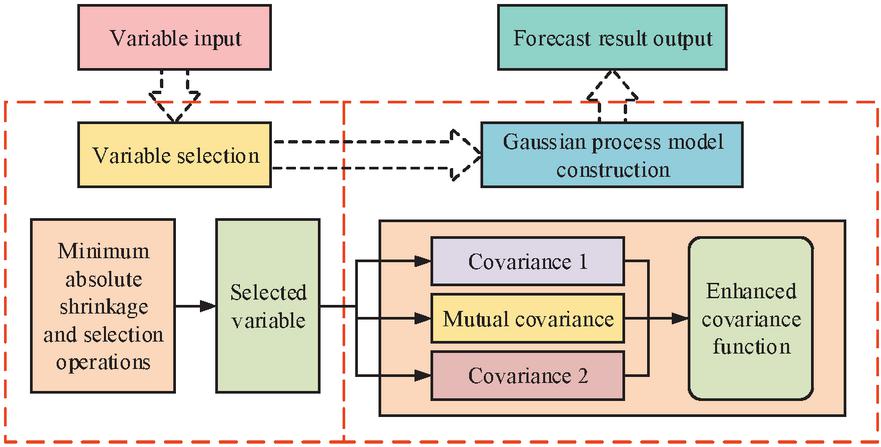
Figure 1 Gaussian process.
As shown in Figure 1, the construction of the Gaussian process model requires all kinds of raw data input into the system, that is, the variable selection module. The variable selection algorithm is used to select the most significant factor. Then, the selected variables are input into the improved Gaussian process model. The covariance function of the Gaussian model is composed of three parts: covariance 1, covariance 2, and mutual covariance. The original input data is used to train the Gaussian model to get the relevant parameters. Finally, the prediction results are output in the output module. is the input variable to the training data; is the output variable to the training data, and follows a Gaussian distribution. The Gaussian distribution does not require parameterization of the target variable (output) or parameterization of the input.
The unknown parameters defining the distribution perform a prioritization of the distribution, instead, the prior conditions preceding the underlying function are defined directly [17]. Therefore, to facilitate the calculation, the data is usually pre-processed to marginalize all unwanted values to a mean of 0. The output observations of the Gaussian prior distribution are given in Equation (1).
| (1) |
In Equation (1), represents the observed value after noise contamination and the noise . represents a covariance matrix of order satisfying the symmetric positive definite requirement, and is the unit matrix. The covariance function is responsible for modelling the behaviour of the objective function. GP applying squared covariance functions support any continuous function of arbitrarily small width range and can be a good representation of the observed high correlation of the output concerning the tight input. Its computational expression is given in Equation (3.1).
In Equation (3.1), represents the variance scale and is the signal variance. The characteristic scale of the function, the signal variance, and the noise variance constitute the hyperparameters to be optimized , . The hyperparameter optimization is then automatically achieved by the GP and the fitness of the model to the training set can be evaluated using a marginal likelihood conditional on the hyperparameter . The likelihood function is given in Equation (3).
| (3) |
For a given data set, the hyperparameters of the GP determine the properties of the model, maximizing the marginal likelihood of obtaining an optimized . The attributes of the model can be obtained through a maximum likelihood estimation method based on a priori data, with a negative log-likelihood function of the form in Equation (3.1).
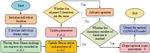
In Equation (3.1), represents the data fit term; represents the loss in model complexity and represents the normalization constant. The Gray Wolf Optimization (GWO) algorithm [18] is proposed to address global optimization and mechanical design. The algorithm draws on the predation mechanism and hierarchy of the grey wolf population to model the stratification mechanism and predation behavior of the grey wolf pack, a large-scale search algorithm centered on the three best grey wolves. The structure of the wolf pack is illustrated in Figure 2.

Figure 2 Gray wolf hierarchy.
In Figure 2, the first level of the pyramid is the head wolf, known as , which has leadership and decision-making power. The second layer, called , is the best successor to the head wolf. The third layer is called and is responsible for tasks such as reconnaissance. The final layer, , is responsible for the balance within the population. The study used the fitness function as the criterion for the hierarchy, as shown in Equation (5).
| (5) |
In Equation (5), denotes the fitness value of the grey wolf; is the classification accuracy; is the characteristic number, and stands for weight, which is usually taken as 0.01. Although the grey wolf optimization algorithm outperforms other algorithms, the problem of the small range of the GWO algorithm for finding the best is also found in the research. Recent research has shown the performance of this whale optimization algorithm and the fruit fly algorithm, which are optimized using the Corsi operator, is significantly better. Therefore, the study also adopts the Corsi variational operator for optimization to increase the range of optimization.
The Cauchy distribution is smaller in the vertical direction than the normal distribution but larger in the horizontal direction [19]. Therefore, the Cauchy distribution is used as the variational operator. The algorithm can find the optimum over a larger range and easily discard the local optimum. Its calculation is shown in Equation (6).
| (6) |
The corresponding distribution function is shown in Equation (7).
| (7) |
From Equation (7), the variation of the Cauchy distribution is infinite. It is a function of inertia weights, not only optimizes the convergence of the algorithm but also avoids falling into a local optimum. Its update is shown in Equation (8).
| (8) |
In Equation (8), represents the position after the update has been performed and is a constant used to control the mutation step. In an optimization search, this will allow a global search to be performed with greater efficiency and better results can be obtained. Therefore, to solve problems of long search times and low efficiency in hyperparameter search, the study designed a grey wolf optimization algorithm incorporating the Corsi variance to optimize the hyperparameters in the GP, as shown in Figure 3.
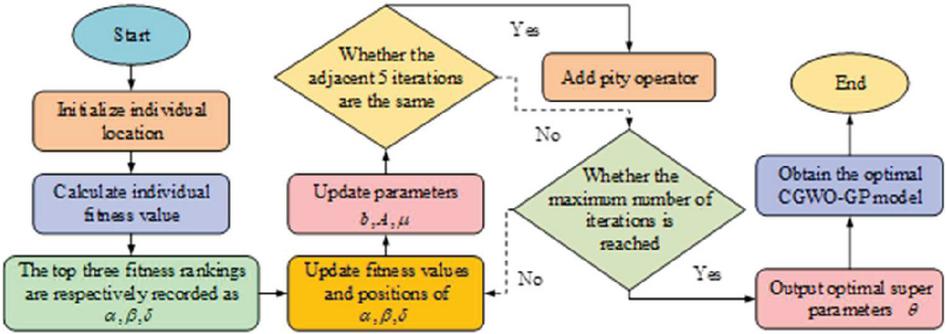
Figure 3 Algorithm flow of GP fusion cauchy mutation GWO.
In Figure 3, the predicted mean and variance of the GP model describe the Gaussian distribution that the predicted output is likely to follow. Think of the prediction variance as an assessment of the uncertainty in the prediction means, and its magnitude reflects the model accuracy of the GP at this point in time; the smaller the variance, the higher the model accuracy. The problem of sparse data samples and difficulty in calculating distances can occur in the case of high-dimensional data. Therefore, dimensionality reduction is required. Laplacian Eigenmaps (LE) is a non-linear dimensionality reduction method, which is useful for unevenness.
The homogeneous data can also find out the flow structure among them in low dimensions with good robustness [20]. The study uses the nearest neighbor method to construct the undirected graph, such that denotes the set of nearest neighbors of the sample , as shown in Equation (9).
| (9) |
In Equation (9), represents the th distance from . The next step is to determine the weights of the edges . The study selects the 0–1 weight method as in Equation (10).
| (10) |
Finally, the low-dimensional embedding of the high-dimensional data is mapped to , and the objective of LE is to minimise the loss function during construction, as in Equation (11).
| (11) |
If the high-dimensional data set is reduced to the dimensional space, the low-dimensional coordinates corresponding to any sample can be represented as .
3.2 Modeling of Network Security Evaluation Based on GMM and RNN
The accuracy of GP depends on whether the historical data can reflect the dynamic characteristics of the actual application and the predictive capability of the model. But for computer network control with different operational phases, a single Gaussian engineering model may not be able to describe its operating conditions, while global modelling is susceptible to the influence of different distribution values. Currently, the problem of data imbalance is mainly addressed through four types of methods: data-level, algorithm-level, cost-sensitive, and integrated. Therefore, the study proposes the use of GMM with RNN for the prediction and evaluation of computer network security at the data-level.
GMM is commonly used for clustering or modelling multi-modal data, but its iterative speed is slow and needs to be accelerated using optimization algorithms. The study begins with a functional probability regression model using local model indicator variables. In this model, the algorithm is trained using a dataset derived from a single-peaked multivariate Gaussian distribution of size . Assuming that the density in the th cluster is , the GMM distribution function is as in Equation (12).
| (12) |
In Equation (12), represents the weight of each component in the dataset . , are distributed as the mean and the covariance matrix of each component . The Expectation Maximization (EM) algorithm is usually used to evaluate the parameters of the GMM , and the EM algorithm includes (E-step) and (M-step). Difficult or complex likelihood problems are solved by iterating through two more straightforward steps to obtain the maximum likelihood estimate [21]. The first iteration of the E-step defines the conditional expectation of for a given data set as Equation (3.2).
In Equation (3.2), represents the likelihood estimate of and is its log likelihood. denotes the posterior probability of assigning the th instance to the th component. denotes the probability weight in the first iteration using the GP. The mean vector and covariance are updated in the M steps. And the iteration is terminated when the parameters converge or the maximum step size is reached to achieve the iteration, obtaining the mean vector and covariance of this GMM. The optimal values can be obtained by means of Equation (14).
| (14) |
To increase the speed of convergence and optimize the performance of the EM algorithm, a weighted least squares-based EM search algorithm, WLS-EM, is proposed. The algorithm is based on the exact calculation of the step required to jump to the final solution for a given search direction, and the exact step can be easily calculated by simply rooting the second-order polynomial calculated from the initial log-likelihood maximization problem [22]. Since the optimization requires a gradient calculation of the logarithmic likelihood function of observed data, it is necessary to give the observed values of the model parameters. Assuming that the state is an unknown constant value in the dimension, the best observation for the th observation is shown in Equation (15).
| (15) |
In this case, the WLS method of calculating the minimum value performance index is shown in Equation (16).
| (16) |
The EM algorithm is then executed and causes all the data to converge to the vicinity of the straight line. This distance from each point to each straight line is calculated, and the nearest distance straight line is selected for matching. The error value for each point’s distance from the straight line is calculated as shown in Equation (17).
| (17) |
From Equation (14), the error values can be derived to calculate the weight values as shown in Equation (18).
| (18) |
In Equation (18), is 1, taking the less robust and the extinction factor . The weights are calculated according to the Tukey weighting function, as shown in Equation (19).
| (19) |
In Equation (19), when , the weights are between 0 and 1. When , the weight is 0. The points in step E are divided into groups of and the slope and intercept of each group of lines are calculated for the fit. The matrix formula for the calculation of its WLS is shown in Equation (20).
| (20) |
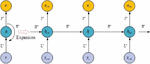
RNN has the property of recursive connectivity. Unlike feed-forward networks, RNNs are widely used because they accept only input vectors of fixed length and give fixed-length output vectors, so they cannot handle structure-rich data, especially sequences.
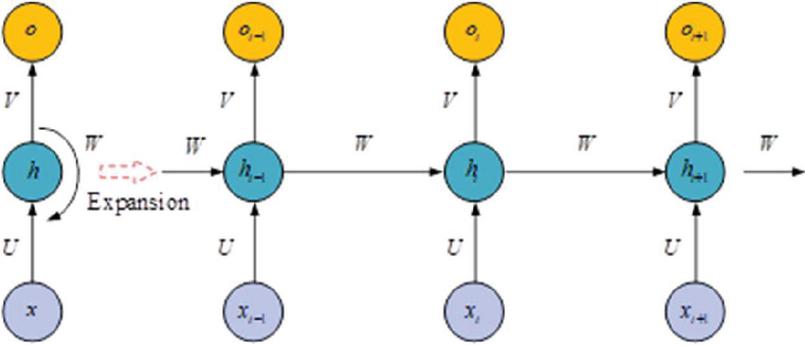
Figure 4 RNN network deployment structure.
From Figure 4, the output of the previous time step constitutes this input of it, allowing not only the sequence of input vectors to be manipulated but also the sequence of output vectors to be generated, storing the time information in memory form and capturing the long-term dependencies between the input signals. The specific activation function is shown in Equation (21).
| (21) |
In Equation (21), represents the input at the time of ; is the memory unit of the network, which represents this state of the hidden layer at the time of and contains the sequence information of this layer and the previous layer. are the activation function and represents the output at . The study uses GMM to process the data at the data level, and then the processed data set is passed through the RNN network for risk prediction and security evaluation, thus building an optimized GMM-RNN computer network safety assessment and intrusion detection model.
4 Computer Network Security Evaluation Model and Application Effect Analysis
The definition of intrusion is a security event or a combination of multiple security events, which constitutes a security event, where an intruder gains or attempts to gain access to a system or system resources without authorization. Intrusion detection systems that apply intrusion detection techniques are used to monitor malicious traffic in the network acting as a second line of defense to protect the security of computer networks and detect both internal and external attacks. This research is based on the idea of intrusion detection and its application to computer network safety assessment methods. Public UNSW-NB15 data sets were selected to verify the proposed method. The research used 90% training data set and 10% test data set in the experiment, as shown in Table 1 for detailed data set samples.
Table 1 Number of samples of different attack types in the UNSW-NB15 dataset
| Type of Attack | Attack Description | Total Sample Size | Training Set | Test Set |
| Normal | Natural transaction data | 2218761 | 1996885 | 221876 |
| Generic | A small piece of code used as a payload when exploiting a software vulnerability | 1511 | 1360 | 151 |
| Exploits | Contains strikes for all attacks that can simulate gathering information | 13987 | 12588 | 1399 |
| Fuzzers | Attempts to pause a program or network by entering randomly generated data into it | 24246 | 21821 | 2425 |
| DoS | A technique that works on all block ciphers regardless of the structure of the block ciphers | 215481 | 193933 | 21548 |
| Reconnaissance | It contains different attacks for port scanning, spam and html file infiltration | 2677 | 2409 | 268 |
| Analysis | A malicious attempt to make it impossible for a user to use server or network resources | 16353 | 14718 | 1635 |
| Backdoors | Attackers exploit vulnerabilities to attack software or systems. | 44525 | 40073 | 4452 |
| Shellcode | A technique for surreptitiously circumventing system security mechanisms to access a computer or its data | 2329 | 2096 | 233 |
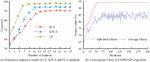
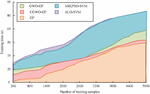
To avoid uneven data distribution, 5000 data samples were evenly selected as the training set, and five sets of tests were conducted to evaluate the training model according to different types of attacks in this test set. Each record of this computer network dataset contained 25 traffic features, and the experiments were carried out to reduce the dimensionality of the data, and Test Set was selected as the test case. In this study, a grey wolf optimization algorithm incorporating Corsi variation was designed to optimize the hyperparameters of the GP. The experiments were set to a grey wolf population size of 30, and a maximum number of iterations of 200, variation of fitness values with the number of iterations is shown in Figure 5.
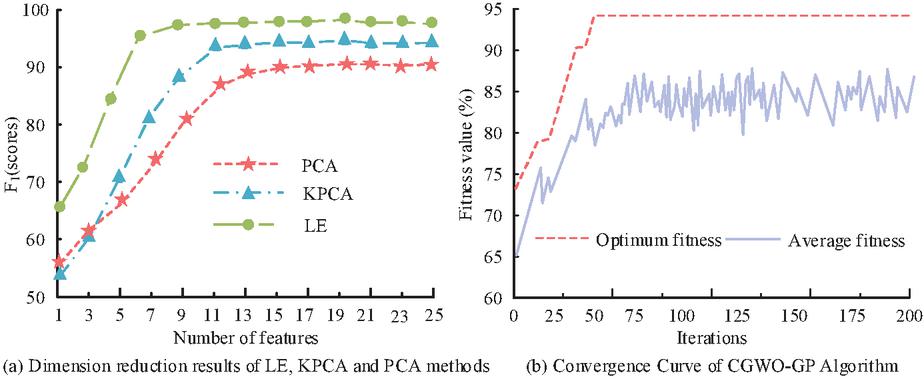
Figure 5 Dimension reduction results of the three methods and convergence curve of GGWO-GP algorithm.
From Figure 5(a), the value of using LE’s dimensionality reduction method increased as the dimensionality of the features increased and reached its maximum at the number of 6 features, with a value of 97.36% for , and the minimum number of features required was 9. Therefore, the study used LE’s dimensionality reduction method for computer network control data with the best results. From Figure 5(b), the overall trend of fitness value increased as the number of iterations increased. The best fitness was reached at 48 iterations, with a value of 96.8%, and the best fitness value increased in the 17th and 35th generations. Results showed that the CGWO-GP algorithm had the ability to jump out of the local optimum and maximize the optimization of the hyperparameters.
To verify the advantages of the proposed CGWO-GP algorithm in running time, it was compared with the unoptimized GP algorithm and the newly proposed method. The comparison of the training time of the five algorithms is shown in Figure 6.
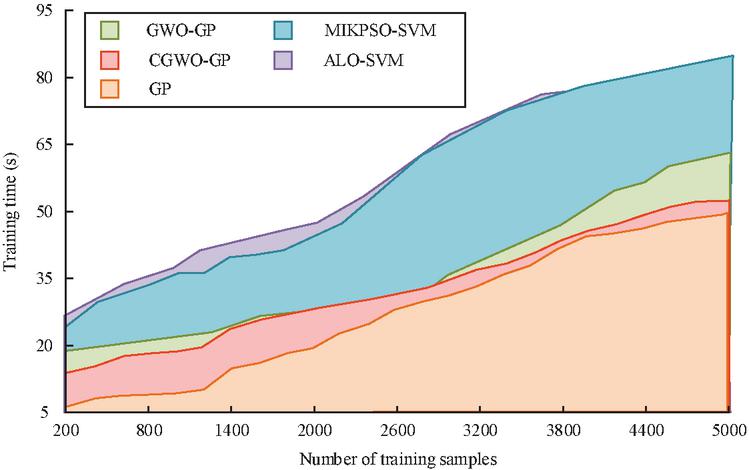
Figure 6 Comparison of training time.
From Figure 6, the training set started with 200 data volumes. When the training set reached 5000, the running time of the GWGO-GP algorithm was 55.29 s, which was close to the GP algorithm and obviously better than the MIKPSO-SVM algorithm and ALO-SVM algorithm.
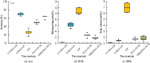
Experiments were conducted using five test sets to visually compare the detection capability of the proposed CGWO-GP algorithm with other detection algorithms. The boxes indicate Inter Quartile Range (IQR), and the bars in the boxes indicate. The median accuracy, miss, and false alarm rates, with circles indicating outliers in the data, are shown in Figure 7.
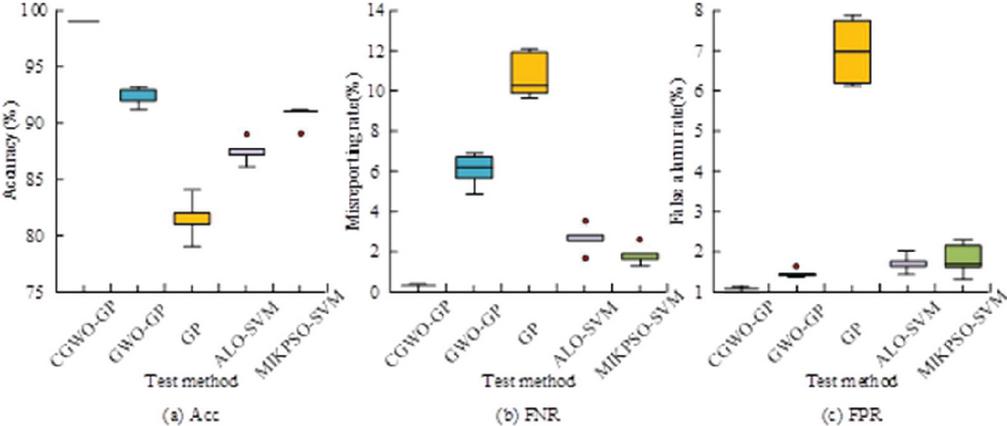
Figure 7 Detection performance of five detection methods.
From Figure 7, the precision of the studied CGWO-GP algorithm was significantly higher than the other detection algorithms, with a mean accuracy of 98.99%. Moreover, both of leakage rate and the false alarm rate of this studied algorithm were lower than the other algorithms, with the average value of the leakage rate being 0.42% and the average value of the false alarm rate being 0.11%.
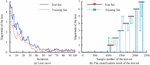
After several optimization experiments, two hidden layers were selected. The number of nodes of each hidden layer was set to 20, and after several experiments, the learning rate of the algorithm was set to 0.01. The ratio of the test set to the training set was 2:8. The studied GMM-RNN model’s performance was thoroughly evaluated through binary and multi-classification experiments. The experiments used the Sigmoid function as the activation function and the logarithmic loss function as the loss function. Figure 8 is the change in the logarithmic loss value of the proposed algorithm with the number of iterations and the classification result of the test set.

Figure 8 Logarithmic loss value of the algorithm changes with the number of iterations and classification results of the test set.
From Figure 8(a), the logarithmic loss values of the studied algorithm fluctuated downwards as the number of iterations increased. After the 53rd iteration, the trend of the loss values in this training set and the test set smoothed out, and the loss values in the training set converged steadily within the region of 0.19. The similarity between loss values in the test and training sets indicated that the training was effective and that the test and predicted values can be fitted well. From Figure 8(b), the accuracy of the comparison between the real attack category and the predicted category of the test set data reached 98.75%. According to the analysis, due to the large similarity of the same type of attack data, category errors occurred more frequently between attacks of the same type.
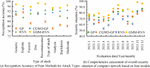
For the processing of the unbalanced attack dataset, the experiment first calculated the mean value of the eight attack types M. For the attack types with a number above the mean, the experiment used the GMM algorithm to aggregate the number of attacks into eight small piles. From each small heap, M/8 data were randomly selected and regrouped into M attacks. The experimental results of dichotomous classification were used 53 times as the number of iterations for model training, as shown in Figure 9(a), for the recognition accuracy of the four algorithmic models for the nine attack types in the dataset. Results of the comprehensive assessment of this overall security posture of computer networks for the four models in 2021 are illustrated in Figure 9(a).
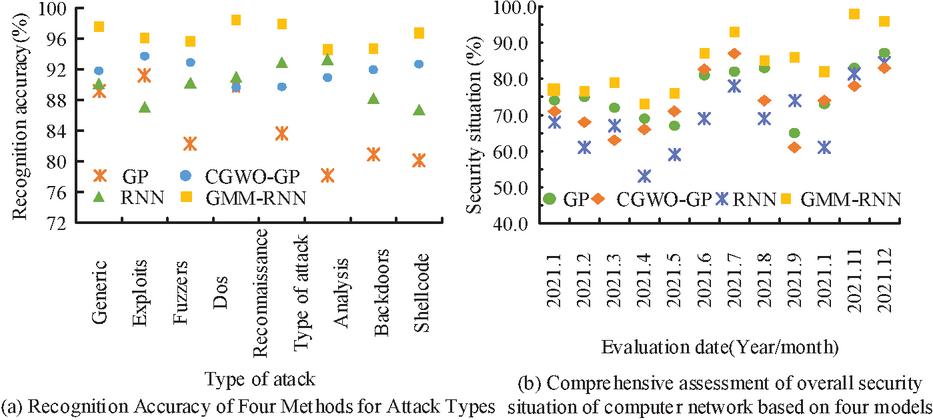
Figure 9 Accuracy of four kinds of attack identification methods and comprehensive evaluation of overall security situation of computer network.
From Figure 9(a), the detection precision of the studied GMM-RNN model for all nine attack types was higher than that of the other algorithmic models, with the mean value of its detection accuracy at 95.899%. Its detection accuracy for DoS attacks was the highest at 98.45%. As shown in Table 2, the performance of the four algorithms was demonstrated in several aspects, and the results were calculated by averaging the results obtained in 10 experiments. From Figure 9(b), The GMM-RNN network security evaluation model had the advantage of being more comprehensive and a better prediction of the security posture of computer networks, with a prediction value of 97.65%, significantly better than other algorithmic models.
Table 2 Comparison of performance results of four methods
| Method | Training Time (s) | Test Time (s) | ||
| CGWO-GP | 91.65 | 93. 36 | 82.36 | 14.39 |
| GP | 81. 94 | 83.11 | 91.33 | 21.28 |
| RNN | 88.04 | 87.20 | 90.33 | 29.28 |
| GMM-RNN | 96.39 | 98.03 | 67.96 | 6.45 |
From Table 2, this GMM-RNN model proposed in the study performed with an optimal detection accuracy of 96.39% and a value of 98.03%. In time performance, the GMM-RNN model was very effective for large data sets due to its use of WLS-EM to accelerate the iterations for data region partitioning. The training time was effectively optimized to 67.96 s, and the detection time for the test set was 6.45 seconds.
5 Conclusion
With the increasing number of vulnerabilities associated with computer networks, it is crucial to safeguard their security against attacks. To this end, this research provides an in-depth analysis of intrusion detection and security evaluation of computer networks. It constructs a computer network security assessment model based on an optimized circular algorithm. This model is first based on the CGWO algorithm to optimize the hyperparameters of the GP. And to solve the problem of unbalanced data and the GP not having memory capability, an optimized GMM-RNN algorithm is proposed. Experiments showed that the research CGWO-GP algorithm reached the best fitness when the number of iterations reached 48, with a value of 96.8%. And the best fitness value was optimized in the 17th and 35th generations. It showed that the CGWO-GP algorithm can jump out of the local optimum. Meanwhile, it achieved an average precision rate of 98.99%. The mean precision of the GMM-RNN model was 95.899% for this detection of nine types of attacks. The highest detection accuracy for DoS attacks was 98.45%. The GMM-RNN model performed with an optimal detection accuracy of 96.3948% and a value of 98.0295% for . In time performance, the training time of the model was effectively optimized to 67.9551 s, and the detection time of the test set was 6.4525 seconds, which greatly optimized the real-time performance. The GMM-RNN model was more effective for computer network security posture prediction, and the security posture prediction value could reach 97.65%, which was significantly better than other algorithm models. Although the research model has achieved better performance results, there is still room for optimization in real-time intrusion detection in computer networks, which will be explored in more depth in future research.
References
[1] D. Jafarigiv, K. Sheshyekani, M. Kassouf, “Countering FDI Attacks on DERs Coordinated Control System Using FMI-Compatible Cosimulation.” IEEE Transactions on Smart Grid, 2020, 12(2):1640–1650.
[2] V. Balatska, M. Shabatura. “Exploration of computer network by vulnerability scanner nessus.” Bulletin of Lviv State University of Life Safety, 2020, 20:6–11.
[3] H. Wang, D. Zhao, X. Li. Research on Network Security Situation Assessment and Forecasting Technology. Journal of web engineering, 2020, 19:1239–1265.
[4] L. Mao, S. Sun. “Multiview Variational Sparse Gaussian Processes.” IEEE Transactions on Neural Networks and Learning Systems, 2020, 99:3–11.
[5] N. Rajkumar, A. D’Souza, S. Alex, and G. J. W. “Kathrine Long Short-Term Memory-Based Recurrent Neural Network Approach for Intrusion Detection”. 2019, 30:837–846.
[6] L. Wen. “Security Evaluation of Computer Network Based on Hierarchy”. International Journal of Network Security, 2019, 21(5):735–740.
[7] A. Ij, B. Mah, B. Oc, and B. Am, “Performance evaluation of Convolutional Neural Network for web security”. Computer Communications, 2021, 175(1):58–67.
[8] J. Yang, T. Li, G. Liang, W. He, and Y. Zhao. “A Hierarchy Distributed-Agents Model for Network Risk Evaluation Based on Deep Learning”. Computer Modeling in Engineering & Sciences, 2019, 120(1):3–23.
[9] Y. Tang, M. Elhoseny. “Computer network security evaluation simulation model based on neural network”. Journal of Intelligent and Fuzzy Systems, 2019, 37(78):4–8.
[10] L. Wang, J. Yu, B. Qiao, S. Lima, and Á Rocha. “Intelligent evaluation of computer network security based on neural network.” Journal of Intelligent and Fuzzy Systems, 2018, 35(3):2–5.
[11] T. Aldwairi, D. Perera, A. M. Novotny, “An Evaluation of the Performance of Restricted Boltzmann Machines as a Model for Anomaly Network Intrusion Detection”. Computer Networks, 2018, 144(24):111–119.
[12] A. Hl, L. A. Bo, L. A. Ming, and B. Hy, “CNN and RNN based payload classification methods for attack detection”. Knowledge-Based Systems, 2019, 163:332–341.
[13] S. U. Rehman, M. Khaliq, S. I. Imtiaz, A. Rasool, and A. K. Bashir, “DIDDOS: An approach for detection and identification of Distributed Denial of Service (DDoS) cyberattacks using Gated Recurrent Units (GRU)”. Future Generation Computer Systems, 2021, 118(2):453–466.
[14] Z. Shen, H. Wang, K. Liu, P. Liu, M. Ba, and M. Y. Zhao, “RP-NBSR: A Novel Network Attack Detection Model Based on Machine Learning”. International Journal of Computer Systems Science & Engineering, 2021, 37(1):121–133.
[15] J. Zhang, Z. Qin, S. Wang, “New Adaptive Regularization Parameter Selection Based on Expected Patch Log Likelihood.” Network Security Magazine (English), 2020, 2(1):25–36.
[16] D. Debangan, D. Abhirup, B. Sudipto, “Graphical Gaussian process models for highly multivariate spatial data.” Biometrika, 2021, 4:993–1014.
[17] Y. Fang, D. Karlis, S. Subedi, and D. Steinley, “Infinite Mixtures of Multivariate Normal-Inverse Gaussian Distributions for Clustering of Skewed Data”. Journal of Classification, 2022, 39:510–552.
[18] S. Tripathi, A. Shrivastava, K. C. Jana, “Self-Tuning fuzzy controller for sun-tracker system using Gray Wolf Optimization (GWO) technique”. ISA Transactions, 2020, 101:50–59.
[19] S. Shah, P. J. Hazarika, S. Chakraborty, “The Balakrishnan Alpha Skew Truncated Cauchy Distribution with Applications in Modelling Currency Exchange Rate.” Research Policy: A Journal Devoted to Research Policy, Research Management and Planning, 2020, 49(10):2565–2571.
[20] M. Ma, T. Deng, N. Wang, and Chen Y. “Semi-supervised rough fuzzy Laplacian Eigenmaps for dimensionality reduction”. International journal of machine learning and cybernetics, 2019, 10(2):397–411.
[21] H. Jia, Z. Zhang, H. Liu. “An approach based on expectation-maximization algorithm for parameter estimation of Lamb wave signals.” Mechanical systems and signal processing, 2019, 120(1): 341–355.
[22] R. L. Dou, B. Hu, W. J. Shi. “Incremental Multi-Hop Localization Algorithm Based on Regularized Weighted Least Squares”. International Journal of Pattern Recognition & Artificial Intelligence, 2019, 33(9):1549–1560.
Biography

Xingfeng Li received his Master’s degree in Engineering from Shandong University of Science and Technology (2012). Currently, he is a lecturer at Linyi Vocational College. His main research fields are big data analysis and network technology. As the main lecturer of logistics Big Data analysis, logistics information system management, business data analysis and other courses, he has guided students to participate in Shandong Electronics and Information Technology Application Competition for many times and won the first prize. He presided over and participated in a number of provincial and municipal subject projects, and published 6 papers in national journals, including 2 in core journals.
Journal of Cyber Security and Mobility, Vol. 12_5, 711–732.
doi: 10.13052/jcsm2245-1439.1255
© 2023 River Publishers