A Priori Algorithm Based Network Security Situational Awareness Multi-Source Data Correlation Analysis Method
Wei Li, Jianjun Li, Chengting Zhang, Guang Yao* and Xue Xu
Information Center, China Tobacco Zhejiang Industrial Co., Ltd, Hangzhou, 310001, China
E-mail: guangyaogy@outlook.com
*Corresponding Author
Received 18 July 2023; Accepted 04 September 2023; Publication 17 November 2023
Abstract
In the context of the information age, the Internet has developed rapidly, but the accompanying network security threats have also become an issue that cannot be ignored. In order to effectively respond to these threats and improve the data processing capabilities of network security situational awareness, the study focuses on the challenges of multi-source data processing and proposes a multi-source data association analysis method based on the A priori algorithm. This method aims to deeply explore the implicit relationships between data and provide stronger support for network attack detection. In addition, the study also designed a multi-level evaluation method based on coefficient of variation indicators, aiming to provide a more objective and comprehensive evaluation of the detection results. After a series of experimental verification, the proposed correlation analysis method has achieved significant results in detecting phishing attacks and DOS attacks, with detection rates of 90.3% and 93.8%, respectively. At the same time, the multi-level evaluation method has also been experimentally proven to provide more reasonable and accurate results for data evaluation. The methods and technologies proposed in the study can not only improve the multi-source data processing ability of network security situational awareness, but also provide valuable references for future network security research and practice.
Keywords: A priori algorithm, coefficient of variation, NSSA, data fusion, multilevel evaluation.
1 Introduction
With the quick growth of the computer industry, the Internet’s reach has expanded, the variety of application scenarios has grown, and with it, the sophistication of network attack methods. A large number of unauthorized individuals are using network attacks to steal enterprise core data, user personal information, etc., and in serious cases, even state confidential information. They are using network attacks to violate the rights and interests of others. Early network security technology could not meet the basic requirements of protecting networking environments. The study of network security has gained popularity as a way to stop cyber criminals in their tracks, and in recent years, network security situation awareness (NSSA) has grown to be a significant topic of study [1]. The NSSA method for real-time sensing, tracking, and feedback of the process of network attack posture changes [2] can be utilized to make assessments of the behavior of attackers and raise the level of network security defence. However, the current data sources of network security posture are relatively single, and the collected data information cannot be correlated, and the ability to analyse the attacker’s intention is limited. Considering above, this study proposes the NSSA multi-source data correlation analysis method, Using this scheme, the real-time state of the network under attack is accurately displayed, so that staff can intuitively see the trend of network security changes. The method uses the A priori algorithm (A-A) to perform correlation analysis on multi-source data to uncover potential connections and find key indicators in the data.
Thus, the main novel contributions of this work are:By providing more comprehensive and relevant data sources, the overall network security situation has been improved. By utilizing multiple data sources, this method enhances the ability to analyze and evaluate the intentions of attackers, thereby improving the level of network security defense. It can accurately display the real-time status of the attacked network, allowing employees to easily visualize the trends of network security changes. By using the A prior algorithm (A-A) to perform correlation analysis on multi-source data, potential connections and key indicators in the data can be identified, enabling a deeper understanding of the attacker’s intentions.
The research will be developed in four parts. An overview of the present state of research on network security posture and A-A is provided in the Section 2. Then, in Section 3 an the analysis of network security posture based on A-A is introduced. Next, Section 4 presents an experimental validation of the proposed scheme, while Section 5 summarizes the research content and points out the shortcomings, and points out the shortcomings, and makes clear the future research direction.
2 Related Works
NSSA can help staff better maintain network security by identifying the attacker’s goal and next move. To help NSSA overcome the constraints to interaction between various network layers, Xl et al. [3] presented a cognitive awareness control paradigm. The model employs hierarchical quantification techniques to infer the links between play-over components, decision fusion techniques to enhance fusion accuracy, and cognitive conditioning techniques to accomplish automatic control. The findings demonstrate that the model is capable of sensing and controlling cyber security threats.
Next, Xiao-ling Tao et al. [4] proposed an auto-encoder and a parsimonious storage unit. The results showed that NSSA combined with auto-encoder and parsimonious storage unit had a significant improvement in accuracy and efficiency.
Then, Zhang et al. [5] proposed a convolutional neural network-based communication data stream mining method in order to detect the intrusion of industrial networks and extract network security situational awareness. The method devises a normalisation technique for the features of network data streams of different network types. The results show that the method has good transferability in feature analysis and network data.
Later, G Kou et al. [6] found that existing cybersecurity situational awareness methods are unable to accurately reflect attack behaviour in the face of large-scale coordinated cyber attacks. To solve this issue, a method for network security situational awareness based on attack intent identification is suggested by the author. This method can perform causal analysis of attack behaviours, make it easier to identify intrusion paths, synthesise attack behaviours, and predict the next stage of attacker behaviour. According to experimental findings, the technique increases the accuracy with which multi-stage, multi-batch, and large-scale network attacks are recognised.
To construct a model for predicting fertility behaviour from individual data, F Chen et al. [7] used the A-A combined with smoothed cut-point calculations to construct the model and trained the model using 2013–2015 mobile population data. The model is quantified the effect of individual characteristics on fertility behaviour.
Next, Aur et al. [8] used the A-A to provide a reference for defining visual perceptual parameters in order to identify a new, method that can correlate physical features of the landscape with perceptual parameters, mining the link between people’s consensus on the landscape and its various aesthetic parameters.
Then, l Zhu [9] designed a web log information mining system using an improved A-A with a confidence equation in order to solve the problem of frequent alarm delays due to the increased pressure on SMS gateways as a result of the increased number of alarm messages on the web. The results showed that the system effectively alleviated the delay problem of web alarms and improved the information processing speed.
To enhance the decision-making capability of sports training effect judgment, X Wang et al. [10] proposed the A-A and combined it with an improved association rule algorithm to create a new sports training decision support system. The results revealed that the decision support system has strong decision-making judgment capabilities for sports training decision support vector machines as well as good mining performance.
In conclusion, NSSA strengthens cyber security by figuring out how to mimic the behaviours of attackers, which allows it to anticipate their next step and plan for attacks beforehand. This study, however, employs the A-A algorithm to mine potential linkages in cyber attacks so that NSSA can respond to large-scale, multi-stage attacks because it is unable to link large-scale, multi-stage cyber attacks, and this technique is a frequently used data association rule mining algorithm.
3 Research on the Application of Data Mining Techniques in NSSA MSDA
This section, which is broken up into two main subsections, examines how data mining techniques are applied in NSSA multi-source data correlation analysis. The first subsection presents an overall summary of the A-A and discusses multi-source data association (MSDA) analysis based on the A-A. The evaluation method of network security posture and the construction of the evaluation index system are covered in the second subsection.
3.1 MSDA Analysis Based on A-A
Data mining is a technique for finding potential connections between data from large volumes of data. Data mining techniques generally consist of three stages: data preparation, pattern finding, and result interpretation and evaluation. These three stages can be divided into seven steps, as shown in Figure 1 [11–13].

Figure 1 Data mining process.
A priori algorithm is a classical correlation analysis method, in business, medical, Internet and other fields, healthcare and the Internet. Because of its simple structure, the algorithm has more room for improvement and is easy to combine with other methods. The process of the MSDA analysis method based on the A-A is simplified from the data mining process with only four steps, namely data preparation, data fusion, association analysis, and visualisation of results. In the data preparation phase, data selection is required. The data in NSSA is separated into four major groups. The running information collects hardware information, such as cpus, hard disks, memory, and network adapters, through a data collection agent. The data can reflect whether the system is attacked. Therefore, you need to set collection indicators and thresholds for the data. The collection indicators and thresholds set in this study are shown in Table 1.
Table 1 Thresholds indicators and collection
| Status | Abnormal | Collection | Normal | |
| Type | Meaning | Threshold | Indicators | Threshold |
| Memory | Total Memory | Change | f_total | Unchanged |
| Disk I/O | Current actual IOPS | 70% | f_iops_in_progress | 70% |
| Disk | Usage rate | 85% | f_used_percent | 85% |
| Disk | Inode Idle Count | 0 | f_inodes_free | 0 |
| Process | Number of zombie process | 0 or 0 | f_zombies | 0 |
| System | Average load near 15 minutes | 0.7 | f_load15 | 0.7 |
| SWAP | Usage rate | 0 or 0 | f_used_percent | 0 |
Asset information refers to IT assets. The information that can be captured in the system log includes time, log process and log level, etc. The log level can generally be divided into 7 levels, which are normal, normal, warning, error, validation serious, must be fixed immediately, and kernel crash. After completing the collection of the above four information categories, the data needs to be fused, and the data is classified as important according to the collected network traffic information. The top three of them can be classified as important, while the rest are classified as ordinary, after determining the information level. The danger level and operation information status of their system logs are queried and fused with them, and Figure 2 depicts the procedure [14, 15].
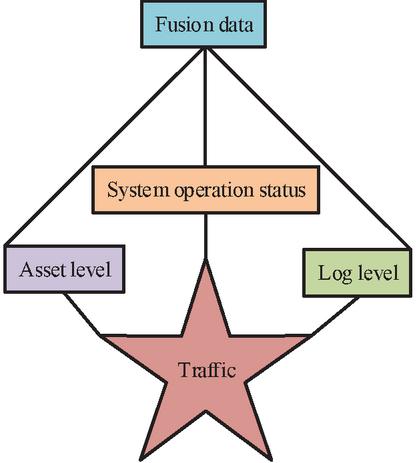
Figure 2 Data fusion process.
Once the data fusion is completed, the search for association rules can begin using the A-A. In order to address the issue of the A-A’s own inadequacies, the research suggests a distributed system. Figure 3 depicts the association analysis steps of the algorithm in the system. In this system, the algorithm will cut and pack the data before sending the packaged data to each node for processing at the same time. This is performed to increase the algorithm’s processing efficiency, decrease its workload, and increase its robustness.
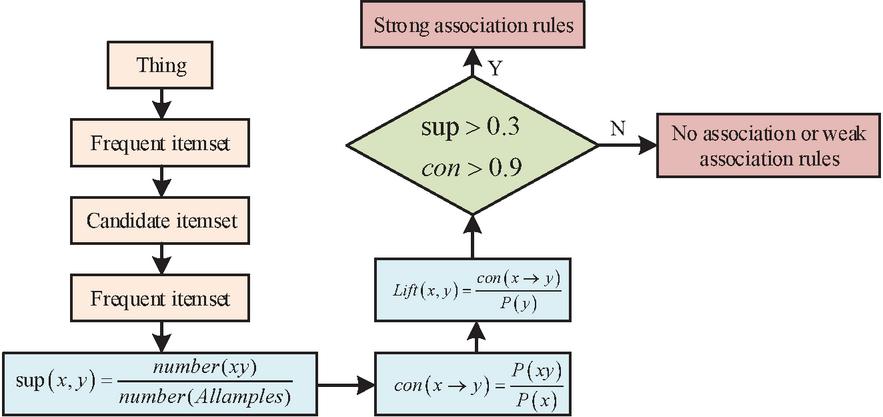
Figure 3 System algorithm operation process.
The system consolidates the fused information and then segments it, sending the segmented packets to individual nodes. The node algorithm treats data packets as a database of things and divides the database into candidate itemsets and frequent itemsets. The frequent itemset is filtered from the candidate itemset, and after the itemset is differentiated, the support of all transactions in the transaction base is calculated using Equation (1).
| (1) |
In Equation (1), represents the proportion of transactions containing in the transaction library, represents transactions containing , and represents the transaction library. After obtaining transaction support, it is also necessary to calculate the confidence level of the transaction, as shown in Equation (2).
| (2) |
In Equation (2), denotes the probability of launching when occurs, denotes , the probability of occurring simultaneously, and denotes the probability of CC occurring. In addition to support and confidence, the algorithm also needs to calculate the lift, which is revealed in Equation (3).
| (3) |
In Equation (3), describes the degree of lift of and , and denotes the probability of occurrence of . reflects the correlation between transactions, and the magnitude of the degree of lift depicts the strength of the positive correlation between quantitative transactions. If , then the higher the degree of elevation, the stronger the correlation. If , then the transaction is not correlated. The visualisation is an annotation of the information and knowledge in the association rules, usually using a grouping matrix visualisation. Generally, grouping matrix visualisation is a method for a small number of results, but it can be improved to handle a certain number of results. Improvements include clustering frequent item sets with K-means clustering, where clustering frequent item sets quantifies the differences between item sets using Jaccard distances. Assuming that and denote two item sets and denotes the similarity index, then the and similarity indices are calculated in Equation (4).
| (4) |
Once the similarity index is obtained, the Jaccard distance between and can be calculated using Equation (5).
| (5) |
in Equation (5) denotes the Jaccard distance. k-mean clustering is a common clustering method that speeds up the process of visualising results. Thirdly, graph-based visualisation, this method is generally only used to represent strong association rules.
3.2 A Multi-Level Approach to Assessing Cyber Security Posture
The assessment methodology is based on the construction of an indicator system. There are four steps that make up the construction of an indication system: discussion and collation, requirements analysis, analysis of key indicators, and evaluation of indicators. The study constructs the indicator evaluation system in terms of network traffic, vulnerability, quality of service, and risk. After going through the above four stages, the indicator system constructed by the study is illustrated in Figure 4.
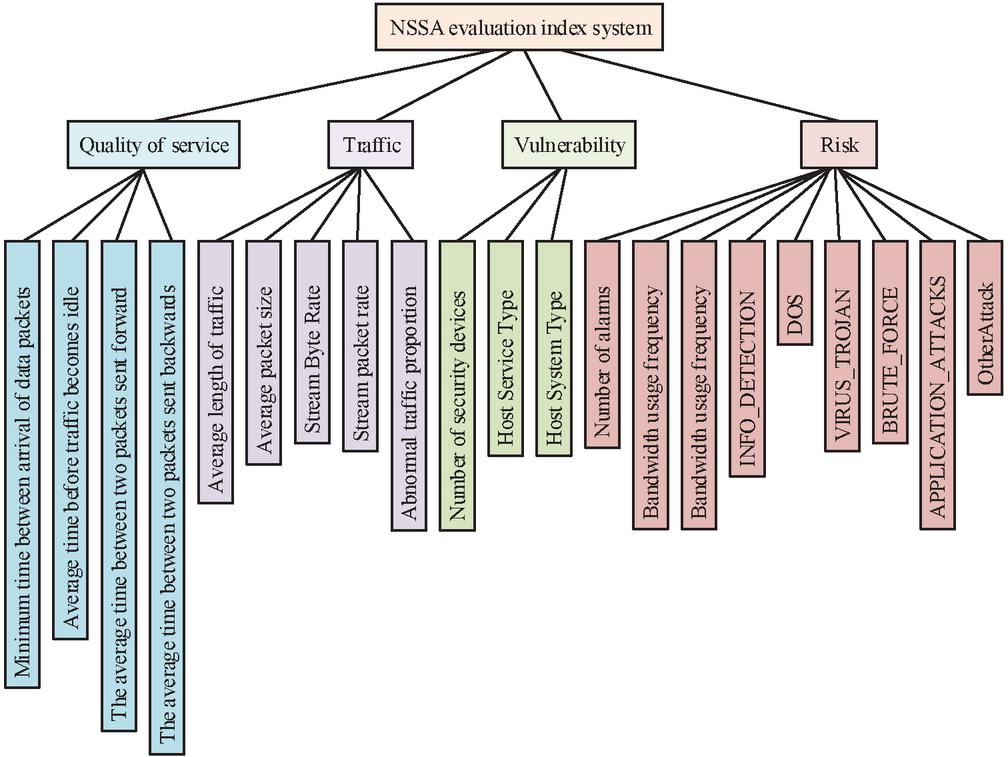
Figure 4 NSSA evaluation indicator system.
The evaluation indicator system is divided into four primary indicators, namely Quality of Service Indicator , Network Traffic Indicator , Vulnerability Indicator and Hazard Indicator . Four secondary indicators are included under the Service Indicator, namely the minimum arrival interval of packets , the average time before the traffic becomes idle , the average time between two packets sent forward . The average time between two packets sent backwards . These four secondary indicators are all extracted from network traffic data. The evaluation indicators under Quality of Service are negatively correlated with the rating, with the longer the time, the lower the indicator rating. There are five secondary indicators under network traffic, namely average traffic length , average packet size , stream byte rate , stream packet rate , and abnormal traffic percentage . Of these five metrics, two are rate-related, and three are load-related. These secondary metrics are derived from the same source as the QoS metrics, and are all extracted from network traffic data. The higher the rate, the higher the rating for the two rate-related metrics, and the higher the load, the lower the rating for the three load-related metrics. Three indicators are included under vulnerability, namely the number of security devices , host service type , and host system type . These three secondary indicators can determine the strength of vulnerability and identify the location of priority defense. Within the same system, the more types of systems, the more complex the host service type, the higher the security factor and the higher the vulnerability score. There are nine secondary indicators under the danger level, including three warning indicators and six indicators of attack types from to , respectively. Situation assessment methods are an important part of NSSA research, and the basic NSSA assessment method is shown in Figure 5.
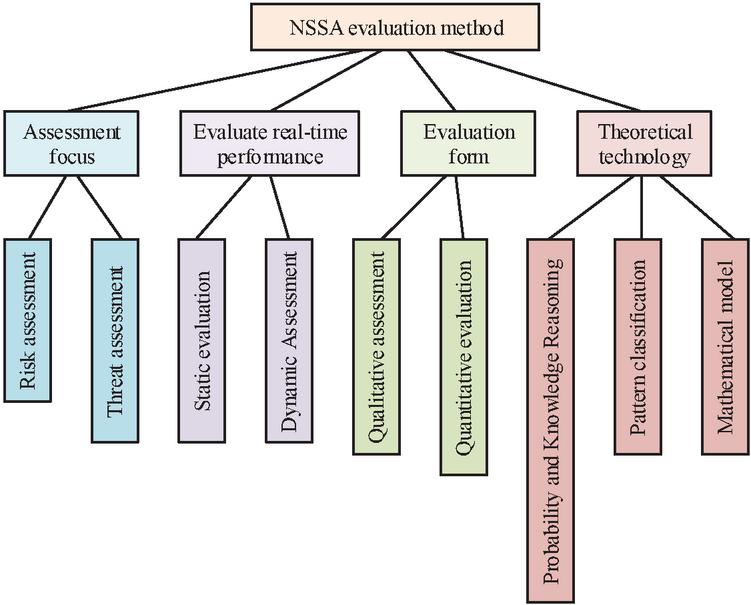
Figure 5 NSSA evaluation method.
Assessment methods can be divided into two categories according to the focus of the assessment, risk assessment, and threat assessment. Depending on the real-time nature of the assessment, it can be divided into two categories: static and dynamic. Depending on the form of the assessment, it can be classified as qualitative or quantitative. Theoretical techniques can be divided into probability-based and inference-based, pattern-based classification, and mathematical model-based. Each of the three theoretical techniques has its own advantages and disadvantages, while the disadvantages of the assessment method based on mathematical modelling techniques, which is more subjective and less objective, can be easily improved, so the study uses mathematical modelling techniques as the theoretical technique for the NSSA assessment method. The study proposes the coefficient of variation method to improve the hierarchical analysis method to enhance its objectivity. After determining the assessment method used for the study, the weights of each indicator need to be determined. The construction of a judgement matrix is shown in Equation (6).
| (6) |
In Equation (6), denotes the importance of indicator to indicator , and the relationship is shown in Equation (7).
| (7) |
After constructing the judgment matrix, it is sufficient to calculate the indicator weights using the eigenvector method, which can be expressed as Equation (8).
| (8) |
In Equation (8), the maximum characteristic root of is and the corresponding weight vector is . After obtaining the subjective weights, it is necessary to pass the consistency test, if the consistency test is not passed, it means that the importance of the indicators is contradictory and needs to be recalculated, after passing the consistency test, the indicator weights can be calculated using Equation (9).
| (9) |
In Equation (9), denotes the weight of the scheme layer relative to the objective layer, denotes the scheme layer weight and denotes the criterion layer weight. The study uses the coefficient of variation method to calculate the objective weights of the indicators, which need to be normalised first. As the indicators are all greater than zero, it is sufficient to de-quantile the indicators and then standardise the deviations, the Equation for which is given in Equation (10).
| (10) |
In Equation (10), denotes the original series and denotes the new series after standardisation. In this evaluation system, indicators can be divided into forward indicators and inverse indicators. The inverse indicators need to be processed in the forward direction before they can be calculated in a uniform way with the forward indicators, and the calculation model is shown in Equation (11).
| (11) |
in Equation (11) represents the normalised inverse data. Once the data are normalised, the coefficient of variation can be used to carry out the calculation of indicator weights, starting with the data items for the indicators using Equation (12).
| (12) |
In Equation (12), indicates the comprehensive data value, and indicates the th indicator of the th data of a certain evaluation data. Then build the decision matrix of the evaluation object, and finally use Equation (13) to calculate the indicator weights can be.
| (13) |
In Equation (13), indicates the indicator weight and indicates the coefficient of variation. The combined weights of the indicators, which need to be corrected using the coefficient of variation, must be calculated after the subjective and objective weights of the indicators have been determined, as indicated in Equation (14).
| (14) |
In Equation (14), is the subjective weight of the first indicator, is the objective weight for , is the composite weight for , and is the empirical coefficient for . The Lagrangian function is then used to solve for , as shown in Equation (15).
| (15) |
When the amount of data is sufficient, a linear weighting method can also be used to find its composite score to improve the robustness of the assessment system, as shown in Equation (16).
| (16) |
In Equation (16), is the combined data value of the th indicator for that evaluation object, is the final score for that test, and a larger indicates a better current network posture [16–18].
4 Analysis of Simulation Experiments
This section’s main subject – divided into two subsections – is the study of the simulation experiments’ findings. The results of the application of the A-A are analysed in the first subsection, and the outcomes of the computation of the weights of the network security posture evaluation indicators are investigated in the second.
4.1 Analysis of Multiple Source Data Results Based on A-A
Testing is a particularly important step in the development process. The purpose of the test is to find out the problems of the system and ensure the final product quality. The server model used in the test environment is I80-G43 equipped with dual network card of 1 Gbps, using the operating system Centos7.5. Data collection requires installation of DPDK, Flume, OCS, Suricata and Telegraf. Data processing depends on the JDK environment, and the installation of a big data platform to store and process multi-source data.
Table 2 Experimental environment settings
| Module | Device |
| Server | Dawn and broad skyI80-G43 |
| System | Centos7.5 |
| Data acquisition | DPDK, Flume, OCS, Suricata, Telegraf |
| Data processing | JDK |
| Abnormal analysis | python |
| Heterogeneous visualization module | ECharts, JQuery |
| Other | Java |
The anomaly analysis test stage was developed in Python, the visualization module was written by ECharts or JQuery framework, and the remaining modules were developed in Java. To conduct network attack simulation experiments, firstly, it is necessary to determine the objectives and scope of the experiment, including the time, location, participants and resources of the experiment, and secondly, it is necessary to build a suitable experimental environment according to the objectives and scope of the experiment, including network topology, host configuration, vulnerability settings, and defence measures. A virtual machine or a physical machine can be used to build the experimental environment, and some professional network attack and defence simulation tools, such as CyberBattleSim, kaliKali, etc., can also be used. The third is to choose the appropriate type of attack according to the purpose of the experiment. The more common attack types are Denial of service (DoS) attack, SQL injection, cross-site scripting (XSS) attack, etc., and finally execute the network attack simulation plan. In order to verify the data processing capability of multi-source data association analysis based on A priori algorithm, a network topology structure was built. The attack end uses Hping3, Nmap, Hydra tools to launch the attack in the Kail Linux system, and the protection end uses Suricata to detect specific attack types. In this experiment, 23,279 network attacks were set up, of which 4,982 were DoS, 3,686 were remote network control, 2,475 were phishing, 1,752 mining nodes, 2,901 vulnerabilities, 2,714 were attack explosions, 2,754 were worm attacks, and 2015 were crawler attacks. The gap between the data collected by the algorithm and the actual data was tested, and the results are illustrated in Figure 6.
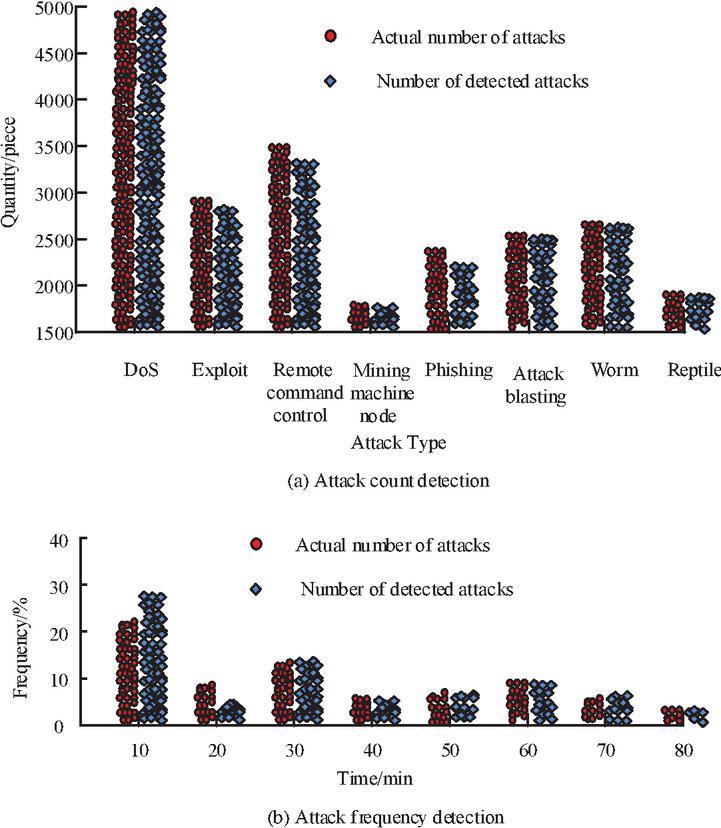
Figure 6 Number and frequency detection of network attacks.
Figure 6 demonstrates that, of all the attack types, DoS has the most attacks (4982), and that the number of detected attacks is nearly identical to the number of actual attacks. In addition to DoS, the attack type with the highest number of attacks is remote command and control, the actual number of attacks for this attack type is 3686 and the number of detected attacks is 3457, with a detection rate of 93.8%. Of all the attack types, the lowest detection rate was phishing, with 2,475 actual attacks and 2,237 detected attacks, a detection rate of 90.3%. The detection rates for the remaining attack types were all above 98%. The data collection effect of the A-A-based MSDA analysis meets the design requirements and can be used for the extraction of association rules. The study set the threshold for association rule search to 0.3 and to 0.9. Data association mining was performed in the NSL-KDD intrusion detection dataset. A total of 75 association rules were found, and the study ranked some of these strong association rules, as shown in Table 3.
Table 3 Partial strong association rule sorting results
| RHS | LHS | Confidence | Support | Lift | |
| 1 | 1 | 0.9874 | 1.0127 | ||
| 2 | 1 | 0.9874 | 1.0127 | ||
| 3 | 1 | 0.9874 | 1.0127 | ||
| 4 | 1 | 0.9874 | 1.0127 | ||
| 5 | 1 | 0.9873 | 1.0127 | ||
| 6 | 1 | 0.9873 | 1.0127 | ||
| 7 | 1 | 0.9857 | 1.0127 | ||
| 8 | 1 | 0.9857 | 1.0127 | ||
| 9 | 1 | 0.9857 | 1.0127 | ||
| 10 | 1 | 0.9857 | 1.0127 |
In Table 3, all of these strong association rules have a confidence level of 1, which has reached the maximum confidence level, and all of these association rules also have a support level of 0.98 or higher. The support and confidence level of association rules 7, 8, 9, and 10 are also consistent, at 0.9857 and 1, respectively. The confidence level of an association rule indicates its reliability. The higher the confidence level, the more reliable the association rule is. The support level can indicate whether the association rule is a strong association rule or a weak association rule. The association rules listed in the study are all strong association rules3.2. Analysis of Multilevel Assessment Results Based on Coefficient of Variation Indicator Weights.
After verifying the association rule extraction capability of the MSDA method based on the A-A, the study calculated the various weights of each indicator, of which the various weights of the quality of service indicators and network traffic indicators are presented in Table 4.
Table 4 Weights of service quality and network traffic indicators
| Primary | Subjective | Secondary | Subjective | Objective | Comprehensive |
| Indicators | Weight | Indicators | Weight | Weight | Weight |
| 0.1136 | 0.0347 | 0.9347 | 0.5767 | ||
| 0.0347 | 0.0000 | 0.1593 | |||
| 0.0126 | 0.0007 | 0.0054 | |||
| 0.0124 | 0.0003 | 0.0087 | |||
| 0.1633 | 0.0617 | 0.0000 | 0.0248 | ||
| 0.0617 | 0.0000 | 0.0248 | |||
| 0.0171 | 0.0015 | 0.0077 | |||
| 0.0171 | 0.0017 | 0.0076 | |||
| 0.0060 | 0.0080 | 0.0071 |
Table 4 shows that the difference between the weights of the two primary indicators is around 0.05, and the weights of both primary indicators are low, below 0.2. Among the subjective weights of the nine secondary indicators, the lowest weight is 0.006 for the abnormal traffic ratio indicator. The highest subjective weight is 0.0617 for the remaining indicators, and the objective weights for the average traffic length and packet size are both of this value. Three of the secondary indicators have an objective weight of 0, namely the average time before packet idle, the average length of traffic, and the average packet size. Table 5 displays the outcomes of the calculation of the vulnerability and risk indicator weights.
Table 5 Vulnerability and risk index weights
| Primary | Subjective | Secondary | Subjective | Objective | Comprehensive |
| Indicators | Weight | Indicators | Weight | Weight | Weight |
| 0.0754 | 0.0232 | 0.0081 | 0.0141 | ||
| 0.0438 | 0.0080 | 0.0224 | |||
| 0.0084 | 0.0074 | 0.0820 | |||
| 0.6472 | 0.0720 | 0.0080 | 0.0355 | ||
| 0.0147 | 0.0078 | 0.0108 | |||
| 0.0820 | 0.0081 | 0.0374 | |||
| 0.0573 | 0.0008 | 0.0238 | |||
| 0.0820 | 0.0008 | 0.0331 | |||
| 0.1434 | 0.0009 | 0.0582 | |||
| 0.1435 | 0.0010 | 0.0581 | |||
| 0.0244 | 0.0010 | 0.0100 | |||
| 0.0286 | 0.0009 | 0.0121 |
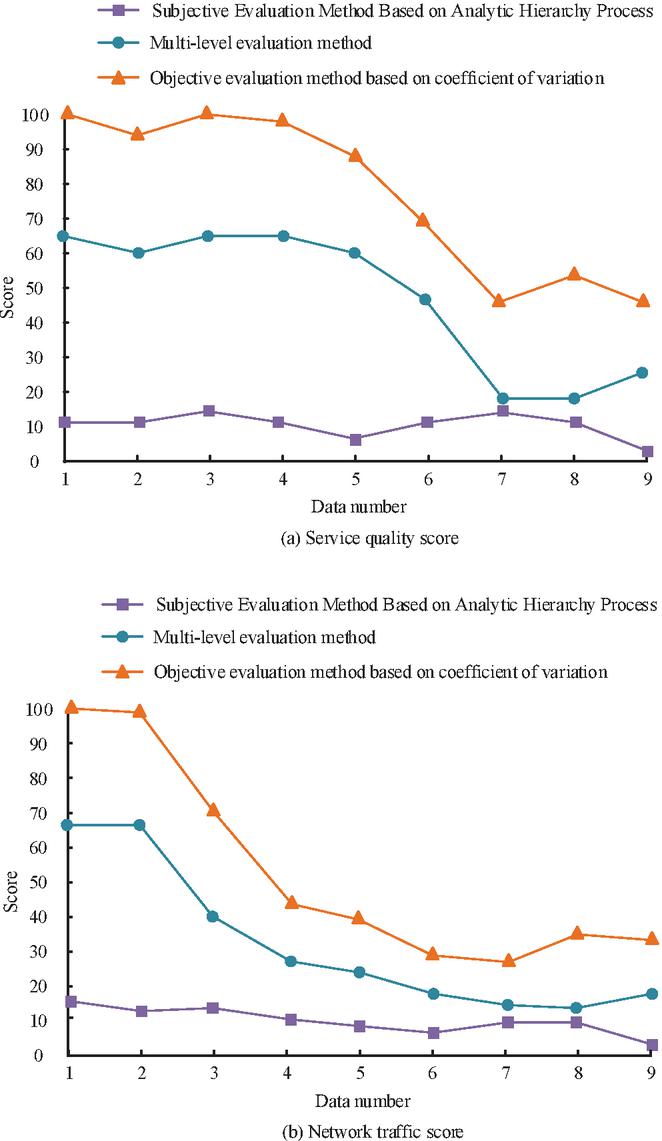
Figure 7 Comparison of service quality and network traffic score results.
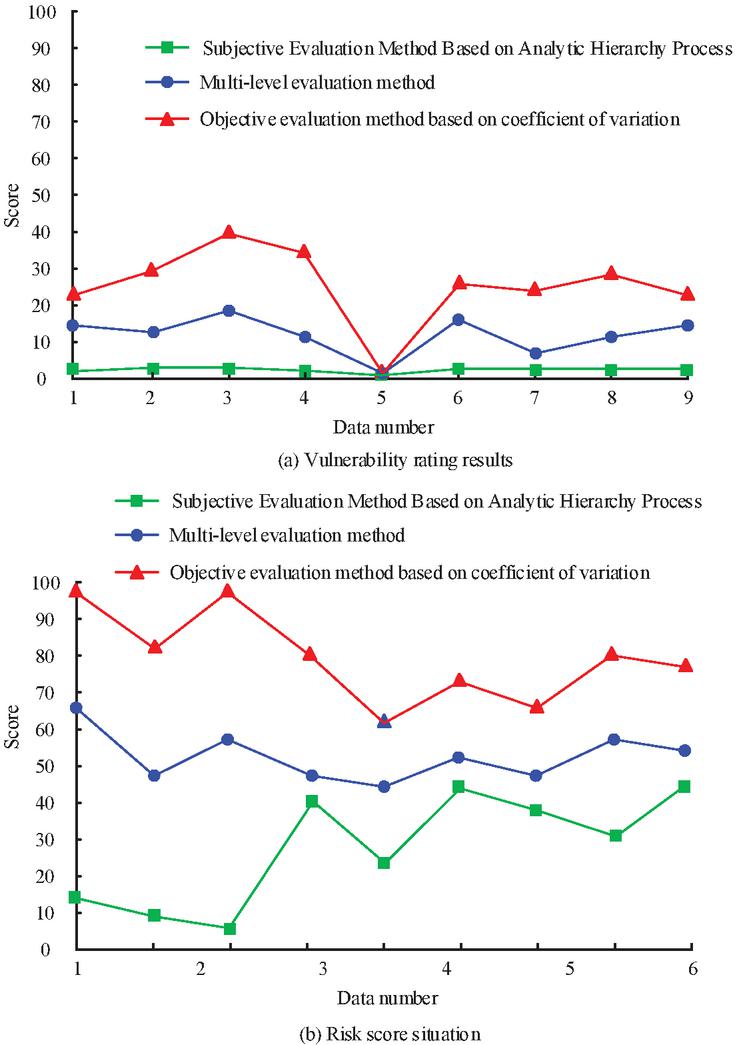
Figure 8 Comparison of vulnerability and risk score results.
Table 5 shows that the vulnerability indicator has a lower weight than the risk indicator, with the vulnerability indicator having a weight of only 0.0754 and the risk indicator having a weight of 0.6472. Of all the secondary indicators, the system type indicator has the lowest subjective weight of 0.0084, BRUTE_FORCE has the highest subjective weight of 0.1435, the type of DOS attack has the lowest objective weight of with only 0.0008, the number of security devices had the highest objective weight of 0.0081, APPLICATION_ATTACKS had the lowest combined weight of 0.0100, and system type had the highest combined weight of 0.0820. After determining the index weights, the study named the multi-level evaluation method as the same as the Objective evaluation method based on safety factor (OBSF), the subjective evaluation method based on Analytical Hierarchy Process (AHP), and the score of the quality of service and network traffic. Process (AHP), where the scores of service quality and network traffic are shown in Figure 7.
Figure 7(a) shows the comparison of service quality scores. The figure presents that the method based on the coefficient of variation scores higher, with a maximum score of 100. The subjective evaluation method based on hierarchical analysis scored lower, with a maximum score of 11. The evaluation method designed for the study scored between the two, with a maximum score of 66, and the trend was consistent for all three evaluation methods. Figure 7(b) shows a comparison of the network traffic scores. The distribution of scores for the three assessment methods is similar to that in Figure 7(a). The vulnerability and risk scores are illustrated in Figure 8.
Figure 8(a) The vulnerability scores of the three evaluation methods show that the subjective evaluation method still scores low, with its vulnerability score not exceeding 5. The objective evaluation method scores higher, with all scores above 20, except for data number 4. The research design method scores between the two, with all scores around 15 except for data number 4. All three evaluation methods scored low for data number 4, with the subjective evaluation and study design methods all scoring 0 for data number 4. Figure 8(b) shows the hazard scores, with a consistent trend of scores for all three evaluation methods, with data #2 scoring highest and data #5 scoring lowest.
5 Conclusion
A multi-level evaluation method based on the weights of variance coefficient indicators is designed in the study and utilised to assess NSSA. The study uses the A-A to mine probable correlations in the specifics of network attacks. This will improve the multi-source data processing capability of NSSA. When determining the weights of indicators using the hierarchical analysis method, the phenomenon of excessive subjective factors can be avoided by using the method, which calculates the objective weights of indicators using the coefficient of variation and combining those weights with the subjective weights to find the comprehensive weights of indicators. The findings indicate that the A-A has a detection rate for network attacks of over 90%, with the detection rate for phishing attacks being the lowest at 90.3%. The minimum packet arrival interval indicator has an objective weight of 0.9347 and a comprehensive weight of 0.5767, respectively. The subjective weight evaluation approach based on the hierarchical analysis method was assessed as being too low, while the objective evaluation method based on the coefficient of variation was rated as being too high. With the goal to prevent subjective elements from being either too high or too low, the study developed a multilevel assessment approach based on coefficients of variation that scored in the middle, neither too high nor too low. Overall, the evaluation method’s scores for all six types of data continued to decline. The evaluation technique’s scores are more realistic, and the approach created for the study is better at recognising information about cyber-attacks, but the model still needs to be improved because it lacks predictive capacity. Therefore, in the future, this model can be used in conjunction with data prediction classification models to enable staff to predict network attack behavior and further improve network security performance.
References
[1] Zhang H, Li Y, Lv Z, AK Sangaiah, T Huang. A real-time and ubiquitous network attack detection based on deep belief network and support vector machine. IEEE/CAA Journal of Automatica Sinica, 2020, 7(3):790–799.
[2] Wang X, Cheng M, Eaton J, Chojui Hsieh, S. Felix Wu. Fake node attacks on graph convolutional networks. Journal of Computational and Cognitive Engineering, 2022, 1(4): 165–173.
[3] Xl A, Jybc A, Wl D, DY E, YWB C, WF Yu. Network security situation: From awareness to awareness-control. Journal of Network and Computer Applications, 2019, 139:15–30.
[4] TaoXiao-ling, LiuZi-yi, YangChang-song. An Efficient Network Security Situation Assessment Method Based on AE and PMU. Wireless Communications and Mobile Computing, 2021, 2021(9):1–9.
[5] Zhang D, Hu Y, Cao G, Y Liu, Q Pan. Dataflow Feature Analysis for Industrial Networks Communication Security. Xibei Gongye Daxue Xuebao/Journal of Northwestern Polytechnical University, 2020, 38(1):199–208.
[6] Kou G, Wang S, Tang G. Research on Key Technologies of Network Security Situational Awareness for Attack Tracking Prediction. Chinese Journal of Electronics, 2019, 28(1):166–175.
[7] Chen Z. Research on internet security situation awareness prediction technology based on improved RBF neural network algorithm. Journal of Computational and Cognitive Engineering, 2022, 1(3): 103–108.
[8] Aur F, Deniz S S, Yazici K. Visual Preferences Assessment of Landscape Character Types Using Data Mining Methods (A priori Algorithm): The Case of Altnsa and Inkoy (Van/Turkey). Journal of Agricultural Science and Technology, 2020, 22(1):247–260.
[9] Tan L, Yu K, Ming F, Cheng X, Srivastava G. Secure and resilient artificial intelligence of things: a HoneyNet approach for threat detection and situational awareness. IEEE Consumer Electronics Magazine, 2021, 11(3): 69–78.
[10] Wang X, Huang D, Zhao X. Design of the Sports Training Decision Support System Based on Improved Association Rule, the A priori Algorithm. Intelligent Automation and Soft Computing, 2020, 26(4):755–763.
[11] Lai X, Zhang S, Mao N, J Liu, Q Chen. Kansei engineering for new energy vehicle exterior design: An internet big data mining approach. Computers & Industrial Engineering, 2022, 165:107913–107935.
[12] Musa R A, Manaa M E, Abdul-Majeed G. Predicting Autism Spectrum Disorder (ASD) for Toddlers and Children Using Data Mining Techniques. Journal of Physics: Conference Series, 2021, 1804(1): 12089–12097.
[13] Hasheminejad S, Khorrami M. Clustering of bank customers based on lifetime value using data mining methods. Intelligent Decision Technologies, 2021, 14(4):507–515.
[14] Li J, Li Q, Zhu Y, Y Ma, Xu, Yubin, C Xie. An Automatic Extraction Method of Coach Operation Information from Historical Trajectory Data. Journal of advanced transportation, 2019, 2019(PT.1):1–15.
[15] Tessema A. Audit quality, political connections and information asymmetry: evidence from banks in gulf co-operation council countries. International Journal of Managerial Finance, 2020, 16(5):673–698.
[16] Corstjens J, Depaire B, Caris A, K Sörensen. A multilevel evaluation method for heuristics with an application to the VRPTW. International Transactions in Operational Research, 2019, 27(1):168–196.
[17] Li B, Liu S, Guo Y, Z Du, Z Ding. Multi-core and cross-chain evaluation method based on multi-core mesh collaboration relationship. IEEE Access, 2020, 8(4):151829–151846.
[18] Singh S, Sahni M, Kovid R K. What drives FinTech adoption? A multi-method evaluation using adapted Technology Acceptance Model Journal: Management Decision. Management Decision, 2020, 58(8): 1675–1697.
Biographies

Wei Li obtained his ME in Computer Application from Xi’an Jiaotong University in 2009. Presently, he is working as an deputy senior engineer in China Tobacco Zhejiang Industrial Co., Ltd. His areas of interest are computer communication technology, Intelligent network and network security.

Jianjun Li obtained his ME in Computer Science and Technology from Zhejiang University in 2005. Presently, he is working as an deputy senior engineer in China Tobacco Zhejiang Industrial Co., Ltd. His areas of interest are computer communication technology, Intelligent network and network security.

Chengting Zhang obtained his BE in Communication Engineering from South China University of Technology in 2008. He obtained his ME in Network Engineering from Zhejiang University in 2010. Presently, he is working as a network administrator in the China Tobacco Zhejiang Industrial Co., Ltd. His areas of interest are computer communication technology and network security.

Guang Yao obtained his BE in Information Management and Information System from Renmin University of Information Resources Management in 2011. Presently, he is working as an information resources system administrator in China Tobacco Zhejiang Industrial Co., Ltd. His areas of interest are computer communication technology, application system construction, artificial intelligence and network security.

Xue Xu graduated from North China Electric Power University Software Engineering in 2019. She received her master’s degree in North China Electric Power University Software Engineering in 2019. Presently, she is working as an information system administrator in China Tobacco Zhejiang Industrial Co., Ltd. Her areas of interest are target detection, big data, and artificial intelligence.
Journal of Cyber Security and Mobility, Vol. 12_6, 869–892.
doi: 10.13052/jcsm2245-1439.1263
© 2023 River Publishers