Network Security Maintenance and Detection Based on Diversified Features and Knowledge Graph
Qiang Wu
School of Information Technology, Jiangsu Open University, Nanjing, 210036, China
E-mail: QiangWu_1993@outlook.com
Received 20 December 2023; Accepted 19 February 2025
Due to the large processing capacity and high false alarm rate, current security defense technologies in enterprise networks are often deployed in practical environments, resulting in weak defense capabilities. Based on this, a proactive defense architecture is proposed based on diverse features and knowledge graphs, and its performance is analyzed. The experimental results showed that the detection rate of the detection method in malicious attack behavior could exceed 85% or more. The false alarm rate was significantly less than 10%. The detection rate of 9 types of malicious attack software remained between 76.1% and 98.7%. The detection method in normal access behavior detection had a minimum false alarm rate of 0.05% and a maximum false alarm rate of only 0.1%. The proactive defense effect of the proxy server was relatively obvious, which was more effective in blocking traffic data. At the same time, the defense effectiveness of proactive defense architecture varied under different attack methods, reaching a maximum of 98%, which was basically consistent with the detection rate in malicious attack behavior. Overall, the proactive defense architecture for network security maintenance and detection is effective and practical, which can be effectively applied in practical enterprise network security maintenance and detection.
Keywords: Diversified features, knowledge graph, network security, malicious attack behavior, detection rate.
In the current Internet era, a large number of security vulnerabilities, viruses, Trojans, etc. are gradually emerging, which steal and abuse information for commercial purposes, seriously threatening the network security [1, 2]. At the same time, with the continuous development of computer technology, various attack methods and tools are constantly emerging. Network attacks are also showing a highly comprehensive and automated trend. The understanding required for attackers is constantly decreasing, and attack techniques are also constantly improving [3, 4]. The current methods for maintaining and detecting network security include using physical devices such as firewalls for protection and isolation, scanning software tools for frequent network scanning and detection, third-party antivirus software for terminal security, and using network basic service devices to analyze path traffic and system log records. However, these methods will more or less occupy user hardware resources and pose a risk of information leakage. Meanwhile, embedded devices in industrial control systems are difficult to install Arctic detection algorithms, making information security maintenance easy to attack and difficult to defend [5]. The continuous evolution of network intrusion methods and insufficient defense capabilities of enterprises may lead to false alarms. Intrusion false alarms can cause enterprise security teams to spend a lot of time and energy investigating and processing false alarms, thereby affecting the response speed to real threats. In addition, frequent false alarms can reduce the security team’s awareness of the security system, leading to insufficient vigilance towards real attack alerts. In addition, the current enterprise network has significant differences in requirements for network security maintenance and detection due to different carrying services, which often requires manual intervention, resulting in poor timeliness [6]. In this situation, it will increase the economic losses of the enterprise and may potentially affect normal business operations. Therefore, enterprises face insufficient network intrusion detection capabilities. Knowledge graph represents various network security entities and their relationships in graphical form, thereby establishing semantic associations, obtaining causal relationships of attack events, and achieving more accurate threat prediction and tracking. Diversified features can capture potential threats that cannot be detected by traditional single features by collecting multiple data sources such as system logs and user behavior, and extracting multidimensional and multilevel features, thereby improving the accuracy of intrusion detection. The various characteristics in the field of computer security can include system log features, user behavior features, network traffic features, threat intelligence features, or device features. For example, system log features represent abnormal events such as errors and warnings recorded by the operating system, as well as system logs and application operation logs. User behavior features represent login time, access frequency, file access mode, etc. Diversified features come from different levels of the network, providing comprehensive feedback for network records. Relying on a single data source may not be sufficient to accurately identify complex attack behaviors. However, by integrating multiple different features, detection accuracy and efficiency can be improved. Therefore, the study proposes an proactive defense architecture for complex network information security environments, which is based on multiple features and knowledge graphs and integrates artificial intelligence algorithms. Its purpose is to enhance network security maintenance and detection capabilities, and strengthen the real-time defense level of network security.
The research is divided into four sections. The first section summarizes and discusses the current research on network maintenance and detection technology. The second section analyzes the active defense architecture and its two important internal sections. The third section analyzes the performance of the active defense architecture. The fourth section summarizes the entire article.
Faced with malicious cyber attacks, the development of information technology software has led to a comprehensive and diversified trend. Cybersecurity is becoming increasingly severe. How to propose comprehensive network maintenance and detection technologies in response to diversified attack behaviors has become the key to current internet security maintenance [7]. In response to this issue, many scholars have conducted research on it. Zhao M et al. proposed a selection model for network security maintenance and detection based on prospect theory to address the related issues in language decision network maintenance. This method effectively improved the actual security of the network [8]. Ullah M U et al. proposed an intelligent intrusion detection system using machine learning methods to address the network server security maintenance, effectively improving the detection accuracy of network attack behavior [9]. Cvitić I et al. analyzed distributed denial of service to address security maintenance in electronic learning systems. A model for network threat detection was proposed. This improved the accuracy of detection while improving the quality of online teaching processes [10]. Saheed Y K et al. proposed a detection method for Internet of Things (IoT) network attacks and intrusions through machine learning to address the security maintenance issues of the IoT. This not only improved detection accuracy, but also reduced the probability of information leakage [11].
In addition, Li S et al. proposed a detection method for network false alarms through deep learning technology and machine learning algorithms to address the redundant information in a large number of network attack alerts. This effectively reduced the number of false alarm data on the basis of achieving alarm data labeling and classification [12]. Mehedi S T et al. proposed a trusted intrusion detection model for network intrusion based on deep transfer learning to address the security issues of enterprise IoT systems and applications. This improved the accuracy of intrusion detection based on comprehensive evaluation of labeled data and reduced the threat of network attack behavior to IoT applications [13]. Dwivedi S et al. proposed a new method for distributed denial of service provision defense and detection based on intelligent evolutionary algorithms to address the network security issues of information technology. This improved the accuracy of intrusion detection and reduced false positives (FP) while effectively distinguishing between normal traffic and supply traffic [14]. Sun N et al. proposed a near real-time network spam detection model using machine learning technology to address the spam network email intrusion. This effectively reduced the threat of spam attacks while reducing data training time and model update costs [15].
From existing research, it can be seen that the current protective measures against diverse security attacks are generally fragmented, and the real-time work efficiency is affected by workload. At the same time, due to the large amount of actual alarms, network security administrators often cannot handle them in a timely and effective manner, making it difficult to effectively play an alarm role. The security attack detection method for network devices and system logs has insufficient data granularity and cannot accurately and comprehensively reflect network management information. Especially for attacks with obvious dynamic changes, the detection effect is difficult to guarantee. Based on this, proposing an active defense architecture that integrates intelligent algorithms not only improves network security maintenance and detection capabilities, but also improves detection efficiency, making it innovative.
The proactive defense architecture mainly utilizes diverse features and knowledge graphs, and its important modules include malicious attack behavior and normal behavior analysis. Therefore, this section mainly elaborates on the active defense architecture and its internal detection methods for malicious attack behavior and normal behavior detection. On the basis of knowledge graph, a hybrid clustering algorithm is used to establish a method for detecting malicious attacks. A first-order homogeneous Markov chains (FHM) algorithm is used to establish a method for detecting normal behavior, thereby establishing a proactive defense architecture for network security maintenance.
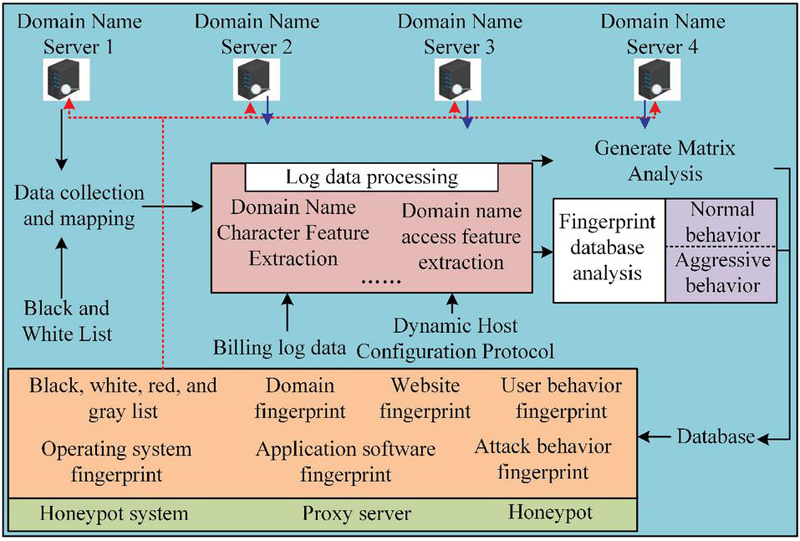
The current security defense technologies in enterprise networks often bypass deployment in practical environments due to their large processing capacity and high false alarm rates, resulting in weak defense capabilities. Based on this, the research proposes a proactive defense architecture for network security maintenance and detection based on Domain Name Service (DNS). Its schematic is shown in Figure 1.
From Figure 1, it can be seen that the proactive defense architecture extracts diverse features from the perspectives of domain name characters and domain name access volume through the data collection and mapping module. In the fingerprint database analysis module, the domain name knowledge fingerprint is used to analyze normal access behavior and network attack behavior, thereby utilizing diverse features and knowledge graphs to achieve network security maintenance and detection. Specifically, the research sends DNS logs collected from the log server to the data processing platform, and applies the various fingerprint feature detection results obtained from analysis to the defense system. In addition, the study introduces the concept of knowledge graph to describe the characteristic relationships between domain names, websites, users, and commonly used systems and software, and network attack behaviors. The domain name is used as a node, and the query relationships and time series are represented by edges to form a fingerprint graph.
Figure 1 Schematic diagram of active defense system architecture for DNS log analysis.
Among them, when analyzing and detecting log data using DNS, a fingerprint model of normal access behavior is first constructed. A Fuzzy C-Means algorithm (FCM) is used to detect user access behavior fingerprints. The FCM algorithm performs rough clustering on all access behaviors, which is effective in analyzing fingerprint feature relationships between users and behaviors, users and users, and behaviors compared to other algorithms [16, 17]. In group user feature analysis, all users are divided into different features, and each group of users frequently forms a dataset. The overall rating expression of a behavior fingerprint in this dataset is shown in Equation (1).
| (1) |
In Equation (1), represents the overall rating of the dataset for behavior fingerprint. represents the set of all users with a non zero fingerprint score for the behavior. indicates the number of users. represents the rating of the user on the behavior fingerprint, which is also an element in the dataset . For individual user characteristics, the modified cosine similarity is used to calculate the similarity between users and behavioral fingerprints, as expressed in Equation (2) [18].
| (2) |
In Equation (2), and represent the modified cosine similarity of users and , and behavior fingerprints and . and represent a set of non zero users and behavioral fingerprints. indicates the rating of an individual user on a behavioral fingerprint. and respectively represent the mean of all users’ fingerprints for a certain behavior and a user’s fingerprints for all behaviors that are not zero. The loss functions for constructing user relationships, behavioral fingerprints, and user fingerprint relationships are expressed in Equation (3).
| (3) |
In Equation (3), , , and represent the loss functions of user relationships, behavioral fingerprints, and user fingerprint relationships, , , and represent the ownership matrix of users, behavioral fingerprints, user and behavioral fingerprints, and , , and are its internal elements. and represent the number of rows and columns in a matrix, with the maximum values being and , respectively. represents a binomial. Finally, the FCM algorithm is optimized to minimize the loss function, as expressed in Equation (4) [19].
| (4) |
In Equation (4), represents a real orthogonal matrix. represents a matrix composed of identity matrices and . Finally, FCM utilizes the minimum standard function to obtain the final clustering result, which is expressed in Equation (5).
| (5) |
In Equation (5), represents the final clustering result. and represent the behavioral fingerprint score and clustering points. and are the internal elements. represents the measurement value that the user or behavioral fingerprint score item belongs to a certain category. represents the Euclidean distance between two points. indicates the membership factor. indicates the amount of cluster category information [20].
In addition to normal behavior feature detection, fingerprint feature detection of network attack behavior is also a key focus in the active defense architecture. For the detection of network attack behavior, the study utilizes the transfer probability of the first-order FHM algorithm to construct attack behavior classification samples. A dataset is constructed using observed attack behavior. Among them, probability graph models are used to characterize the transfer probability, with a focus on studying the correlation between transfer probabilities. When constructing FHM, a set of discrete time random variables and their corresponding values are first set. When the random variable is a first-order Markov chain (FM), the expression is shown in Equation (3.2).
| (6) |
In Equation (3.2), is the conditional probability when FM is satisfied. The corresponding value is represented by . For FM, when its transition probability from the previous state to the current state does not change with time, it is called FHM. The FHM expression and FHM transition matrix are shown in Equation (7).
| (7) |
In Equation (7), and respectively represent the current state and the previous state. indicates the probability of migration. represents the FHM transfer matrix. and represent the state of the previous and current attack behavior, respectively. When a sample set of known attack software is given, the timing of each attack and another attack can be mapped to the state of FHM. Therefore, the probability of any attack timing occurrence is expressed in Equation (8).
| (8) |
In Equation (8), represents the aggressive behavior. indicates the initial state probability of the state as the entry state at the time of occurrence. indicates the output observation probability of the state as an exit state. Assuming that the corresponding variable set in the fingerprint model of network attack behavior can be divided into two disjoint variable sets, it can be inferred that the boundary probability of one of the variables is its conditional probability. The corresponding expression is shown in Equation (9).
| (9) |
In Equation (9), represents the joint probability. and represent two disjoint sets of variables. Since the joint probability can be obtained through a probability graph model, the inference of attack behavior in Equation (9) is transformed into a problem of calculating the boundary distribution, as expressed in Equation (10).
| (10) |
In practical applications, the FHM algorithm is improved to address the feature adaptation in the behavior of attacking software querying DNS. Firstly, the weight coefficient is added to the calculation model and the attack behavior is weighted according to the damage degree. At the same time, the defense effect is fed back to the analysis system by introducing negative feedback parameters, as expressed in Equation (11).
| (11) |
In Equation (11), and represent the weights and negative feedback parameters of the attack behavior. Secondly, multiple identical sub paths of behavior transfer can be merged to simplify the rules of the matrix. Next, when both fingerprint variable quantum sets need to pass through a node set, the node set has conditional independence for that node. Under the given attack, separate analyses are performed on these two different quantum sets. The improved expression is shown in Equation (12).
| (12) |
In Equation (12), represents the set of intermediate nodes. Finally, in intrusion detection, a probability graph of action migration is given based on time sequence. If there is the same previous action, then this action should be removed from the sub path. Through four steps of improvement and optimization, the FHM algorithm has a more effective recognition ability for attack behaviors appearing in the attack software sample set. Among them, the probability of the domain name corresponding to the attack behavior in the algorithm depends on the frequency. The attack behavior depends on the attack distribution proportion. The attack distribution proportion depends on the Dirichlet parameter. The frequency of the domain name appearing in the attack behavior depends on the hyperparameter . The corresponding expression is shown in Equation (3.2).
| (13) |
In Equation (3.2), represents the frequency of domain names appearing in the log file. is its internal element. indicates aggressive behavior. indicates the domain name frequency corresponding to the attack behavior. indicates the proportion of attack distribution. represents the Dirichlet parameter. represents the number of log files, and is its maximum value. indicates the number of attack behaviors, and is its maximum value. represents the number of domain names, and is its maximum value. Therefore, when given a domain name training dataset, the maximum likelihood method is used to estimate the maximum logarithmic likelihood, as expressed in Equation (14).
| (14) |
In Equation (14), represents the maximum logarithmic likelihood value. uses Gibbs sampling to obtain an approximate value within time. Its expression is shown in Equation (15).
| (15) |
In Equation (15), represents Gibbs sampling. Finally, the transfer probability fingerprint classification algorithm using FM for network attack behavior is shown in Figure 2.
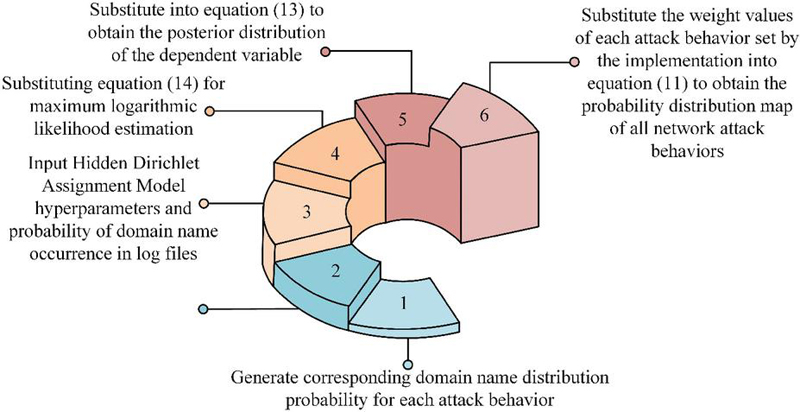
Figure 2 An MF-based fingerprint classification algorithm for network attack behavior migration probability.
From Figure 2, the process first generates the corresponding domain name distribution probability for each attack behavior, the corresponding domain name distribution probability for each log file, and the proportion of attack behavior. Next, the hyperparameters of the implicit Dirichlet allocation model and the probability of domain name occurrence in the log file are input. The approximate value is calculated using Equation (15). Next, Equation (14) is substituted for maximum logarithmic likelihood estimation. Then, it is substituted into Equation (3.2) to obtain the posterior distribution of the dependent variable. Finally, the probability distribution map of all network attack behaviors is obtained by substituting the weight values of each attack behavior set into Equation (11). The study uses FCM algorithm to detect network malicious attacks and FHM to detect potential intrusions in normal access behavior, thus establishing a proactive defense architecture based on knowledge graph and FCM-FHM.
To verify the performance of the active defense architecture, simulation and practical analysis are conducted in this section. It includes verifying the performance of FHM in detecting malicious network attacks, FCM algorithm in detecting normal network behavior, and practical applications of active defense architecture.
As the research mainly analyzes network security maintenance and detection, the first step of the study is to analyze the detection algorithms for network attack behavior. Due to privacy protection, confidentiality restrictions, and the rarity of attack behavior, obtaining enterprise level computer system logs, user behavior, and other data sources with real labels faces significant challenges. Therefore, the data used for model training and testing are all sourced from the open-source dataset Virus Share in the field of network security as the testing base data, and 3.46 million attack software samples are selected. Fingerprint detection is performed on their DNS query records, and 100 conventional Trojan, virus, and worm malicious attack behavior sample programs are selected for each test set. In terms of evaluation indicators, the study uses detection rate to evaluate the rate at which the system successfully identifies malicious behavior or attacks. FP is used to evaluate the rate at which the system incorrectly identifies normal behavior as malicious behavior. False negative rate (FN) is used to evaluate the rate at which the system fails to identify actual malicious behavior. The detection rate directly reflects the ability of the security system to identify threats, while the false alarm rate can affect the cost of using resources related to the system. It is necessary to reduce unnecessary alarms and resource waste, while missed alarms may lead to security threats not being detected and processed in a timely manner. A low false alarm rate is crucial for network security. Detection techniques that utilize full network traffic and log depth analysis (A), malicious DNS detection techniques (B), and independent access detection techniques (C) are simultaneously introduced for comparison. FP and FN are selected as the comparison indicators. The results are shown in Figure 3.
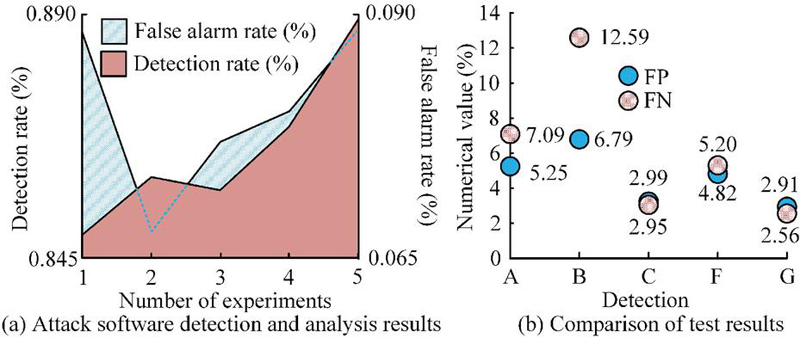
Figure 3 Attack software detection and result comparison.
In Figure 3(b), F and G represent domain name detection results without and with billing log data correction. From Figure 3, the highest detection rate among fingerprint collection and comparison results of different malicious programs could exceed 85%, and the false alarm rate was significantly less than 10%. The increase in the number of test sets also improved the detection rate. After correcting the billing log data, the detection results FP and FN values were 2.91% and 2.56%, respectively, which were better than the comparison method. Overall, correcting billing log data can improve detection accuracy and reduce FP. Therefore, the K-nearest neighbor algorithm (D), support vector machine (E), and research algorithms are introduced to compare domain name log detection (a) with billing log detection (b). The comparison program includes viruses (1), phishing software (2), zombie soft access (3), and distributed denial of service attacks (4). The results are shown in Figure 4.
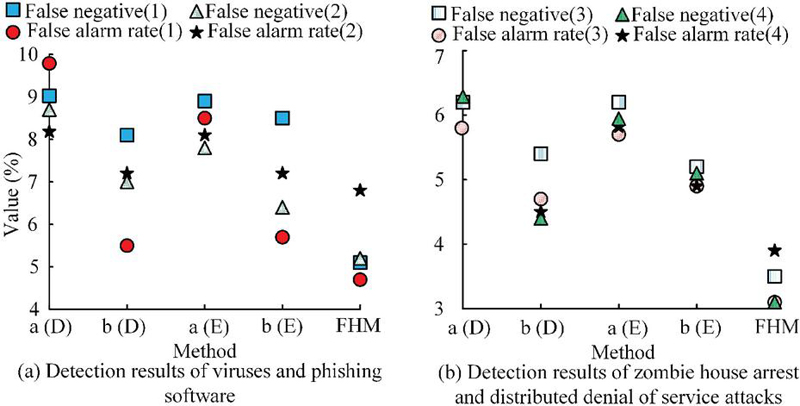
Figure 4 Comparison of detection results of different algorithms.
From Figure 4, the FHM algorithm has the highest FN and false alarm rates of 5.2% and 6.8% among the four malicious attack programs. Overall, the FN and false alarm rates of FHM for the four malicious attack programs were lower than the comparison algorithm, which had higher performance and effectiveness. In addition, the study analyzed the fingerprint detection of common attack behaviors to further validate the superiority of the FHM algorithm. In this experiment, 9 types of malicious code attack domain names were analyzed. They were respectively sending spam information advertisements, scanning crawling devices and application systems, distributed denial of service attacks, virus Trojan botnets, phishing websites, remote control, detecting program vulnerability transmission and removal codes, C&C control server queries, and stealing user sensitive information, represented by 1–9. The K-means algorithm (K) was introduced to compare the malicious code attacks on domain names 1–3, as shown in Figure 5.
From Figure 5, the increase in the number of attack behaviors led to an increase in the detection and recognition rates of all four algorithms. However, for the detection comparison of attack 1, the FHM algorithm was always higher than the comparison algorithm, with obvious sample features and the highest detection and recognition rate of 98.7%. The detection comparison of attack 2 showed that the overall detection effect was relatively low, with FHM reaching a maximum of only 76.1%, but also higher than the comparison algorithm. The detection comparison of attack 3 showed that the difficulty of detecting features was also increasing with the evolution of technology. The actual detection effect of FHM reached 92.1%. The results show that the proposed FHM algorithm exhibits higher detection rates and lower false alarm rates in malicious attack behavior detection compared with K-nearest neighbor algorithm, support vector machine, and K-means algorithm. The comparison results of malicious code attacking domain names 4–6 are shown in Figure 6.
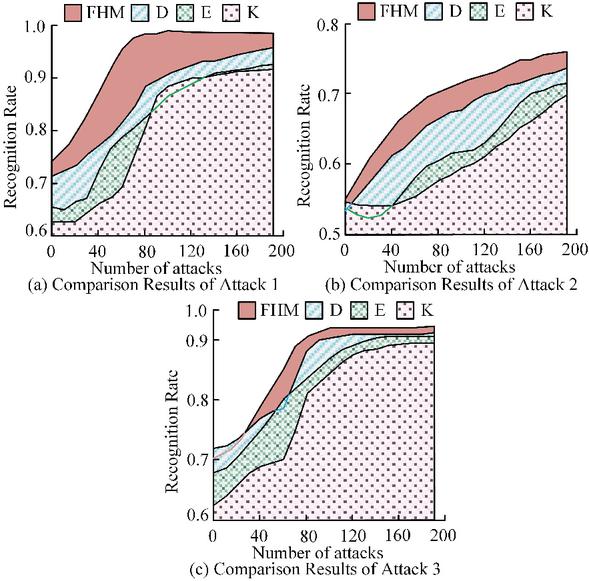
Figure 5 Comparison results of malicious code attacks on domain names 1–3.
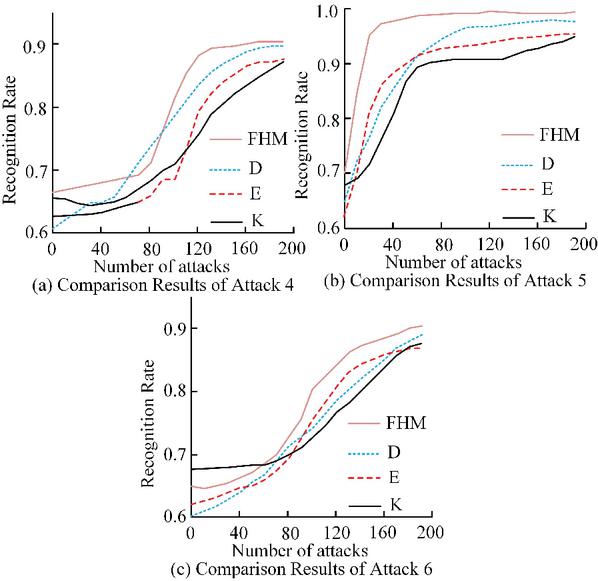
Figure 6 Comparison results of malicious code attacks on domain names 4–6.
From Figure 6, the FHM algorithm in attack 4 was generally higher than the comparison algorithm, with a maximum of 90.1%. Once attack 5 was detected, the quality of its defense would be significantly improved, with the FHM algorithm reaching a maximum of 98.2%. Attack 6 was a perceptual detection of remote targets, and its behavioral characteristics were easily detected after being captured, with a maximum of 92.3%. The comparison results of malicious code attacks on domain names 7–9 are shown in Figure 7.
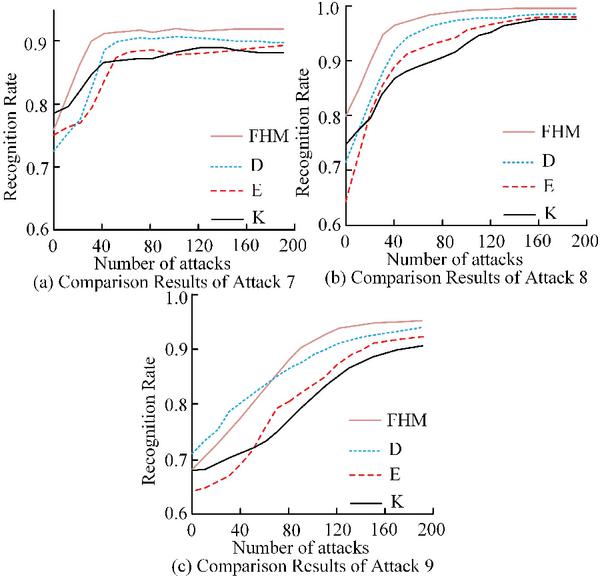
Figure 7 Comparison results of malicious code attacks on domain names 7–9.
From Figure 7, for attack 7, using the feature samples of known vulnerabilities for analysis had a significant detection effect on this part of the attack. After iteration, FHM could reach 91.1%. For attack 8, its domain name query features were very obvious, so the detection effect was very high, with FHM reaching 98.2%. For attack 9, detecting abnormal behavior characteristics of domain name queries could effectively analyze such attacks, with FHM reaching 95.2%. From Figures 5 to 7, the FHM algorithm had a high detection and recognition rate in fingerprint detection of common attack behaviors. The results indicated that in terms of malicious attack behavior detection, the FHM algorithm performed significantly better than other algorithms in intrusion detection. Kao et al. obtained similar conclusions in their research on detecting DDoS attacks by integrating FHM and SPCPL [21]. From this, it can be seen that using a probability graph model to represent the transfer probability can obtain the correlation between transfer probabilities, thereby calculating the probability distribution of all network attack behaviors. This method greatly improves the accuracy of malicious attack detection.
After analyzing the key network malicious attack behaviors, the study began to analyze normal behaviors to verify the performance of the constructed active defense architecture. Among them, in the analysis of user normal behavior, Alexa’s consistently ranked top 10000 domain names were used as a subset of commonly used domain names, while the school DNS logs’ consistently ranked top 10000 domain names were used as a subset of local commonly used domain names. Then, the study also analyzed four types of behavioral fingerprint detection: website, user, operating system, and application software. Therefore, the accuracy results of FCM clustering algorithm and four behavioral fingerprint detection are shown in Figure 8.
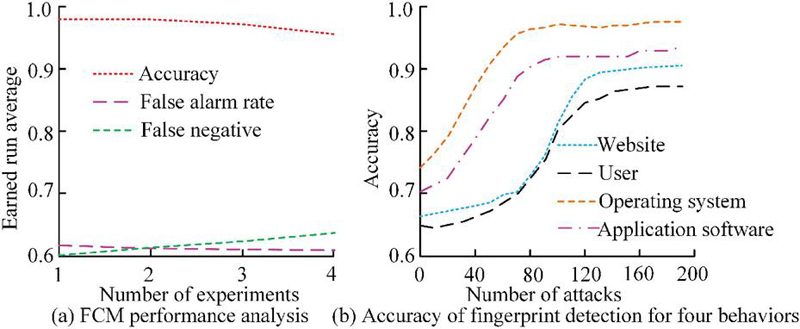
Figure 8 Verification of FCM clustering algorithm and accuracy of fingerprint detection for four behaviors.
From Figure 8, the detection and recognition accuracy of the FCM clustering algorithm remained around 89% in the four experiments. In addition, among the four behavioral fingerprint detection methods, the highest accuracy could reach 97.5%. Overall, the FCM clustering algorithm had high performance in normal behavior detection. On this basis, the study aimed to identify fingerprints of different operating systems and clients using the FCM algorithm, and compared the consistency of user behavior. The results are shown in Table 1.
Table 1 Comparison of detection proportion and user behavior consistency between operating systems and browsers
| Operating system | |||||||
| Windows | MacOS | Linux | Unix | Android | iOS | Others | |
| Proportion | 30.3% | 8.3% | 1.5% | 0.1% | 46.9% | 12.6% | 0.3% |
| PC end | |||||||
| – | IE | Chrome | FireFox | Safari | 360 | Others | |
| Proportion | 31.8% | 30.0% | 15.0% | 8.1% | 3.8% | 1.4% | 9.9% |
| Mobile terminal | |||||||
| – | Chrome | Safari | UC | Vivo | Oppo | Others | |
| Proportion | 30.6% | 20.2% | 15.2% | 13.3% | 5.85 | 5.3% | 9.6% |
| User consistency comparison | |||||||
| – | 0 | 500 | 1000 | 1500 | 2000 | 2500 | 3000 |
| 80% | 98.9% | 90.0% | 20.0% | 2.5% | 0.0% | 0.0% | 0.0% |
| 50% | 98.9% | 97.1% | 85.0% | 37.1% | 2.5% | 0.0% | 0.0% |
| 30% | 98.9% | 98.0% | 97.5% | 85.0% | 50.0% | 11.2% | 8.2% |
From Table 1, the mobile Android system had the highest proportion, reaching 46.9%, while the personal computer web browser had the highest proportion, reaching 31.8%. In addition, in the comparison of user behavior consistency, accuracy over 80% accounted for 1/6, and accuracy over 50% accounted for 1/3. Overall, the FCM algorithm effectively detected abnormal behavior in behavioral fingerprints with high accuracy. From this, in detecting normal network behavior, the FCM algorithm had a better ability to detect fingerprints than other algorithms. The FCM algorithm improved the detection ability of abnormal attack behavior by clustering and analyzing fingerprint spectra. This result is similar to the findings of Li et al.’s study on an automatic pattern DDoS attack detection method based on FCM [22]. Finally, performance analysis was conducted on the constructed active defense architecture in practical applications. The computer configuration used in the experiment is Intel §CoreTM i5-14600K CPU. It has 8 cores at 2.1GHz, 16GB of memory, and 2T hard drive. In terms of evaluation indicators, DNS query data, abnormal traffic data, and defense accuracy are selected as evaluation indicators. Abnormal traffic data refers to traffic patterns that are significantly different from normal network behavior, and monitoring abnormal traffic can help detect potential attack behavior. DNS query data can identify abnormal network access patterns, such as frequent access to suspicious domain names, which may indicate a malicious attack behavior. The defense accuracy represents the accuracy of the security system in identifying and blocking threats. JD, Tmall, Taobao, and accompanying software were selected as the analysis objects for network attack behavior defense. The results are shown in Figure 9.
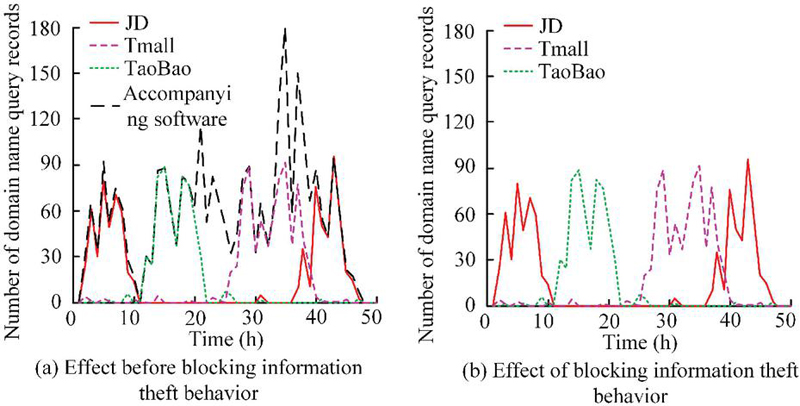
Figure 9 Defense results for network attack behavior.
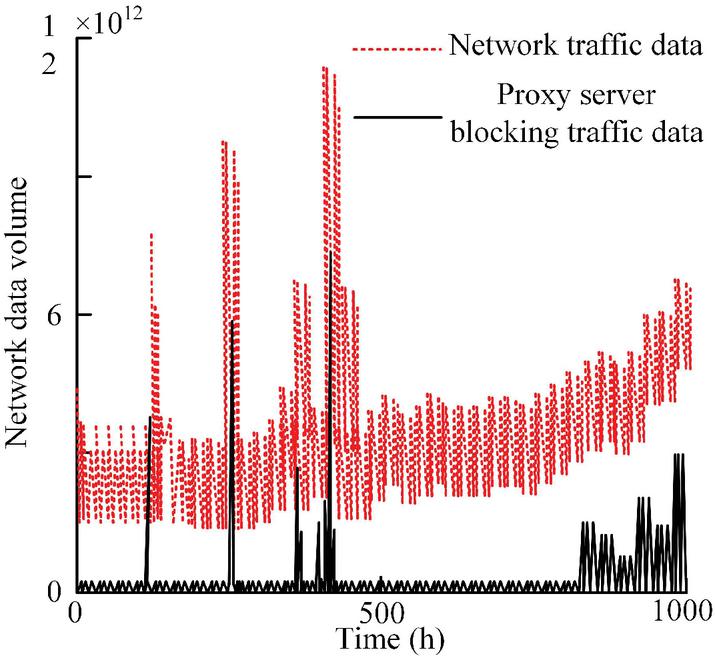
Figure 10 Proxy server blocking results in active defense architecture.
From Figure 9, after taking active defense measures, the accompanying software of the three platforms was blocked, while the actual query records of domain names were not significantly affected. Overall, the active defense architecture was effective in preventing network attack behavior, effectively blocking the behavior of information theft. The proxy server blocking results in the active defense architecture are shown in Figure 10.
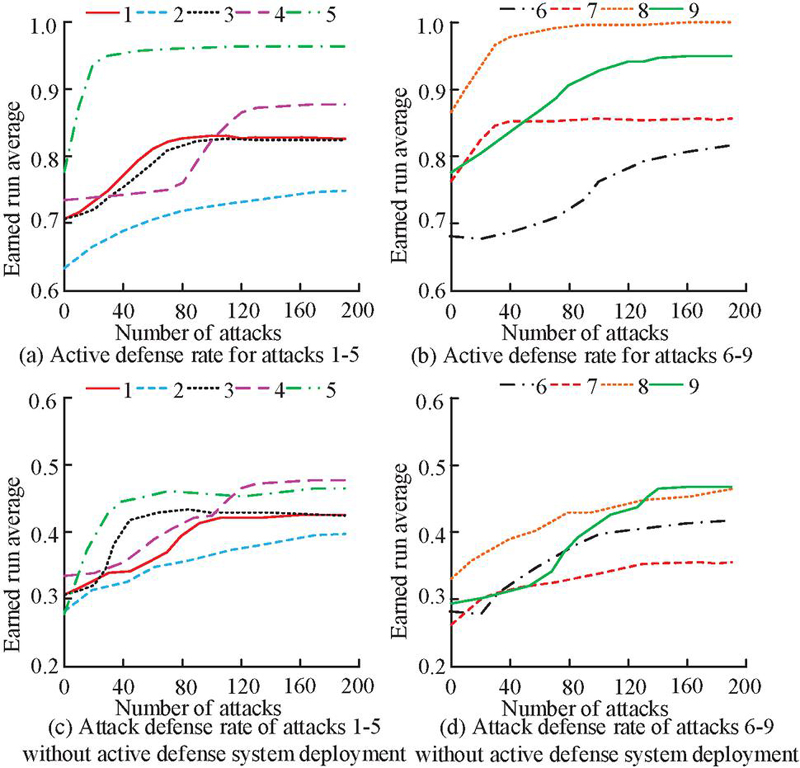
Figure 11 Active defense effect under the linkage of intelligent DNS and honeypot.
From Figure 10, the intelligent DNS server directed abnormal traffic to the proxy server, which blocked the abnormal sudden attack traffic from entering the honeypot network, and the remaining was normal traffic. Overall, the active defense effect of proxy servers was relatively obvious and effective in blocking traffic data. Finally, the active defense effect under the linkage of intelligent DNS and honeypot is shown in Figure 11.
Based on Figure 11, different attack methods had different defense effects, with some reaching 98% and others only reaching around 76%. DNS features were not obvious. The reason for the low accuracy of some defenses is that this type of attack contains complex dynamic feature changes. This highly complex and automated attack increases the difficulty of detection. Overall, the active defense results were basically consistent with the detection results in Figures 5 and 7, and the overall defense effect was good. According to Figures 11(c) and 11(d), without deploying an active defense system, the average defense accuracy for detecting 1–9 types of attacks was about 39%. The results showed that after deploying the security defense system, the defense accuracy improved by about 46%, effectively enhancing the effectiveness of proactive defense against network attacks.
In response to the problem of frequent bypass deployment and weak defense capabilities in actual environments due to the large processing capacity of current security defense technologies, a proactive defense architecture was proposed based on diverse features and knowledge graphs. Firstly, the collected log data is transformed into a structured graph, and entities and relationships are constructed into a graph structure. Then, the knowledge graph is further enriched by association analysis, behavior analysis, and anomaly analysis, and the abnormal behavior is found. Finally, by analyzing the complex relationship between entities, the potential attack chain is found, and effective countermeasures such as blocking are taken. Through continuous learning and feedback, the knowledge graph can become smarter and improve its ability to detect threats. The experimental results showed that in the analysis of network malicious attack behavior, the FHM algorithm had an FP and false alarm rate of 5.1% and 4.7% in virus programs, as well as 5.2% and 6.8% in phishing software programs. In zombie software, it was 3.5% and 3.1%, and 3.1% and 3.9% in distributed denial of service attacks. In normal network behavior analysis, the detection and recognition accuracy of the FCM clustering algorithm was basically maintained at around 89%, and the highest false alarm rate was only 0.1%. In the overall analysis of the active defense architecture, different attack methods had different defense effects, with a maximum of 98%. Overall, the active defense architecture proposed in the study is practical and effective in detecting and defending malicious attack behavior and normal access behavior. Enterprises can deploy this system to monitor internal network traffic, detect abnormal behavior, and prevent data leaks and network attacks. In addition, cloud service providers can use this system to protect their customers’ data and applications, providing a more secure cloud environment. However, the algorithm selected in the study did not undergo adaptability analysis. The generalization ability of active defense architecture in different network environments needs to be verified. Therefore, adaptive optimization is necessary in the future, including using feature dimensionality reduction techniques, adjusting clustering parameters, adjusting anomaly detection thresholds, or combining other machine learning techniques to enhance the generalization ability of the defense architecture. In addition, collecting and analyzing large amounts of online data may involve privacy issues. It is necessary to ensure compliance with data protection regulations.
The research is supported by 2017 Jiangsu Education Informatization Project: Research on Building a New Lifelong Learning Platform in the Context of Internet+(20172075); 2018 The 13th Five Year Plan for Educational Science in Jiangsu Province: Research on Building Jiangsu Intelligent Lifelong Learning Service Platform in the “Internet+” Era (B-b/2018/01/33).
| Variable Parameter | Explanation |
| Overall rating of the dataset for the th behavior fingerprint | |
| The th behavior fingerprint | |
| The set of all users with non-zero fingerprint scores for the th behavior | |
| Number of users | |
| The rating of the th behavior fingerprint by the th user | |
| Data set | |
| Correction of cosine similarity between users and | |
| Modified cosine similarity of behavioral fingerprints and | |
| A set of non-zero users | |
| A collection of behavioral fingerprints | |
| Individual user’s rating of a behavior fingerprint | |
| The average of all users’ non-zero fingerprints for a certain behavior | |
| A user’s fingerprint for a certain behavior is not equal to the average of all behavior fingerprints | |
| Loss function of user relations | |
| Loss function of behavioral fingerprint | |
| Loss function of user fingerprint relationship | |
| User’s affiliation matrix | |
| The attribution matrix of behavioral fingerprints | |
| Attribution matrix of user and behavioral fingerprints | |
| The internal elements of | |
| The internal elements of | |
| The internal elements of | |
| Number of rows in the matrix | |
| Number of columns in a matrix | |
| The maximum value of | |
| The maximum value of | |
| binormal | |
| Real orthogonal matrix | |
| Matrix composed of identity matrix and , | |
| Cluster results | |
| Behavioral fingerprint rating | |
| Cluster points | |
| Internal elements of | |
| Internal elements of | |
| Euclidean distance | |
| Membership factor | |
| Number of clustering category information | |
| Conditional probability | |
| The corresponding value of | |
| Current state | |
| Previous state | |
| migration probability | |
| FHM transfer matrix | |
| The status of the previous attack behavior | |
| The current state of the attack behavior | |
| Aggressive behavior | |
| The probability of the initial state at time being taken as the entrance state | |
| Observation probability of state as the output of the exit state | |
| Joint probability | |
| Variable set 1 | |
| Variable set 2 | |
| Weight of Attack Behavior | |
| Negative feedback parameters of aggressive behavior | |
| Intermediate node set | |
| Frequency of domain name occurrence in log files | |
| Internal elements of | |
| Aggressive behavior | |
| Domain frequency corresponding to attack behavior | |
| Attack distribution ratio | |
| Dirichlet parameter | |
| Number of log files | |
| The maximum value of | |
| Number of attack behaviors | |
| The maximum value of | |
| Number of Domain Names | |
| The maximum value of | |
| Maximum log likelihood value | |
| Using Gibbs sampling to obtain approximate values | |
| Gibbs sampling |
[1] Islam A, Othman F, Sakib N, Babu H M H. Prevention of Shoulder-Surfing Attack Using Shifting Condition with the Digraph Substitution Rules//Artificial Intelligence and Applications. 2023, 1(1): 58–68.
[2] Kumar R, Kela R, Singh S, Trujillo-Rasua R. APT attacks on industrial control systems: A tale of three incidents. International Journal of Critical Infrastructure Protection, 2022, 37(1):1–11.
[3] Sarker I H, Khan A I, Abushark Y B, Alsolami F. Internet of things (iot) security intelligence: a comprehensive overview, machine learning solutions and research directions. Mobile Networks and Applications, 2023, 28(1): 296–312.
[4] Panahnejad M, Mirabi M. APT-Dt-KC: advanced persistent threat detection based on kill-chain model. The Journal of Supercomputing, 2022, 78(6):8644–8677.
[5] Mohammadi E, Alizadeh M, Asgarimoghaddam M, Wang X, Simões M G. A review on application of artificial intelligence techniques in microgrids. IEEE Journal of Emerging and Selected Topics in Industrial Electronics, 2022, 3(4): 878–890.
[6] Garg H, Sharma B, Shekhar S, Agarwal R. Spoofing detection system for e-health digital twin using EfficientNet Convolution Neural Network. Multimedia Tools and Applications, 2022, 81(19): 26873–26888.
[7] Jakka G, Yathiraju N, Ansari M F. Artificial Intelligence in Terms of Spotting Malware and Delivering Cyber Risk Management. Journal of Positive School Psychology, 2022, 6(3): 6156–6165.
[8] Zhao M, Gao H, Wei G, Wei C, Guo Y. Model for network security service provider selection with probabilistic uncertain linguistic TODIM method based on prospect theory. Technological and Economic Development of Economy, 2022, 28(3): 638–654.
[9] Ullah M U, Hassan A, Asif M, Farooq M S, Saleem M. Intelligent Intrusion Detection System for Apache Web Server Empowered with Machine Learning Approaches. International Journal of Computational and Innovative Sciences, 2022, 1(1): 21–27.
[10] Cvitić I, Peraković D, Periša M, Jurcut A D. Methodology for detecting cyber intrusions in e-learning systems during COVID-19 pandemic. Mobile networks and applications, 2023, 28(1): 231–242.
[11] Saheed Y K, Abiodun A I, Misra S, Holone, M K, Colomo-Palacios, R. A machine learning-based intrusion detection for detecting internet of things network attacks. Alexandria Engineering Journal, 2022, 61(12): 9395–9409.
[12] Li S, Qin D, Wu X, Li J, Li B, Han W. False alert detection based on deep learning and machine learning. International Journal on Semantic Web and Information Systems (IJSWIS), 2022, 18(1): 1–21.
[13] Mehedi S T, Anwar A, Rahman Z, Ahmed K, Islam R. Dependable intrusion detection system for IoT: A deep transfer learning based approach. IEEE Transactions on Industrial Informatics, 2022, 19(1): 1006–1017.
[14] Dwivedi S, Vardhan M, Tripathi S. Defense against distributed DoS attack detection by using intelligent evolutionary algorithm. International Journal of Computers and Applications, 2022, 44(3): 219–229.
[15] Sun N, Lin G, Qiu J, Rimba P. Near real-time twitter spam detection with machine learning techniques. International Journal of Computers and Applications, 2022, 44(4): 338–348.
[16] Tedyyana A, Ghazali O, Purbo O W. A real-time hypertext transfer protocol intrusion detection system on web server. TELKOMNIKA (Telecommunication Computing Electronics and Control), 2023, 21(3): 566–573.
[17] Wagan S A, Koo J, Siddiqui I F, Qureshi, N M F, Attique M, Shin D R. A fuzzy-based duo-secure multi-modal framework for IoMT anomaly detection. Journal of King Saud University-Computer and Information Sciences, 2023, 35(1): 131–144.
[18] Zhu Y, Yan W Q. Traffic sign recognition based on deep learning. Multimedia Tools and Applications, 2022, 81(13): 17779–17791.
[19] Lyu M, Gharakheili H H, Sivaraman V. A survey on DNS encryption: Current development, malware misuse, and inference techniques. ACM Computing Surveys, 2022, 55(8): 1–28.
[20] He C H, Amer T S, Tian D, Abolila A F, Galal A A. Controlling the kinematics of a spring-pendulum system using an energy harvesting device. Journal of Low Frequency Noise, Vibration and Active Control, 2022, 41(3): 1234–1257.
[21] Kao H, Nguyen T T, Shieh C S, Horng, M F, Xian L Y, Miu D. Unknown DDoS Attack Detection Using Open-Set Recognition Technology and Fuzzy C-Means Clustering. Genetic and Evolutionary Computing, 2023, 1(2): 366–380.
[22] Li X, Fan Z, Xiao Y, Xu Q, Zhu W. Improved automated graph and FCM based DDoS attack detection mechanism in software defined networks. Journal of Internet Technology, 2019, 20(7): 2117–2127.
Journal of Cyber Security and Mobility, Vol. 14_2, 339–364.
doi: 10.13052/jcsm2245-1439.1424
© 2025 River Publishers