Partially Observable Stochastic Game for Analysing Complex Attacks in IoT Networks
Lamia Hamza1,*, Mayliss Yousfi2 and Lynda Bounehar2
1Laboratory of Medical Informatics (LIMED), Faculty of Exact Sciences, University of Bejaia, 06000 Bejaia, Algeria
2Faculty of Exact Sciences, University of Bejaia, 06000 Bejaia, Algeria
E-mail: lamia.hamza@univ-bejaia.dz; mayliss.yousfi@se.univ-bejaia.dz; lynda.bounehar@se.univ-bejaia.dz
*Corresponding Author
Abstract
The Internet of Things (IoT) has transformed interactions with the world around us. This technology encompasses a network of connected physical devices often vulnerable to attack. Recently, with billions of devices connected, protecting sensitive data and preventing cyber-attacks are becoming more and more paramount. In this paper, a new technique is proposed to enable the administrator to be aware of the various vulnerabilities threatening his system and to choose the most appropriate remediation method based on his cost constraints. This solution adapts to the specific needs of IoT networks. The approach, AGA-POSG, consists of transforming an IoT network security problem into a finite two-player Partially Observable Stochastic Game (POSG) and extracting the best strategies by Analysing an Attack Graph (AGA). To obtain a good solution, the game is presented in normal form, and the method of eliminating dominated strategies is used to determine the best defense strategies. Efficient security measures were implemented to eliminate or mitigate identified attack paths with costs incurred in the attack graph to the target for each of the two players.
Keywords: Internet of Things, vulnerability, attack graph, game theory, partially observable stochastic game.
1 Introduction
New challenges to the ubiquitous computing age are brought by the IoT. The accessibility of everything in all places has profited the malicious. As never before, being connected is identical to being defenseless. Discovering the good equilibrium between protecting mechanisms and intelligent objects, is problematic at best. Ensuring security within IoT is difficult especially since attackers are becoming increasingly sophisticated and developing complex attacks which are represented in the literature by attacks graph. An attack graph determines all the privileges and access controls acquired by the attacker by exploiting existing vulnerabilities in a network and listing the possible attack paths that damage the security of computer networks. Most researchers have concentrated on generating attack graphs [1, 2, 3, 4], but only a few have given attention to their analysis. Attack graph analysis is crucial for computer security, as it helps reveal vulnerabilities that could compromise the system. Therefore, the analysis of attack graphs helps to understand possible attack scenarios and identify the protective measures to be put in place to prevent or mitigate security risks. The current security solutions are mainly the result of manual analyses and ad-hoc approaches. Unfortunately, these solutions are no longer adequate, because any security attack can have considerable consequences. Therefore, there is a need for formal modeling of attackers and defenders. However, the dynamic and uncertain nature of IoT requires a specific formal modelization to obtain an effective analysis. In this paper, an innovative analysis method based on POSG (Partially Observable Stochastic Game) was developed. This method allows defenders to take the uncertainty into account and model the different possibilities of attacker actions and the corresponding outcomes. To propose an optimal defense strategy against malicious attacks, the security problem was transformed into a partially observable finite two-player, non-cooperative, zero-sum stochastic game. This game was represented in normal form, allowing the utilization of game theory resolution methods, particularly the elimination of dominated strategies. Using this approach, the costs of the different possible paths in the attack graph to the target were calculated. The cost is intricately correlated with the extent to which vulnerabilities are eliminated through reconfiguration of network security. Our approach provides the administrator with a range of costs that can determine which vulnerability to eliminate for his network at the lowest possible expense. The numbers or values associated with these costs are related to the degree of vulnerability risk. For this, paths with low costs were identified, and appropriate security measures were taken to eliminate or reduce them. The applicability of this approach was demonstrated through an evaluation of an example of an attack graph in the IoT context. The results showed that the method reduces vulnerabilities in an IoT environment.
The main contribution of this article is to design the following.
• The transforming of IoT network security problem into a finite two-player stochastic partially observable game (POSG).
• The use of eliminating dominated strategies to determine the best defense strategies in the IoT context.
• The association of costs to attack paths. These costs enable the administrator to reinforce the IoT network efficiently.
The remainder of this paper is organized as follows. Section 2 reviews related works. Section 3 presents the Background. Section 4 introduces the approach, which transforms an IoT network security problem into a stochastic partially observable game to extract the best strategies for analyzing an attack graph. The technique is illustrated through the case study depicted in Section 5. Section 6 expresses conclusions and some perspectives for future research.
2 Related Work
The analysis of attack graphs is not a new idea, according to authors Patil [5], security analysis is a difficult task for most security administrators. The authors discussed the value of using attack graphs to identify potential network attacks. Analysis can be completed successfully using attack graphs, this enables the administrators to thoroughly evaluate the attack graphs to identify the areas of their system that are weak. However, the authors did not take IoT network constraints into account. Few studies were devoted to the analysis of attack graphs by game theory. The first work dates from 2005, Wei Lye and Wing [6] presented a method of game theory for the analysis of the security of computer networks. A multiple Nash equilibrium is calculated to know more about the attacker’s attack strategies. Other works [7, 8] have been carried out since then, but without taking IoT constraints into account. The IoT systems can spawn a very large number of devices which makes their analysis difficult, this specificity makes previous works of game theory on attack graph analysis not adaptable. Since 2019 the analysis of attack graphs in IoT networks has been the subject of some work. Anwar et al.[9] presented a game-theoretic method for cyber deception to protect vital nodes of computer networks. This approach is to insert honeypots to trick the attacker and identify vulnerabilities in the attack graph used in the military domain of IoBT (Internet of Battlefield Things). This approach is promising except that it depends on the existence of honeypots in the IoT Network. In the same year, Yagit et al. [10] examined IoT vulnerabilities and introduced a greedy algorithm, utilizing attack graphs for security. The algorithm targeted key vulnerabilities for removal, considering their impact and cost [13] within budget constraints. Nevertheless, the approach posed challenges in decision-making, overall optimization, and adapting to evolving threats. In 2022, Ma et al. [14] presented a method for evaluating the security of IoT devices based on attack graphs. The authors used Hidden Markov Modeling (HMM) to model the relationship between device states after obtaining the association relationship between device nodes. This method helps to better understand the complexity of the relationships between IoT devices. However, the authors didn’t suggest the vulnerabilities hardening. In the same year, Almazrouei and Magalingam [11] presented a penetration testing model comprising two key algorithms. The first algorithm generates attack paths for IoT devices using data from the network topology, node database, and vulnerabilities, thereby identifying sets of vulnerabilities and potential access points. Using the Common Vulnerability Scoring System (CVSS) [12], the security level of each device is assessed, while the second algorithm determines critical attack paths and essential nodes. However, this approach does not formally model the game theory.
Through these previous works, we recognize that the use of game theory for the analysis of attack graphs in IoT networks requires more work to have purely formal solutions. For this, the proposed approach involves transforming an IoT network security problem into a finite two-player Partially Observable Stochastic Game (POSG) and extracting the best strategies for each player. To achieve an optimal solution, the game is presented in normal form, and the method of eliminating dominated strategies is employed to determine the best defense and attack strategies. This method simplifies the problem by removing strategies that are inferior to others. Afterwards, the cost associated with each attack path is calculated to solve the attack graph analysis problem. This approach enables the evaluation of various attack paths and the hardening of an IoT network.
3 Preliminaries
In this section, three concepts related to the approach are outlined: POSG, elimination of dominated strategies, and Nash equilibrium.
3.1 Partially Observable Stochastic Game (POSG)
POSG between two players is a mathematical model used in game theory to model situations where several players interact in an uncertain and partially observable environment. A POSG is defined as a tuple of (, , , , , ) [9]:
Where;
• : is the set of players.
• : is a finite set of all possible states.
• : is the action space of the game.
• : is a finite set of observations.
• is a set of Markov state transition and observation probabilities. is the probability of transition to state and observation from state under the joint action .
• = , where . is the reward function for the defender and is the reward function for the attacker.
3.2 Elimination of Dominated Strategies
In any game, one player’s strategy “strictly/weakly” dominates another strategy if it is strictly/weakly superior, no matter what the other players do:
• A strategy is strictly dominated for player , if there is another strategy that is strictly better than any of the other players’ strategies.
• A strategy is weakly dominated for player , if there is another strategy that is at least as good whatever the strategies of the other players, and strictly better than at least one combination of strategies.
3.3 Nash Equilibrium
Nash equilibrium is a very important concept in game theory. It is a situation in which neither player wishes to modify his behavior given the behavior of the other, i.e. a situation in which neither player has any interest in deviating (alone) from the situation obtained.
4 Our Approach
Based on POSG, the approach presented here proposes a computer security model designed adapted to IoT networks. The proposed game takes place between two entities, the attacker and the administrator, which makes it a two-player game. Within the context of an IoT network, an intruder seeks to infiltrate the network to disrupt certain functionalities and cause as much damage as possible to satisfy its own needs. Such disruption manifests through a series of attacks. Conversely, the network administrator, for his part, tries to minimize losses and maximize gains by reacting to the attacks launched by the intruder. The administrator’s objective is therefore to protect the network by taking measures to counter the attacks and reduce the potential damage.
The main steps of this approach are summarized in Figure 1.
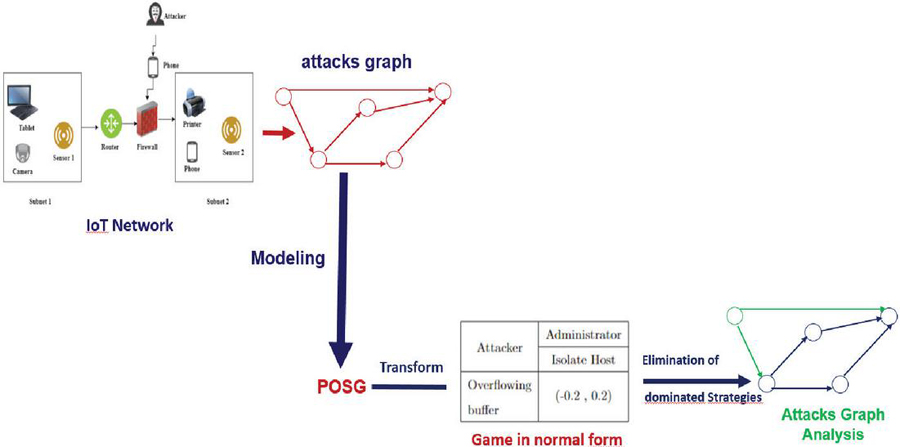
Figure 1 Proposed approach.
The game includes:
• Uncertainty is an inherent feature of IoT environments. Defenders often have only partial information about attackers’ actions and intentions, and the outcomes of actions may be subject to random factors.
• Non-cooperation due to the contradiction between the two players, one attacking and the other defending.
• Two players because there are two individuals, an IoT network administrator, and an attacker.
• Zero-sum, because the gains of one player represent the losses of the other.
• The game is finite because the strategies of the two players are finite.
After the step of game modeling, the game is represented in a normal form to apply Algorithm 1, enabling the elimination of dominated strategies. The principle of this algorithm is to simplify a game by gradually eliminating strategies that are dominated by others. Initially, each player retains all of their strategies. Then, non-dominated strategies are identified, meaning those not strictly dominated by others. At each iteration, dominated strategies are eliminated until no significant changes occur between iterations, indicating a stable state where no player can improve their outcome by changing strategy. This reflects a Nash equilibrium where no strategy is strictly dominated.
Algorithm 1 Algorithm of iterated elimination of dominated strategies
Step 1: ;
Step 2: {non-dominated strategies}, set of non-dominated strategies.
for to do
Step ,
end for
Step .
During the elimination step, the objective is to identify all paths containing vulnerabilities that need to be removed. To do this, the cost associated with each path is calculated, in order to determine which path can be eliminated, based on its minimum cost that allows to the administrator to select the most effective network reinforcement. The cost assessment is carried out by the formulas 1 that begin with the identification of the security risk, noted .
is calculated by the formula defined by Feng chen et al. [15]:
| (1) |
where:
To calculate the cost of each path, the formula 2 is defined:
| (2) |
Where:
5 Case Study
The Table 1 represents the devices of case study, their identifier, the level of risk associated with each vulnerability of a device, and the name of their vulnerabilities according to NVD(National Vulnerability Database) [16] and CVE(Common Vulnerabilities and Exposures) [17].
Table 1 Features, vulnerabilities, and risk levels of the example
| Device | CVE-ID | Name of the vulnerability | Level of risk | Type of vulnerability |
| IP Camera (V1) | CVE-2017-10796 | TP-Link NC 250 security vulnerability | low | authorization problem |
| sensor 1 (V3) | CVE-2002-0237 | Iss Black Ice Defender,Black ice Agent, Real Secure Serve Sensor Buffer Overflow. | high | Buffer overflow |
| sensor 2 (V2) | CVE-2018-14890 | Vectra Networks Cognito Brain and Sensor before 4.2 contains a cross-site scripting (XSS) | low | cross-site scripting (XSS) |
| Router (V4) | CVE-2017-14415 | D-Link DIR-850L REV A XSS. | medium | cross-site scripting (XSS) |
| Tablet (V5) | CVE-2018-18784 | ZZcms 8.3 SQL injection. | medium | SQL Injection |
| Printer (V6) | CVE-2002-0237 | Cyber Ark Viewfinity elevation of privilege via the ”add a printer ” | high | elevation of privilege |
| Phone (V7) | CVE-2022-47480 | Missing authorization. | medium | Vulnerability of denial of service service DoS |
Figure 2 presents an example of an IoT network. The Figure shows an IoT network consisting of a firewall and a router that separates subnetwork 1 from subnetwork 2. Subnetwork 1 contains a surveillance camera, a sensor 1 and a tablet. Subnetwork 2 contains a printer, a telephone and a sensor 2. We assume that the intruder’s aim is to access the sensitive information on the tablet.
5.1 Game Modelling
The model is defined as follows:
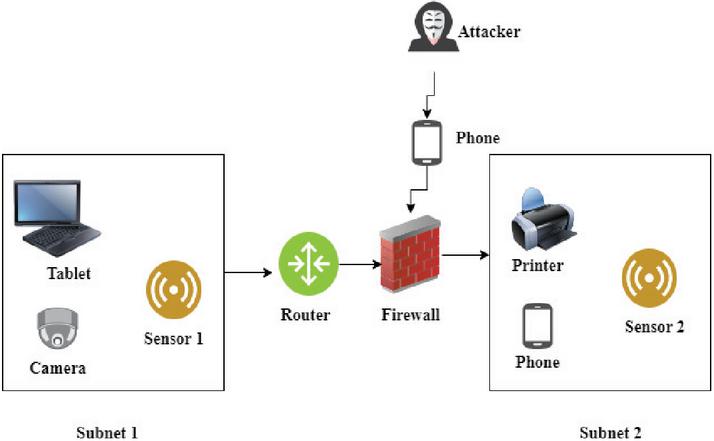
Figure 2 An example of an IoT network.
5.1.1 The players
The set of players is N = {Attacker; Administrator}.
5.1.2 The actions
The set of actions (strategies) , where represents the attacker’s strategies and represents the administrator’s strategies.
The intruder’s actions are: = {Buffer Overflow, Cross-Site Scripting (XSS), SQL Injection, Authorization Problem, Elevation of Privilege, Denial of Service (DoS)}
The administrator’s actions are: = {Generate Alarm, IP Blocking, Isolate Host, Kill Process, No defense}
5.1.3 The states
A set “S” describes the state of the system for each strategy played by either the attacker or the administrator. In our case, for each strategy played by both players, the possible states are: S = {,, , , , ,, }, where:
• : initial state.
• : attacker succeeds in exploiting the authorisation vulnerability on the camera.
• : attacker succeeds in exploiting the XSS vulnerability on sensor 2.
• : attacker succeeds in exploiting the buffer overflow vulnerability on sensor 1.
• : attacker successfully exploited the XSS vulnerability on the router.
• : attacker succeeds in performing an SQL injection on the tablet.
• : attacker succeeds in elevating privilege on the printer.
• : attacker succeeds in carrying out a DoS attack on the telephone.
5.1.4 The observations
In initial time , .
At time , when the attacker succeeds in an attack, becomes an empty set and becomes a set containing the element “successful attack”. On the other hand, in the case where the attack is detected, this implies that becomes an empty set and becomes a set containing “attack attempt detected”.
5.1.5 Probabilities of transition
The probability of transition can depend on several factors, such as the current state, the actions taken, the information available such as the existing vulnerabilities in each device. In our case, we were interested in the level of risk of each vulnerability listed in Table 1. Figure 3 presents the different state transitions.
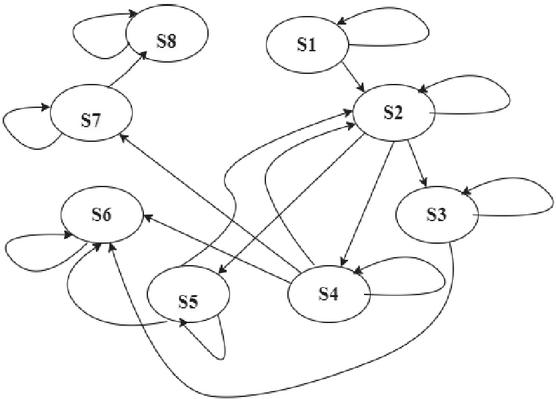
Figure 3 Graph of transitional states.
Two examples of transition probabilities are given below:
1. T(, Authorisation Problem, No defense,, , )= 0.2 This means that the probability of going from state to state if there is no defense against the authorisation problem is 0.2.
2. T(, Authorisation problem, Isolate Host, ,,)= 0.8 This means that the probability of remaining in state after isolating the host in response to the authorisation problem is 0.8 (for any administrator action except No defense).
5.1.6 Reward function
According to Anwar et al.[9] the reward function is defined in formula 3.
| (3) |
Where:
• : Coefficient of reward for the attacker when access to a device is successful.
• : Penalty coefficient for the attacker when access to a device is failed.
• I(condition): Indicator function that returns 1 if the condition is true and 0 otherwise.
• : Attacker action (player 1).
• : Action of the administrator (player 2).
• : Cost associated with the attacker’s action (player 1).
• : Cost associated with the administrator’s action (player 2).
For this case study represents the attacker’s reward function and is the administrator’s reward function. With: = .
Tables 2 and 3 present the opportunity costs associated with the actions s. These costs reflect the true cost of a decision, taking into account the available actions.
Table 2 Table of attack strategies
| (State, Attack strategies) | Costs |
| (s, Buffer Overflow) | 10 |
| (s, Cross-Site Scripting (XSS)) | 5 |
| (s, SQL Injection ) | 9 |
| (s, Authorisation Problem) | 6 |
| (s, Elevation of Privilege) | 8 |
| (s, Denial of Service (DoS)) | 7 |
Table 3 Table of defense strategies
| (State, defense strategies) | Costs |
| (s,Generate Alarm) | 8 |
| (s,IP Blocking) | 5 |
| (s,Isolate Host) | 10 |
| (s,Kill Process) | 4 |
| (s,No defense) | 0 |
To calculate , the values given in formula 3 are substituted for each combination of state (s) and action (a1, a2). Here is the calculation of for Buffer Overflow and Denial of Service (DoS) as an example; for the other attacks, the same principle is applied.
Buffer Overflow: (s, Buffer Overflow, Generate Alarm) (s, Buffer Overflow, IP Block) (s, Buffer Overflow, Isolate Host) (s, Buffer Overflow, Kill Process) (s, Buffer Overflow, No defense) =
Denial of Service (DoS): (s, Denial of Service (DoS), Generate Alarm) (s, DoS, IP Blocking) (s, DoS, Isolate Host) (s, DoS, Kill Process) (s, DoS, No defense)
5.2 Normal form game representation
Once the strategies of each player and the associated costs are known, the corresponding of the game in normal form is represented in Table 4:
Table 4 Normal form of the game
| Attacker | Administrator | ||||
| Generate Alarm | IP Blocking | Isolate Host | Kill Process | No defense | |
| Buffer Overflow | (1.8, -1.8) | (4.8, -4.8) | (-0.2, 0.2) | (5.8, -5.8) | (10.8, -10.8) |
| Cross-Site Scripting (XSS) | (-3.2, 3.2) | (-0.2, 0.2) | (-5.2, 5.2) | (0.8, -0.8) | (5.8, -5.8) |
| SQL Injection | (0.8, -0.8) | (3.8, -3.8) | (-1.2, 1.2) | (4.8, -4.8) | (9.8, -9.8) |
| Authorization Problem | (-2.2, 2.2) | (0.8, -0.8) | (-4.2, 4.2) | (1.8, -1.8) | (6.8, -6.8) |
| Elevation of Privilege | (-0.2, 0.2) | (2.8, -2.8) | (-2.2, 2.2) | (3.8, -3.8) | (8.8, -8.8) |
| Denial of Service (DoS) | (-1.2, 1.2) | (1.8, -1.8) | (-3.2, 3.2) | (2.8, -2.8) | (7.8, -7.8) |
5.3 Attack graph analysis
For the analysis phase, Algorithm 1 is applied to the example. Upon completion of the iterative process of eliminating dominated strategies, the set of non-dominated strategies is obtained. The game results within this set correspond to equilibria in non-dominated strategies.
5.3.1 Running of the iterated elimination algorithm for dominated strategies
By applying Algorithm 1, nine steps were obtained. To avoid overwhelming the article with tables, the course of the iterative elimination process of the dominated strategies for steps 1 and 9 has been briefly explained. The sequences of steps are represented in Figure 4.
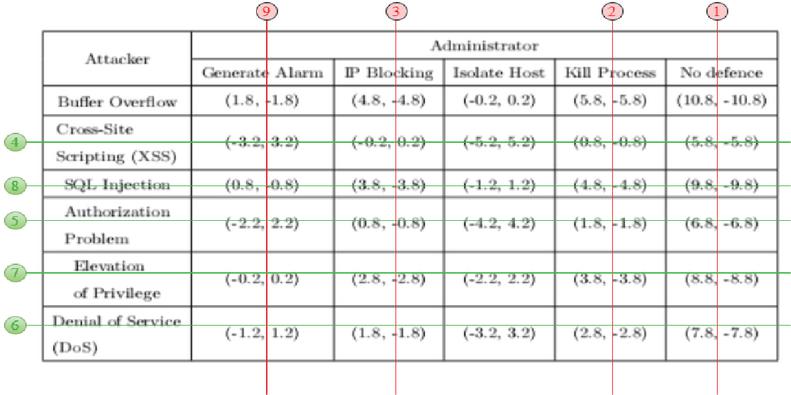
Figure 4 Normal form of the game after the iterative elimination of dominated strategies.
Step 1:
Let’s focus on the Kill Process and No defense columns from Table 4:
– If player 1 (attacker) plays Buffer Overflow, player 2 (administrator) has the choice between a gain of (-5.8) and a gain of (-10.8).
– If player 1 plays XSS, player 2 has the choice between a gain of (-0.8) and a gain of (-5.8).
– If Player 1 plays SQL Injection, Player 2 has the choice between a win of (-4.8) and a win of (-9.8).
– If Player 1 plays Authorization Problem, Player 2 has the choice between a win of (-1.8) and a win of (-6.8).
– If Player 1 plays Elevation of Privilege, Player 2 has the choice between a gain of (-3.8) and a gain of (-8.8).
– If Player 1 plays DoS, Player 2 has the choice between a win of (-2.8) and a win of (-7.8).
– Since , , , , and , then the column No defense can be removed, resulting in Table 5:
Table 5 Normal form obtained after elimination of the strategy No defense
| Attacker | Administrator | |||
| Generate Alarm | IP Blocking | Isolate Host | Kill Process | |
| Buffer Overflow | (1.8, -1.8) | (4.8, -4.8) | (-0.2, 0.2) | (5.8, -5.8) |
| Cross-Site Scripting (XSS) | (-3.2, 3.2) | (-0.2, 0.2) | (-5.2, 5.2) | (0.8, -0.8) |
| SQL Injection | (0.8, -0.8) | (3.8, -3.8) | (-1.2, 1.2) | (4.8, -4.8) |
| Authorization Problem | (-2.2, 2.2) | (0.8, -0.8) | (-4.2, 4.2) | (1.8, -1.8) |
| Elevation of Privilege | (-0.2, 0.2) | (2.8, -2.8) | (-2.2, 2.2) | (3.8, -3.8) |
| Denial of Service (DoS) | (-1.2, 1.2) | (1.8, -1.8) | (-3.2, 3.2) | (2.8, -2.8) |
Step 9: Focusing on the Generate Alarm and Isolate Host columns of the Table 5.
– If player 1 (attacker) plays Buffer Overflow player 2 (administrator) has the choice between a gain of (-1.8) and a gain of (0.2).
– Since , the column Generate Alarm can be deleted. This results in Table 6:
Table 6 Normal form obtained after elimination of the strategy Generate Alarm
| Attacker | Administrator |
| Isolate Host | |
| Buffer Overflow | (-0.2, 0.2) |
The results affirm the existence of a Nash equilibrium in this game. This equilibrium is defined by the strategic profile (Buffer Overflow, Isolate Host) = (-0.2, 0.2).
5.4 Cost of Paths
Figure 5 represents the attack graph which analyzed.
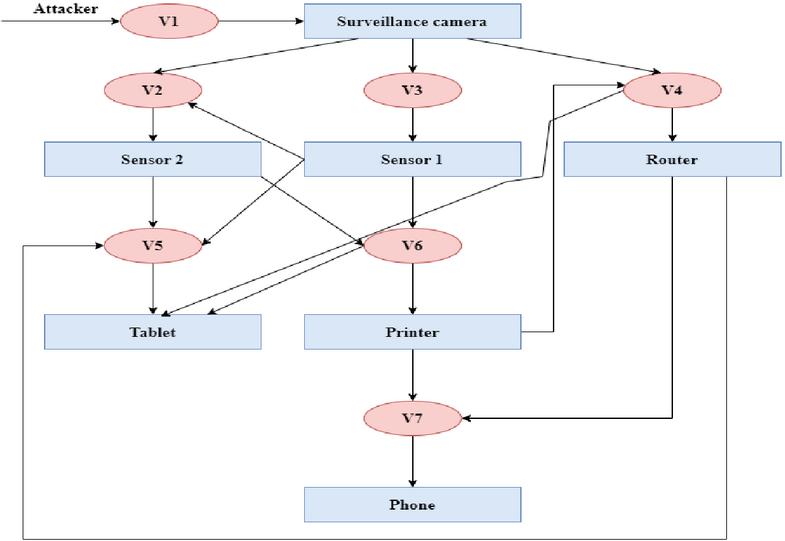
Figure 5 Attack graph corresponding to the studied network topology.
The rectangles of the Figure 5 represent the devices of the topology represented by Figure 2 and the circles represent the vulnerabilities associated with each device that the intruder uses as attack strategies.
Multiple attack paths are present, and attention is directed towards the paths leading to the target “tablet”. Following the order of elimination of the dominated strategies, the following paths were obtained:
The security risk is calculated from the formula defined in 1:
with : Table 7 presents the degree of each vulnerability :
Table 7 Table of degrees of each vulnerability
| Vulnerability | Number of linked arcs |
| Authorization Problem (V1) | 1 |
| Cross-Site Scripting (XSS) (V2) | 3 |
| Cross-Site Scripting (XSS) (V4) | 4 |
| SQL Injection (V5) | 4 |
| Elevation of Privilege (V6) | 4 |
| Denial of Service (DoS) (V7) | 3 |
Applying formula 2, yields:
Among the different paths to process, the most appropriate in this example are Path1, Path3, and Path5. Following the path costs, the decision is made to delete the first path (Path1). As a result, the V4 vulnerability will be eliminated, and the updated graph became as showing in the Figure 6.
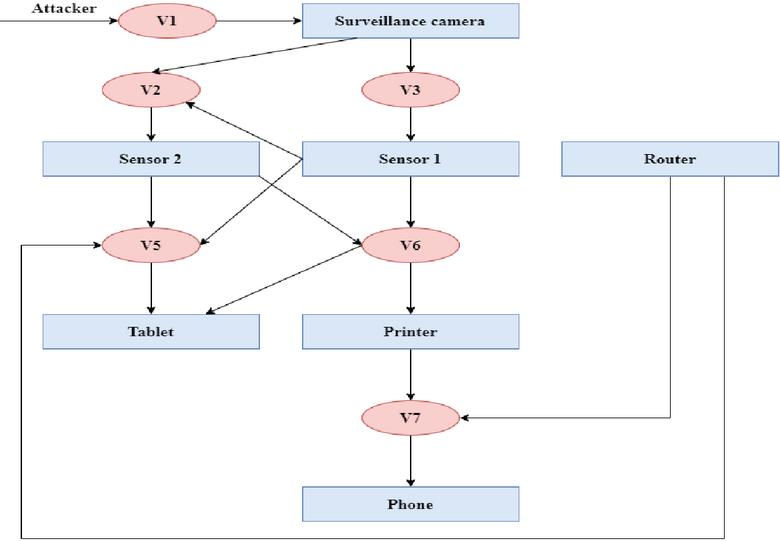
Figure 6 Attack graph after removal of V4.
Following the path costs the second path to be removed is (Path3), the vulnerability V6 will be discarded or patched, and the updated graph is shown in Figure 7.
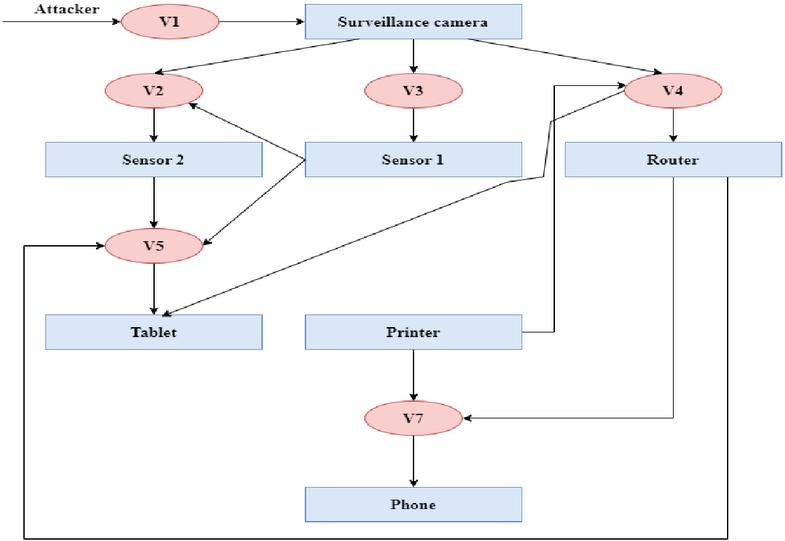
Figure 7 Attack graph after V6 deletion.
Following the path costs, another path to be removed is (Path5), the vulnerability V5 will be discarded or patched, and the updated graph is shown in Figure 8.
5.5 Evaluation
After analyzing the attack graph and removing the vulnerabilities present in paths 1, 3, and 5, an informed decision can be made about which vulnerabilities to address. Referring to Table 1 (Existence of vulnerabilities in the device), it is observed that V4 and V5 present a medium risk level, while V6 presents a high-risk level. It is preferable to remove the V4 vulnerability rather than the V5 and V6 vulnerabilities because it appears in several paths. By removing V4, the potential risk on multiple paths can be reduced, resulting in a more significant impact on the overall security of the IoT network. For the remaining vulnerabilities, namely V5 and V6, implementing security measures is recommended. For V5, limiting database privileges by only granting necessary privileges to database users is recommended. Avoiding the use of an account with administrative privileges for day-to-day operations can reduce the risk of SQL injection exploitation. In order to strengthen the security of V6, setting up monitoring and auditing mechanisms to detect abnormal activities is recommended. This can be achieved by monitoring printer event logs and using intrusion detection solutions. Furthermore, keeping the printer’s firewall up to date by regularly installing the latest versions provided by the manufacturer is essential. These firewall updates often contain critical security fixes. By implementing these adaptive security measures, the security of this IoT network is strengthened by addressing the potential risks associated with V5 and V6, while removing the V4 vulnerability for a more global impact.
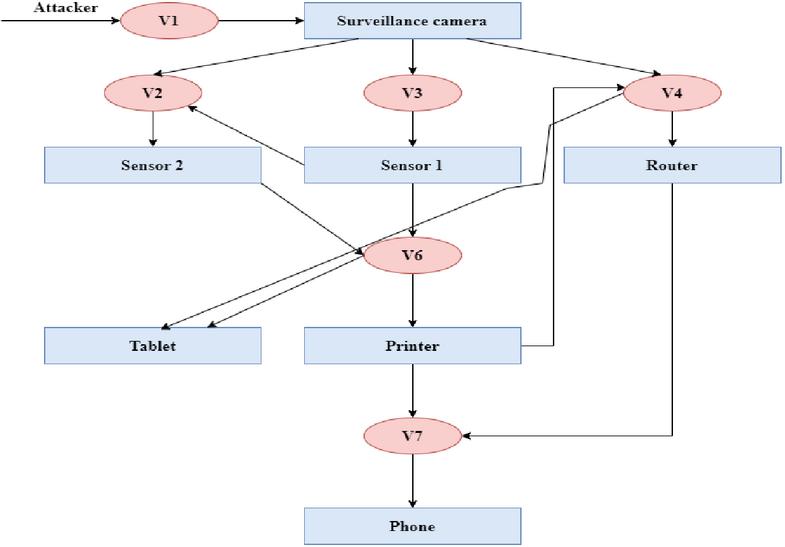
Figure 8 Attack graph after V5 removal.
6 Conclusion
In this paper, an innovative formal technique suitable for the analysis of attack graphs within IoT networks is introduced. The method involves a transformation process that converts a security problem in an IoT network into a finite two-player Partially Observable Stochastic Game (POSG), ultimately yielding optimized strategies for the two players involved. To obtain robust solutions, the game is represented in the normal form, and the iterative elimination of dominated strategies is employed to identify the most effective defense and attack strategies. Subsequently, all attack paths to the target are defined, and the associated costs are calculated, thus solving the complex challenge of analyzing attack graphs. This comprehensive framework enables the assessment of numerous feasible pathways thoroughly. For future work, a repetitive non-cooperative game between two players is envisioned, and the integration of machine learning could create sophisticated coping mechanisms evolving with emerging IoT threat trends.
References
[1] L. Hamza, Intruder model for generating attack scenarios in computer systems. International Journal of Information and Computer Security, num.(3–4), Vol.13, 2020.
[2] Ingols, K., Lippmann, R., & Piwowarski, K. (2006). Practical attack graph generation for network defense. In 22nd Annual Computer Security Applications Conference (ACSAC’06) (pp. 121–130). IEEE.
[3] Albanese, M., Jajodia, S., & Noel, S. (2012, June). Time-efficient and cost-effective network hardening using attack graphs. In IEEE/IFIP International Conference on Dependable Systems and Networks (DSN 2012) (pp. 1–12). IEEE.
[4] Noel, S. (2018). A review of graph approaches to network security analytics. From Database to Cyber Security: Essays Dedicated to Sushil Jajodia on the Occasion of His 70th Birthday, 300–323.
[5] Nilima, P., & Nitin, P. (2012). A comparative study of network vulnerability analysis using attack graph. World Journal of Science and Technology, vol. 2, Issue 3, p. 91.
[6] Lye, K. W., & Wing, J. M. (2005). Game strategies in network security. International Journal of Information Security, vol. 4, p. 71–86.
[7] Jiang, W., Zhang, H. L., Tian, Z. H., & Song, X. F. (2007, December). A game theoretic method for decision and analysis of the optimal active defense strategy. In 2007 International Conference on Computational Intelligence and Security (CIS 2007) (pp. 819–823). IEEE.
[8] K. Bouafia & L. Hamza, (2022), Game theory approach for analyzing attack graphs, International Journal of Information and Computer Security, Vol. 19(3–4), p. 305–320.
[9] Anwar, A. H., Kamhoua, C., & Leslie, N. (2019, November). A game-theoretic framework for dynamic cyber deception in internet of battlefield things. In Proceedings of the 16th EAI International Conference on Mobile and Ubiquitous Systems: Computing, Networking and Services (pp. 522–526).
[10] Yiğit, B., Gür, G., Alagöz, F., & Tellenbach, B. (2019). Cost-aware securing of IoT systems using attack graphs. Ad Hoc Networks, vol. 86, p. 23–35.
[11] Almazrouei, O., & Magalingam, P. (2022, October). The Internet of Things Network Penetration Testing Model Using Attack Graph Analysis. In 2022 International Symposium on Multidisciplinary Studies and Innovative Technologies (ISMSIT) (pp. 360–368). IEEE.
[12] Common Vulnerability Scoring System (CVSS), Retrieved from https://www.first.org/cvss/https://www.first.org/cvss/.
[13] Bair, N., Hamza, L., & Ouali, L. (2021, December). Costs Technique for Analysis Attacks Graphs in Computer Systems. In 2021 24th International Conference on Computer and Information Technology (ICCIT) (pp. 1-6). IEEE. DOI: 10.1109/ICCIT54785.2021.9689915.
[14] Ma, Y., Wu, Y., Yu, D., Ding, L., & Chen, Y. (2022). Vulnerability association evaluation of internet of thing devices based on attack graph. International Journal of Distributed Sensor Networks, vol. 18, no 5, p. 15501329221097817.
[15] Chen, F., Liu, D., Zhang, Y., & Su, J. (2010). A scalable approach to analyzing network security using compact attack graphs. Journal of Networks, vol. 5, no. 5, p. 543.
[16] National Vulnerability Database (NVD), Retrieved from https:/nvd.nist.gov.
[17] Common Vulnerabilities and Exposures (CVE), Retrieved from https://www.cve.org/.
Biographies

Lamia Hamza is an Associate Professor in the Department of Computer Science, University of Bejaia, Algeria; she is the Head of the Research Team for computer network security within the laboratory LIMED (Laboratoire d’Informatique MEDicale). She got his Accreditation to supervise (HDR), PhD, and Magister degrees from the University of Bejaia in 2020, 2018, and 2005, respectively. She received an engineering diploma in Computer Science from the University of Setif in 2003. Her research focuses on the automatic reinforcement of security policies using formal techniques, spam filtering based on Machine Learning, Blockchain, and intrusion detection in IoT and STI contexts.

Mayliss Yousfi received a Bachelor’s degree in Networks and Security from the University of Bejaia in 2021, where she developed a strong understanding of the theoretical and practical foundations of computer networks and system security. Fascinated by this ever-evolving field, she continued her studies and earned a Master’s degree in Networks and Security from the same university in 2023. She is currently looking to apply her specialized skills in rewarding professional environments.

Lynda Bounehar received her Bachelor’s degree in Network and Security from the University of Bejaia in 2021, followed by a Master’s degree in the same field in 2023. Currently, she is pursuing a Master’s in Applied Methods in Computer Science for Business Management at the University of Lille. This varied academic career reflects her commitment to deepening her knowledge of information technology, particularly in the context of corporate information systems. These studies enabled her to acquire essential skills in project management methods and to understand the strategic importance of IT within organizations.
Journal of Cyber Security and Mobility, Vol. 13_5, 1039–1060.
doi: 10.13052/jcsm2245-1439.13510
© 2024 River Publishers