Comparative Analysis of Popular Supervised Machine Learning Algorithms for Detecting Malicious Universal Resource Locators
Zambia Diko1 and Khulumani Sibanda2,*
1University of Fort Hare, Computer Science Department, Alice, 5700, Eastern Cape, South Africa
2Walter Sisulu University, Applied Informatics and mathematical Sciences department, Buffalo City Campus, East London, 5200, Eastern Cape, South Africa
E-mail: 201414058@ufh.ac.za; ksibanda@wsu.ac.za
*Corresponding Author
Received 25 April 2024; Accepted 06 June 2024
Abstract
Malicious Universal Resource Locators (URLs), also referred to as malicious websites have become a serious cause for concern for cyber security administrators of various organisations, institutions, Agencies, businesses and companies. These websites host malware, spam, drive by links and phishing. Unfortunately, Internet users worldwide visit such malicious sites and become the victims of cybercrimes like credit card credentials theft, theft of personal information, monetary savings or investments. Multitudes of researchers have embarked on attempts to design and implement response solutions to malicious URLs threat. The approaches are largely divided into two groups, the traditional approaches (Blacklising and Heuristics) and the data driven approaches (statistical methods, machine learning methods, data mining methods, and deep learning methods). In some instances, there are divergent views on which algorithm is the best to be used for building models. To our knowledge, there are still few works that have taken an initiative to comparatively analyse the performance of machine learning algorithms which have been identified by various authors as being the most suitable to use for building detection models. This study therefore focused on the Light Gradient Boost, Extreme Gradient Boost and the Random Forest algorithms. For the study’s experiments, a malicious URLs dataset was downloaded from Kaggle.com databases. The study’s results demonstrated that the hostname_length was the most important feature to focus on when building malicious URL detection models using the three above mentioned algorithms. The results also revealed two more features that had importance; the count_www and the count_dir, when using Extreme Gradient Boosting and the Random Forest. The study will in future explore hybrid models where advantages of various algorithms will be exploited to be combined in order to improve performance. Other models that will be considered include Support Vector Machine, Neural Networks and Deep learning models.
Keywords: Malicious universal resource locators, URLs, detection, random forest, RF, light gradient boosting, LightGBM, extreme gradient boosting, XGBoost, and supervised machine learning algorithms.
1 Introduction
Malicious Universal Resource Locators usually referred to as malicious websites, have become a cause for concern to all the Internet users worldwide. The concern is so much justified because of the negative effects that malicious websites have especially to businesses and governments entities. Malicious websites are used as a vehicle to transmit and spread cyber-attacks. Needless to say, cyber-attacks have serious consequences to any organisation or even to individual Internet users. There are numerous incidents that can be mentioned, for example, [1], states that in December 2023 hackers linked to Israeli infiltrated the Iranian gas website and managed to use compromised information to disrupt the operations of gas stations countrywide. Although that breach was quickly resolved, it took more than a day for payment systems to be restored. The same report [1], reveals that in July 2023, the New Zealand’s Parliament website was attacked and in the process, the New Zealand’s Parliamentary Counsel office’s website experienced Distributed Denial of Service (DDoS). In another report by [2], it was reported that 5.5 billion malware attacks were experienced worldwide in 2022. Although [2] did not segregate the attacks into the medium of attack proportions, it is common knowledge that most of the malware is distributed through websites and emails. The report further stated that most of those recorded malware affected the education sectors, with a weekly average of 2 314 attacks.
South Africa (where the researchers are based) has also not been spared from website attacks. Of all the cyber-attacks registered in South Africa in 2023, 23% involved Government websites [3]. The report indicated that 16% of those attacks were directed to businesses. In 2013, the website belonging to the South African Police Service, suffered a cyber-breach resulting to about 16 000 personal details of whistle blowers and victims of crime being exposed to the public [4]. Again in 2014, the South Africa mobile operator, Cell C’s portal was breached, an incident that exposed customer data to the public [4].
Most of the cyber-attack incidents reported whether worldwide or nationally, have been shown to have resulted from employees within such organisations, unknowingly having visited malicious websites or opened malicious emails while using their organisations’ cyber infrastructures. Reported malicious websites incidents and the resulting effects every year worldwide, is testimony to the impact that malicious websites have had and continue to have. In response to that catastrophe, researchers have continued designing and proposing models that are purposed to detect malicious websites. Literature has shown that a lot of such approaches have been proposed. These include the traditional detection techniques, for example, blacklisting and heuristic methods. Data driven type of technique is another approach that many researchers have proposed. The data driven techniques include statistical methods, machine learning methods, data mining methods, and deep learning methods [5]. It is not the intension of this study to discuss the full details of each of those approaches, however, more details about them can be found in [6–8].
There are now numerous malicious websites detection models that have been proposed as literature reveals. Section 2 briefly presents the related studies.
2 Related Works
Many researchers have investigated the application of machine learning algorithms in building models for detecting malicious URLs. [9] introduced a lightweight approach focusing on lexical features. The authors extracted 27 features but employed only 20 to streamline execution time and storage. Results indicated that the random forest classifier outperformed others with 99% accuracy. [10] proposed a solution utilising various machine learning techniques to detect malware presence in downloaded files. The study targeted malware types such as adware, Trojan, backdoors, unknown, multidrop, Rbot, spam, and ransomware. Five models, namely decision tree classifier, random forest classifier, gradient boosting model, XGBoost model, and the AdaBoost model, were compared. The random forest classifier demonstrated the highest accuracy, achieving 99.99%. [11] presented a study for malware detection using network parameters behaviour. The authors gathered malware examples from both the VirusShare and VirusTotal malware datasets, which cover a range of malware families. Their results indicated that the random forest (RF) model achieved the highest accuracy, reaching 97.5%, with a precision of 98.11%.
[12] introduced a real-time anti-phishing system employing seven classification algorithms (naive Bayes, random forest, kNN with n 3, Adaboost, K-star, SMO, and decision tree) alongside natural language processing (NLP)-based features. The authors conducted tests on a dataset comprising 73 575 URLs. Their findings revealed that the random forest algorithm, using only NLP-based features, achieved the highest performance, with a 97.98% accuracy rate in detecting phishing URLs. However, the model struggled to detect shorter URLs containing only a domain or subdomain.
[13] developed a convolutional gated-recurrent-unit (GRU) neural network for detecting malicious URLs, using characters as text classification features. The dataset comprised malicious URLs involving directory traversal, sensitive files, XSS, SQL injection, and other related web attacks. Experimental findings indicated that the model achieved an accuracy exceeding 99.6%.
[14] introduced combined linear and non-linear space transformation techniques in their study. The authors analysed a dataset of 33 162 URLs with 62 features to validate their feature engineering methods. The authors employed five different space transformation models, including singular value decomposition, distance metric learning, Nyström methods, DML-NYS, and NYS-DML to create new features that disentangled linear and non-linear interactions in malicious URL data. Their results showed significant enhanced performance of the k-nearest neighbour, the neural networks and the support vector machine. Notably, k-nearest neighbour’s identification accuracy for malicious URLs.
[15] proposed an approach that utilises multiple classifiers, leveraging ensemble learning, to predict the class probabilities of URLs. They then applied a threshold to filter the decisions of these classifiers. The authors used decision tree, random forest, naive Bayes, support vector machine, k-nearest neighbours, alongside ensemble learning techniques including soft voting and hard voting. They applied these methods to both datasets. The proposed approach outperformed all other available schemes.
[16] proposed the use of the Naïve Bayes and the J48 Decision Tree to detect website defacement. The authors trained their models using Weka software. Their findings revealed that their proposed approach was fairly accurate, reaching more than 93% accuracy.
[17] proposed a hybrid deep-learning technique called URLdeepDetect to analyse and categorise URLs in real-time to detect malicious ones. The proposed technique used semantic vector models and URL encryption, to detect malicious URLs. The study results revealed that the model attained accuracies of 98.3% and 99.7% using LSTM and k-means clustering, respectively.
Clearly, the related studies presented above encompass a broad spectrum of methodologies to detect malicious URLs and malware, reflecting the multifaceted nature of cybersecurity challenges. From lightweight lexical feature-based methods to sophisticated deep learning architectures, these studies demonstrate the effectiveness of various approaches in achieving high accuracy. Ensemble learning techniques, such as random forest and soft voting, emerge as powerful tools to improve detection accuracy by leveraging the strengths of multiple classifiers. Furthermore, advancements in feature engineering, behaviour-based analysis, and hybrid deep learning approaches highlight the ongoing efforts to enhance the robustness and efficiency of URL classification systems or models. While these studies collectively contribute to the literature by addressing different aspects of web security, most of them did not compare those various algorithms to objectively determine their suitability in building malicious URL detection models. Therefore, this paper focuses on comparing the performance of the supervised machine learning algorithms that are among the top algorithms that many researchers taunt as best performers. The rest of this paper is structured as follows: Section 3 presents the implementation of the three machine learning algorithms that are the focus of this study. Section 4 is the research design, Section 5 explains the environment in which the experiment was conducted. Section 6 is the model training discussion; the results of the study are presented in Section 7; the discussion of the study results is given in Section 8; Section 9 is the concluding remarks and the future work is presented in Section 10.
3 Machine Learning Algorithms USED
3.1 The Light Gradient Boost Algorithm
The Light Gradient Boost algorithm is a machine learning technique that is derived from the Gradient Boost algorithm. The Gradient Boost consists of a group of decision trees that are recursively trained using split data until no performance improvement is achieved by training it further. The Light Gradient Boost is an enhancement of the Gradient Boost, making it to have higher performance. It uses an automatic feature selection mechanism which gives it a boost in terms of detection performance [18]. In fact, it combines multiple of what is known as trained weak learners to form a single strong learner [19]. The algorithm achieves combining multiple week learners through minimizing the loss function. The loss function is represented as [18] Equation (1):
| (1) |
Where:
• is the loss function, which is a function of the model parameters
• y is the true label of the i training example.
• x is the feature vector of the i training example.
• f(x) is the predicted value of the model for the i training example.
• is the individual loss function for the i training example, where y is the true label, f(x) is the predicted value of the model, and are the model parameters.
• is the term for regularizing the function for the purpose of preventing overfitting.
• is the summation operator over all training examples.
The Light Gradient Boost algorithm is favoured by many researchers for handling classifications tasks, because of its ability to handle large datasets and for its shorter training times. The algorithm also uses less memory through replacing continuous values with the values that are discrete. In the next section the Extreme Gradient Boost algorithm is presented.
3.2 The Extreme Gradient Boost
The Extreme Gradient Boost is a machine learning algorithm that is derived from the Light Gradient Boost algorithm. It is well known for its high performance and its ability to deal with missing values [20]. Unlike the Light Gradient Boost which only minimises the loss function, the Extreme Gradient Boost achieves its high prediction accuracy through minimising both the loss function and the regularisation objective term. This algorithm can be represented by [21] Equation (2):
| (2) |
Where:
• the model parameters
• is the loss function (the difference between the predicted and the Actual)
• is the term that represents the losses for each individual sample.
• this term is the sum of the losses for each individual sample. The loss for each sample is calculated as the difference between the actual output y and the predicted output A.
• is the model’s complexity
• this is the loss function for a single base learner (i.e., the error between the predicted output and the actual output)
• this term is the sum of the losses for all base learners f. The loss for each base learner is calculated as the difference between the actual output and the predicted output.
The Extreme Gradient Boost is mainly preferred by researchers because it easily interfaces well with Python programming language that is used by many researchers. The algorithm allows parallel processing during model training and that makes its processing time to be faster and short. The other algorithm central to this study, the Random Forest is presented in the next section.
3.3 The Random Forest Algorithm
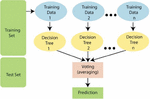
The Random forest is a supervised machine learning algorithm just like the Light Gradient Boost and the Extreme Gradient Boost algorithms. The algorithm can be used for many different tasks, but it is predominantly used for regression and classification tasks. For regression tasks, the algorithm computes its output through averaging the output of individual tree. If the task is a classification task like this study, the algorithm takes as its prediction the class voted or selected by most of the individual trees during training. Figure 1 shows how the Random Forest operates for a classification task.

Figure 1 Random Forest prediction process [22].
As shown in Figure 1, the algorithm randomly selects sample training data from the training set. Each time the training data is sampled, the algorithm constructs a decision tree. This process continues until a predefined n, where n is the number of trees to be constructed. The choice of n can differ from one study to another depending on a number of factors which include the number of rows in the dataset. However, experiments have shown that between 64 and 128 trees can strike a balance between training time and the performance measure for all thresholds of classifications [23]. Once n trees are reached, the final prediction becomes the most voted prediction.
4 Research Design
4.1 Collection of Data
The dataset used was downloaded from Kaggle.com databases. Initially, the dataset was in Excel spreadsheet format and consisted of four malicious URLs; phishing, malware, defacement and benign URLs. The dataset was loaded and saved to a database and exported to comma-separated files (.csv). Subsequently, this dataset consisted of two features and 651191 records. Since the dataset had few features, new features were added using URL analysis. As a result, the number of features increased to 19. The final dataset had 21 columns and 651,191 records.
4.2 Data pre-processing
4.2.1 Split of dataset
The dataset was split into two, in the ratio 0.2 to 0.8 of 651191 instances. The following Python function was used for splitting the dataset:

4.2.2 Dropping irrelevant columns
Dropping unwanted columns allowed us to first work with a smaller dataset that focused on achieving the research objective of this study. Non-numerical data was excluded because the study only required numerical data. Table 1 shows the dataset after the unwanted columns were removed.
Table 1 Dataset after column dropped

4.2.3 Handling imbalanced dataset
The dataset was extremely imbalanced, with far more benign class instances than the malicious class instances. A dataset with such extreme imbalance could eventually lead to an inaccurate and unfair model with a high false positive rate, so it had to be fixed. In this study, we used a stratification technique. This method prevents potential biases in model training, facilitates better generalization to unseen data, and ensures accuracy of evaluation metrics, especially when dealing with unbalanced class distributions. By reducing the risk of overfitting the majority class, improving model calibration and promoting overall model reliability, the stratification process significantly contributes to the creation of fair, unbiased and skillful machine learning models adapted to unbalanced datasets.
4.2.4 Category encoding
In general, data comes in two forms: numerical and categorical. Numerical data is expressed as numbers, while categorical data is organized into groups or categories, often labeled with text. Since machine learning models only understand numerical data, it was necessary to convert categorical data into numerical form in order to develop an effective model. The conversion process is called categorical encoding. The research used LabelEncoding technology. This method assigned a unique numerical identifier to each category, transforming the category data into a format more understandable to machine learning algorithms. Figure 2 shows the dataset after encoding.
Figure 2 Dataset after categorical encoding.
4.2.5 Feature selection
Feature selection is the process of selecting a subset of relevant features from a larger set of features to use in a machine learning model. The goal of feature selection was to improve model accuracy, interpretability, and efficiency by reducing the dimensionality of the data set and removing pale or redundant features. In this study, lexical features were used for feature selection. The importance of lexical features in URL analysis lies in their ability to capture attributes that indicate potential malicious activity. Machine learning models trained on enhanced datasets with relevant lexical features can effectively distinguish between benign and malicious URLs, improving threat detection in cyber security applications. After feature selection, all columns containing non-numerical data were excluded, which fulfilled the study’s requirement for a dataset containing numerical data. The most important verbal characteristics were the length of the URL, where malicious URLs can differ from the normal ones because they have an unusual length. Lexical analysis also included identifying suspicious keywords or patterns associated with malicious intent, such as related to phishing or malware. The presence of certain special characters or symbols in a URL can indicate possible malicious activity. Examining the structure of the domain, subdomains and URL paths helped uncover patterns commonly associated with malicious URLs. Moreover, character distribution analysis was informative, especially when certain characters were disproportionately represented in malicious URLs.
4.2.6 Shuffle dataset
Data shuffling is the random rearrangement of occurrences or rows of a data set. Shuffling is often used in machine learning to randomize the order of data points during training, testing, and validation to avoid introducing distortions or patterns into the data that can affect model performance. Therefore, the study dataset was randomly shuffled to obtain a random pattern dataset.
5 Environment
The study experiments were conducted on Ubuntu Terminal, HDD Model ST500LT012-1DG142, System BIOS Version V2.13, Acer laptop, Intel. ® Core i7-4500U CPU @ 1.8 GHz. Python 3.8.5 was used as the programming tool.
6 Model Training
The entire procedure was implemented in a Jupyter Notebook utilizing the Python programming language. The ’train()’ function was used to train the models. The ’predict()’ function played a crucial role in making predictions and classifying a new dataset using the trained models. It was employed to classify target names and generate a classification report. The ’predict()’ function was also utilized to apply the trained models to the test dataset.
7 Results
7.1 Feature Importance
It is important to prioritize features when building machine learning models. Ideally, feature importance in this study indicated the extent to which each feature would contribute to the prediction of malicious URLs. Feature importance was calculated for each classifier because each classifier has its own approach to prediction. Below are the feature importance results for each classifier.
7.1.1 Light Gradient Boosting feature importance results
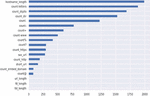
When calculating feature importance, Light Gradient Boosting calculated the partition gain, which measured the improvement of the model’s loss function by dividing the function. In addition, it looked at how many times each feature was used to share, indicating its importance. Furthermore, the classifier calculated a permutation mean, which measured the reduction in model performance when characteristic values were randomly mixed, and a Gini mean, which calculated the reduction in impurity achieved using the separation function. Figure 3 shows the feature importance ranked through the Light Gradient Boosting. As the Figure shows, the top 5 features ranked according to importance were: Hostname_length, Count_letters, Count_digits, Count_dir and Count_dots. There were other features that showed importance although to a lesser extent, as the figure shows, the count-, count=, count-www, count%, count?, count_https, sus_url, count_embed_domain and the count@.
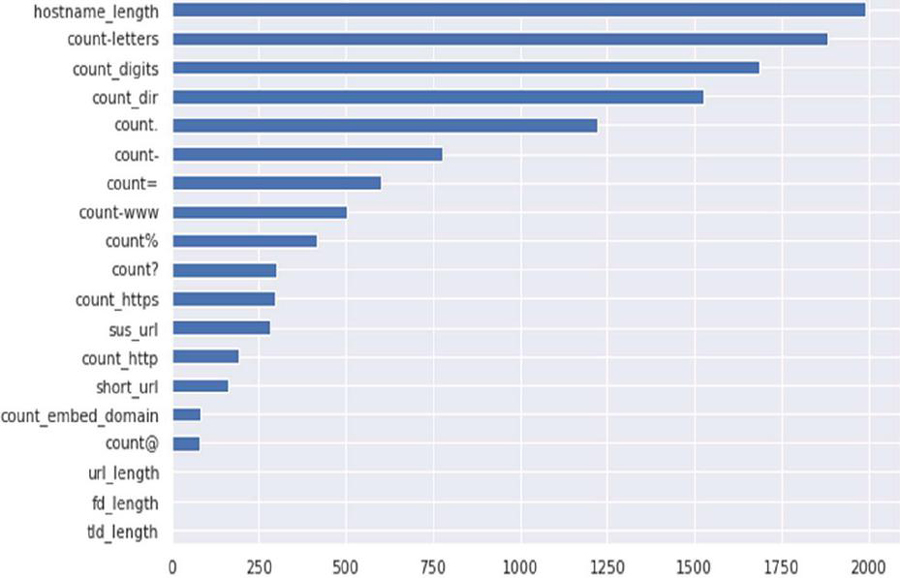
Figure 3 Light Gradient Boosting feature importance.
7.1.2 Extreme Gradient Boosting feature importance results
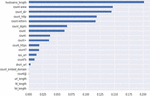
The feature importance calculated by XGBoost is based on the frequency and efficiency of the feature usage during the boosting process. More importance was given to features that were often used for partitioning and improving model performance. Considering the first five features in order of importance as show in Figure 4, they were: hostname_length, count-www, count_dir, count_http and count_letters. There were however more other features as the Figure shows, but with lessor importance than the 5 mentioned above.

Figure 4 Extreme Gradient Boosting feature importance.
7.1.3 Random forest feature importance results
Random Forest assigns an importance score to each feature based on how they affect the model’s predictions. Features with higher importance are considered more influential in the classification process. Figure 5 shows random Forest feature importance. It can be noted that the top five most important features were hostname_length, count_dir, count-www, count__http and count_letters. There were other features also that showed significant importance like the count_digits, count., count=, count- and so on as shown in the Figure.
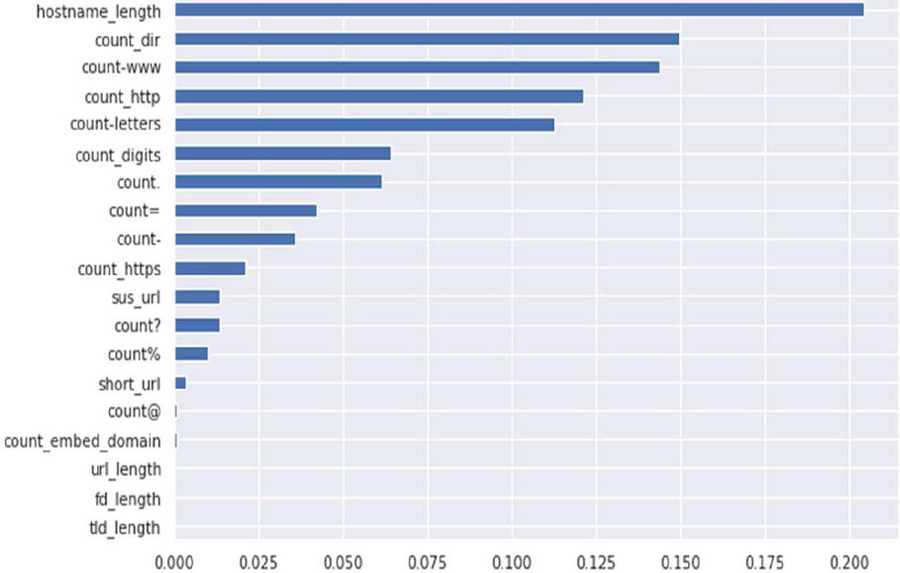
Figure 5 Random forest feature importance.
7.1.4 Top Five most important features for all the models
Table 2 shows the top five most important features for the three models. As can be seen in the table, the Hostname_length feature was ranked the most important feature in all the three models. At second level, each classifier had a different feature, while the count_www feature was ranked second in the XGB classifier, count_dir and Count_letters features ranked second in the RF and LGB respectively. The classifiers ranked the features differently in all other levels except for the XGB and RF classifiers which coincidentally ranked count_http and Count_letters features fourth and fifth.
Table 2 Top 5 feature importance for the three models
| # Model | XGB | RF | LGB |
| Leve:1 | Hostname_length | Hostname_length | Hostname_length |
| Leve :2 | Count_www | Count_dir | Count_letters |
| Leve :3 | Count_dir | Count_www | Count_digits |
| Leve :4 | Count_http | Count_http | Count_dir |
| Leve :5 | Count_letters | Count_letters | Count_dots |
7.2 Training and testing curves
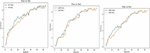
Figure 6 shows the models’ training and testing curves with increase in number of features. As the Figure shows, in all the models the test curves were very close to the train curves. Both curves gradually increased before slowing at 50 features and above for all the models. The closeness of the curves is a positive indication that the models were able to predict very well from the test dataset.
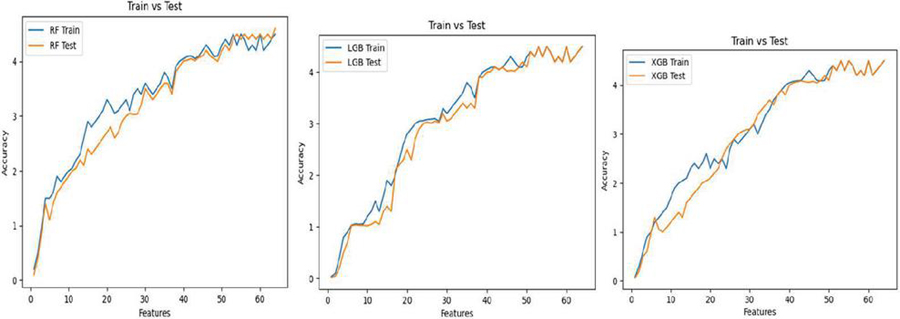
Figure 6 a) LGB Train and test curves b) XGB Train and test curves c) RF Train and test curves.
7.3 Confusion matrix
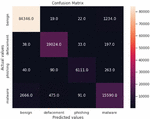
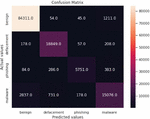
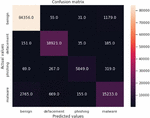
The confusion matrix is a widely used table in machine learning classification models. The table helps determine the effectiveness of the models in deriving predicted and actual values. In summary, the table consists of four combinations of predicted and actual values: true positive (TP), true negative (TN), true negative (TN), and false positive (FN). The study used the confusion matrix to determine the effectiveness of the models in classifying URLs. The results are shown in Figures 7, 8 and 9.
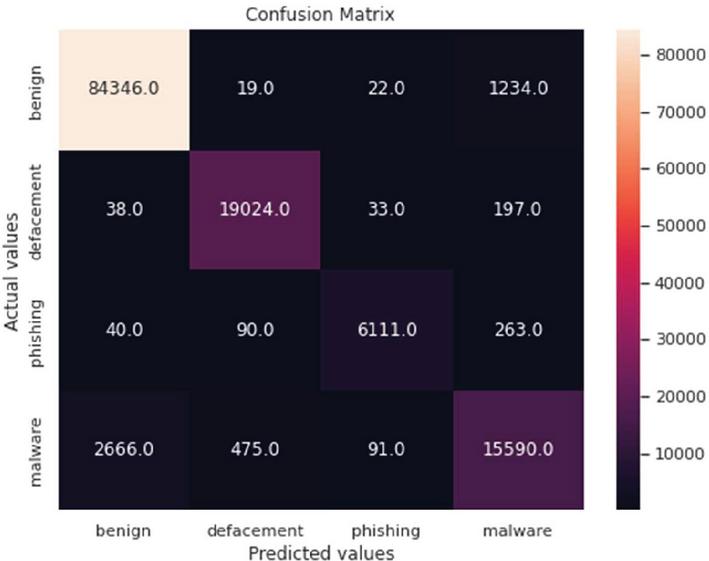
Figure 7 Light Gradient Boosting confusion matrix.
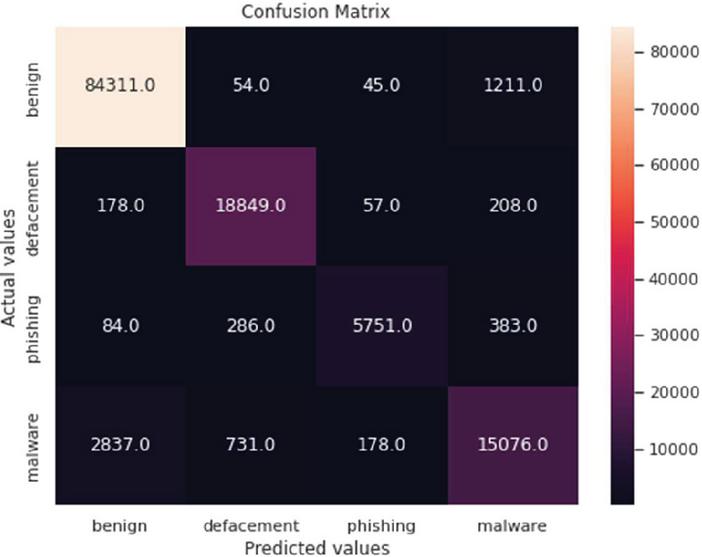
Figure 8 Extreme Gradient Boosting confusion matrix.
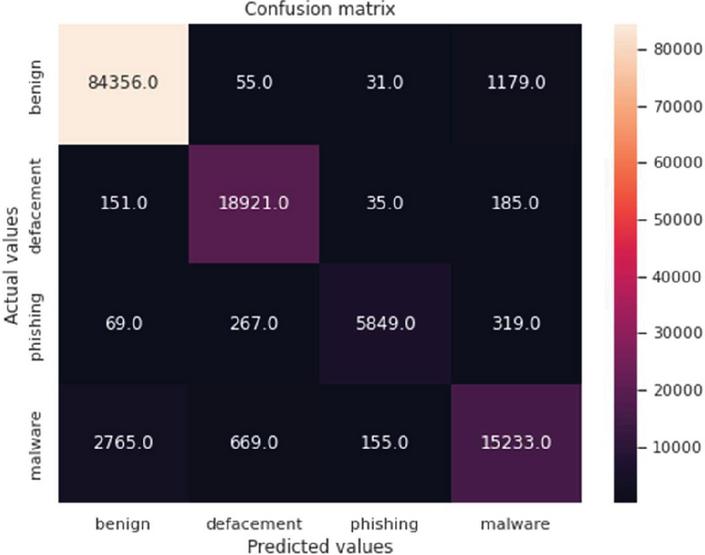
Figure 9 Random Forest confusion matrix.
Generally, the confusion matrices revealed that the samples were overwhelmingly correctly classified using all the three models. This is shown by the diagonals (with higher values) of each matrix. However, in all the models, the results showed that there was a clear high rate of failure in classifying malware URLs. For example, in Figure 7, 263, 197 and 1234 URLs were classified as malware yet they were actually phishing, defacement and benign respectively. Figure 8 shows that 383, 208 and 1211 URLs were also classified as malware, yet they were actually phishing, defacement and benign respectively. The same trend was noted in Figure 9.
7.4 Accuracy
The accuracy of the models showed the percentage of the correctly predicted malicious URLs by the models on the test data. As shown in Table 3, Random Forest produced the highest accuracy of 96% than the other two models, the Light Gradient Boosting and the Extreme Gradient Boosting which were tied at 95%. However, there was a very small difference among the three models’ accuracy.
Table 3 Accuracy of the models
7.5 Performance of the models
The accuracy metric in isolation is not sufficiently indicative of good model performance if the study used an imbalanced dataset. As alluded to in Section 4.2.3, this study used imbalanced dataset, for instance, the dataset contained overwhelmingly more Benign URLs than malicious URLs. For such a situation, it is very important to also use Precision, Recall and F1-Score metrics. The F1-Score served to indicate the overall model’s performance by harmonizing the Precision and the Recall measures thereby giving a more balanced result of true malicious URLs predicted and the accuracy in predicting those malicious URLs.
7.5.1 Models’ precision
Precision in this study showed the fraction of malicious URLs among all received URLs (or tested URLs). As shown in Table 4, Light Gradient Boosting, Extreme Gradient Boosting and Random Forest attained 96%, 97% and 97% precisions in detecting benign URLs respectively. This actually showed that the Extreme Gradient Boosting and the Random Forest models performed equally while the Light Gradient Boosting came behind the other two models in terms of precision when predicting benign URLs. For defacement prediction, the precisions were: 95%, 95% and 97% for the Light Gradient Boosting, Extreme Gradient Boosting and Random Forest respectively. As the results showed, the Light Gradient Boosting and Extreme Gradient Boosting performed equally in terms of precision on detecting defacement URLs. The Random Forest eclipsed the other two models in being more precise. In predicting phishing URLs, the three models showed different precisions. The Light Gradient Boosting attained 95%, the Extreme Gradient Boosting 96% and the Random Forest 98%. In this case, Random Forest clearly showed the ability of having greater precision in detecting phishing URLs. One of the prevalent malicious URLs comes in the form of malware. The results in Table 5, showed that Light Gradient Boosting, Extreme Gradient Boosting and Random Forest, attained 89%, 90% and 90% precision respectively. Again this showed equal performance in terms of precision between the Extreme Gradient Boosting and the Random Forest, but this time for malware detection.
| Machine Learning Models | |||
| Type of URLs | Light Gradient Boosting | Extreme Gradient Boosting | Random Forest |
| Benign | 0.96 | 0.97 | 0.97 |
| Defacement | 0.95 | 0.95 | 0.97 |
| Phishing | 0.95 | 0.96 | 0.98 |
| Malware | 0.89 | 0.90 | 0.90 |
7.5.2 Models’ recall
Recall in this study represented the fraction of all malicious URLs but this time, among the malicious URLs that were present in the dataset. Table 5 shows that the light gradient boosting, extreme gradient boosting and the random forest detected 98%, 99% and 99% benign URLs of the total number of the benign URLs present in the dataset respectively. Of the defacement URLs present in a dataset, the models showed prediction rates of 99% for the Random Forest and 98% for both Light Gradient Boosting and Extreme Gradient Boosting. Phishing URLs present in the dataset were detected at 88%, 90% and 94% by the Light Gradient Boosting, Extreme Gradient Boosting and Random Forest respectively. The three models, the Light Gradient Boosting, Extreme Gradient Boosting and the Random Forest predicted 80%, 81% and 83% of the malware URLs present in the dataset respectively.
| Machine Learning Models | |||
| Type of URLs | Light Gradient Boosting | Extreme Gradient Boosting | Random Forest |
| Benign | 0.98 | 0.99 | 0.99 |
| Defacement | 0.98 | 0.98 | 0.99 |
| Phishing | 0.88 | 0.90 | 0.94 |
| Malware | 0.80 | 0.81 | 0.83 |
7.5.3 Models’ F1-Score
The F1 score metric helps to determine the model’s ability to strike a balance between recall and precision. In this study this metric was used to measure the ability of the model to positively capture the target variable and do so precisely. The results shown in Table 6, showed that Light Gradient Boosting achieved detection rates of 97%, 96%, 92% and 84% for Benign, Defacement, Phishing and Malware URLs respectively. In the same order of the URLs types as stated above for light gradient boosting, the extreme gradient boosting achieved detection of 98%, 97%, 93% and 85% respectively. Lastly, the random forest achieved F1 score of 98% for benign, 98% for defacement, 96% for phishing and 86% for malware URLs.
| Machine Learning Models | |||
| Type of URLs | Light Gradient Boosting | Extreme Gradient Boosting | Random Forest |
| Benign | 0.97 | 0.98 | 0.98 |
| Defacement | 0.96 | 0.97 | 0.98 |
| Phishing | 0.92 | 0.93 | 0.96 |
| Malware | 0.84 | 0.85 | 0.86 |
8 Discussion
The purpose of this study was to compare the effectiveness of machine learning algorithms in detecting malicious Universal Resource Locators. In particular, the work focused on three algorithms; Light gradient boosting, Extreme gradient boosting and Random forest. The results of this comparative analysis demonstrate the effectiveness of various supervised machine learning algorithms in detecting malicious Universal Resource Locators (URLs). The findings suggest that the choice of algorithm can significantly impact the performance of the detection model. The results of the study showed that hostname_length was the most important feature to pay attention to when building malicious URL detection models using the three algorithms mentioned above. The results also showed two other features that were significant; count_www and count_dir, when using Extreme Gradient Boosting and Random Forest. In addition, the results showed that the functions count_letters and count_digits were also very important for the Light Gradient Boosting algorithm. When building machine learning models, it is very important to evaluate model precision, recall and F1 scores. These metrics show how the model is performing. The results of this study showed that Extreme Gradient Boosting and Random Forest had the same accuracy (97%) in identifying benign URLs. All three models proved to be very good at identifying malicious URLs in the dataset. The three models also showed good predictability for defacement and phishing URLs. All of them had an accuracy of over 87%. All three models achieved 80% or better accuracy when predicting malware. The recall results showed that all three models had good detection rates for the total number of true benign URLs in the dataset. As mentioned above, the F1 Score metric was used to balance accuracy and recall metrics. The results showed that the F1 scores of all three models were above 90% in detecting malicious URLs, naturally varying depending on the type of malicious URLs. However, the Random Tree Forest model was found to be the best model for detecting malicious URLs regardless of the type of malicious URL.
9 Conclusion
This study showed that among the three algorithms, Random Forest had higher accuracy, while Extreme Gradient Boosting and Light Gradient Boosting had the same accuracy. In particular, the F1 scores highlighted the Random Forest model as the best choice in different categories of malicious URLs. The results also showed that Extreme Gradient Boosting and Random Forest had similar accuracies in identifying benign URLs. All three models proved to be very good at identifying malicious URLs in the dataset. The three models also showed good predictability for phishing URLs. In addition, the results showed that all three models had a good detection rate for the total number of true benign URLs in the dataset. Overall, the study showed that the Random Forest model was the best model for detecting malicious URLs, regardless of the type of malicious URL. In conclusion, this study demonstrates the effectiveness of the three supervised machine learning algorithms for detecting malicious URLs. The choice of algorithm should be based on a careful consideration of factors such as computational cost, interpretability, and hyperparameter tuning requirements. Future research should focus on developing more robust and efficient algorithms for URL detection, as well as exploring new features and techniques that can improve the accuracy and reliability of malicious URL detection systems.
10 Future Work
The study opened up more opportunities to expand the research. First, the study may expand its dataset in the future to include other types of URLs, such as drive-by URLs and redirect URLs. Models developed in this way can keep pace with rapidly changing cyber threat trends. In addition, hybrid models in which the advantages of different algorithms are combined to improve performance will be investigated in the future. In summary, several avenues for future research are:
Hybrid approaches: Combining multiple machine learning algorithms or techniques may lead to improved performance and robustness.
Feature selection and engineering: Developing new features or techniques for extracting relevant information from URLs could improve the accuracy and reliability of malicious URL detection systems.
Anomaly detection: Developing algorithms that can detect unusual patterns or anomalies in URL behaviour may be effective in detecting previously unknown types of malicious URLs.
Evaluation metrics: Developing more robust evaluation metrics that can accurately assess the performance of malicious URL detection systems is essential for comparing the effectiveness of different algorithms.
By exploring these avenues, researchers can develop more effective and efficient algorithms for detecting malicious URLs, ultimately improving the security and reliability of online systems.
References
[1] CSIS, no date. Available at https://www.csis.org/programs/strategic-technologies-program/significant-cyber-incidents.
[2] Ani Petrosyan, Jun 23, 2023, Annual number of malware attacks worldwide from 2015 to 2022, Available at https://www.statista.com/statistics/873097/malware-attacks-per-year-worldwide/.
[3] Staff writer, 2023. South Africa’s websites are under attack, Available at https:/businesstech.co.za/news/internet/710414/south-africas-websites-are-under-attack/.
[4] Van Niekerk, B. 2017. An analysis of cyber-incidents in South Africa. The African Journal of Information and Communication (AJIC), 20, 113–132. Available at https:/doi.org/10.23962/10539/23573.
[5] Hu Z and Yuan Z, no date. A Review of Data-driven Approaches for Malicious Website Detection, Available at https:/arxiv.org/ftp/arxiv/papers/2305/2305.09084.pdf.
[6] Sinha S, Bailey M and Jahanian F, 2008. “Shades of Grey: On the effectiveness of reputation-based “blacklists”,” in 2008 3rd International Conference on Malicious and Unwanted Software (MALWARE), pp. 57–64.
[7] Hassan I. Ul, Ali R. H., Abideen Z. Ul, Khan T. A., and Kouatly R.,2022. “Significance of machine learning for detection of malicious websites on an unbalanced dataset,” Digital, vol. 2.
[8] Al-Ahmadi S, 2020. “A Deep Learning Technique for Web Phishing Detection Combined URL Features and Visual Similarity,” International Journal of Computer Networks & Communications (IJCNC), vol. 5.
[9] Raja, A.S., Vinodini, R. and Kavitha, A., 2021. “Lexical features based malicious URL detection using machine learning techniques.” Materials Today: Proceedings, 47, pp. 163–166.
[10] Kamboj, Akshit, Kumar, Priyanshu, Bairwa, Amit, Joshi, Sandeep, 2022. “Detection of malware in downloaded files using various machine learning models.” Egyptian Informatics Journal. 24. doi: \nolinkurl10.1016/j.eij.2022.12.002.
[11] Singh, J. and Singh, J., 2020. “Detection of malicious software by analyzing the behavioural artifacts using machine learning algorithms.” Information and Software Technology, 121, p. 106273.
[12] Sahingoz, Ozgur, Buber, Ebubekir, Demir, Onder, Diri, Banu, 2019. “Machine learning based phishing detection from URLs.” Expert Systems with Applications. 117. 345–357.
[13] Yang, W., Zuo, W. and Cui, B., 2019. “Detecting malicious URLs via a keyword-based convolutional gated-recurrent-unit neural network.” IEEE Access, 7, pp. 29891–29900.
[14] Li, T., Kou, G. and Peng, Y., 2020. “Improving malicious URLs detection via feature engineering: Linear and nonlinear space transformation methods.” Information Systems, 91, p. 101494.
[15] Mondal, D.K., Singh, B.C., Hu, H., Biswas, S., Alom, Z. and Azim, M.A., 2021. “SeizeMaliciousURL: A novel learning approach to detect malicious URLs.” Journal of Information Security and Applications, 62, p. 102967.
[16] Hoang, X.D., 2018. “A Website Defacement Detection Method Based on Machine Learning Techniques.” In In SoICT ’18: Ninth International Symposium on Information and Communication Technology, December 6–7, 2018, Da Nang City, Viet Nam. ACM, New York, NY, USA, 6 pages. https:/doi.org/10.1145/3287921.3287975.
[17] Afzal, S., Asim, M., Javed, A.R., Beg, M.O. and Baker, T., 2021. “Urldeepdetect: A deep learning approach for detecting malicious urls using semantic vector models.” Journal of Network and Systems Management, 29, pp. 1–27.
[18] Mabandla L and Sibanda K, 2022. A Comparative Analysis of Light Weight Intrusion Detection Models for the Internet of Things, Southern Africa Telecommunication Networks and Applications Conference (SATNAC), ISBN: 978-0-6397-2773-8.
[19] Omotehinwa T. O, Oyewola D. O and Dada E. G, 2023. A Light Gradient-Boosting Machine algorithm with Tree-Structured Parzen Estimator for breast cancer diagnosis, Healthcare Analytics, Volume 4, 100218, ISSN 2772-4425, Available at https:/doi.org/10.1016/j.health.2023.100218.
[20] Elegbede O and Sibanda K, 2022. An Analysis of Bias and Variance of the XGBoost, SVM and ANN algorithms using a Mobile Money Fraud Case, Southern Africa Telecommunication Networks and Applications Conference (SATNAC), ISBN: 978-0-6397-2773-8.
[21] Osman A.I.A, Ahmed A.N, Chow M.F, Huang Y.F, El-Shafie A,2021. Extreme gradient boosting (Xgboost) model to predict the groundwater levels in Selangor Malaysia, Ain Shams Engineering Journal, Volume 12, Issue 2, pg. 1545–1556, ISSN 2090-4479, https:/doi.org/10.1016/j.asej.2020.11.011.
[22] javapoint (https://www.javatpoint.com/machine-learning-random-forest-algorithm).
[23] Oshiro T.M, Perez P. S and Baranauskas J. A, 2012. How Many Trees in a Random Forest? Conference Paper in Lecture Notes in Computer Science ⋅ July 2012 DOI: \nolinkurl10.1007/978-3-642-31537-4_13 P. Perner (Ed.): MLDM 2012, LNAI 7376, pp. 154–168, 2012. Springer-Verlag Berlin Heidelberg.
Biographies

Zambia Diko received the bachelor of science (Hon) in computer science from University of Fort Hare. She recently successfully completed her masters degree, passed with a Distinction at the same University being supervised by Prof Khulumani Sibanda. Her research interests are in machine learning modelling and Artificial Intelligence.

Khulumani Sibanda is the Head of department as well as Ass. Professor in the department of Applied Informatics and Mathematical Sciences, Faculty of Engineering, Built Environment and Information Technology at Walter Sisulu University in South Africa. He holds a PhD in Computer Science and his research interests are in Machine Learning and Artificial Intelligence. Much of his research has been on prediction and classification models. He has supervised to completion 5 PhD and 21 MSc students.
Journal of Cyber Security and Mobility, Vol. 13_5, 1105–1128.
doi: 10.13052/jcsm2245-1439.13513
© 2024 River Publishers