Research on Fast Early Warning of False Data Injection Attack in CPS of Electric Power Communication Network
Jiankun Zhao1, Kaiyue An2,* and Xiang Wang2
1Inner Mongolia Power (Group) Co., Ltd., Inner Mongolia Power Research Institute Branch, Hohhot, Inner Mongolia, China
2Inner Mongolia Electric Power (Group) Co., Ltd. Communication Branch, Hohhot, Inner Mongolia, China
E-mail: zjk2008123zjk@163.com; 1025136360@qq.com; dhuwx727@163.com
*Corresponding Author
Received 30 June 2024; Accepted 29 August 2024
Abstract
The power grid is vulnerable to bad data interference and false data attacks, so its security is reduced. This paper focuses on the study of false data injection attacks (FDIAs), analyzes the principle of FDIAs and their impact on power systems, and studies the methods of suppressing and detecting FDIAs based on distributed state estimation and neural networks. In addition, this paper establishes a specific simulation model. Simulation results show that the proposed method can effectively identify FDIAs and correct bad data, thus further reducing the impact of FDIAs on power system state estimation. Therefore, in the follow-up, we can use this method to carry out practical research in the power communication network to further improve the security of the power communication network.
Keywords: Electric power communication network, cyber-physical systems, false data, attack, early warning.
1 Introduction
Simply expanding the functions of traditional computer systems or other engineering equipment can no longer meet the needs of social production. Moreover, traditional industrial equipment needs to change to the direction of informatization and networking. However, limited by communication technology, the real-time, controllability and scalability of the network are poor. Therefore, scholars and researchers from all over the world have begun to pay attention to the optimal allocation of system resources, performance improvement and the integration of information systems and physical systems.
At present, the security problems faced by smart grid mainly exist in the perception layer, execution layer and data transmission layer. Among them, physical attacks destroy the integrity of data by damaging physical devices and other ways, and Denial of Service (DoS) attacks are the easiest to achieve. In this case, the attacker does not need to know much about the system architecture, and can carry out the attack through the network communication channel. In addition, the replay attack uses the normal data packets received by the receiver before, and sends them to the receiver again, so as to achieve the purpose of spoofing the system [1]. Attackers can obtain data from the network transmission channel, use model identification and other methods to obtain the system topology, design attack vectors with concealment characteristics [2].
FDIAs (FDIAs) have more potential threats than other attacks because of their concealment characteristics, which are not easy to detect. How to solve the network security problem in smart grid, design a reasonable detection scheme. The purpose of this paper is to explore a fast early warning method for FDIAs in CPS of power communication networks through intelligent methods, which can effectively identify FDIAs and correct bad data, thus further reducing the impact of FDIAs on power system state estimation.
Regarding the concealment of false data injection attacks,the topology modeling of power CPS is based on the interdependent network of complex theory. Power CPS is formed by a specific coupling mode between power system and information system, and power system is composed of synchronous generator, asynchronous generator, bus, transmission line, smart meter and other components, which mainly meet the needs of power production. The information system is composed of dispatching control system, data acquisition equipment, sensors, computing system, etc., and plays the roles of supervision and control, decision-making calculation, and data acquisition for the power system.
The purpose of this study is to propose a fast warning method for dealing with CPS false data injection attacks in power communication networks. This paper focuses on the research of false data injection attacks in power systems, analyzes the principles of false data injection attacks and their impact on power systems, and studies methods for suppressing and detecting false data injection attacks based on distributed state estimation and neural networks
The innovation of this article is the proposal of a neural network-based method for identifying and correcting false data. By using residual detection and fully connected neural networks to determine whether the power system has been subjected to false data injection attacks, and removing the impact of tampered data on system observability, a multivariate LSTM time series prediction model is used to correct the tampered data. Simulation results have shown that the proposed method can effectively identify false data injection attacks and correct malicious data that has been tampered with by false data injection attacks, enhancing the power system’s ability to suppress false data injection attacks.
2 Related Work
The passive defense against FDIAs occurs in the stage after the attack has already occurred, and can generally be divided into the detection, identification, and repair of FDIAs [3]. The detection of FDIAs is achieved by analyzing and extracting normal and abnormal data features from historical data to detect real-time data. The traditional state estimation sets a threshold at a certain confidence level through extreme value functions and residual formulas. When the threshold is exceeded, it can be considered as bad data. FDIAs bypass this type of detection [4]. Reference [5] proposes using the Kullback Leibler distance between historical and real-time data as the basis for determining the presence of FDIAs. However, this method still requires setting a threshold, which greatly affects the detection results. Reference [6] proposes the sparsity property that can be exploited for FDIAs, treating the detection problem as a decomposition problem of low rank sparse matrices. Reference [7] proposes the use of an adaptive CUSUM(Cumulative Sum Control Chart) algorithm to achieve real-time monitoring. With the diversification of attack methods used by initiators of FDIAs, early attack detection methods are no longer sufficient to address these challenges. The extensive application of machine learning in the field of classification provides scholars with new solutions. Reference [8] proposed that false data injection attack detection is essentially a classification problem. However, such shallow algorithms require training a large number of network parameters when facing large power networks, making them difficult to apply to large power grids. In addition, in terms of unsupervised learning, PCA(Principal Component Analysis) in reference [9] and isolation forest in reference [10] have also been applied to solve attack detection problems, but neither can achieve real-time detection.
The deep integration of information systems and physical systems in smart grids has improved the efficiency, scheduling, and monitoring. Due to the extensive access of network devices, while promoting resource allocation, data analysis, and decision control, the security risks faced by the power grid are gradually increasing. The power SCADA(Supervisory Control And Data Acquisition) system plays a crucial role in perceiving the state of the power grid, and increasing measurement redundancy can improve the accuracy of system state estimation. However, FDIAs designed by attackers targeting the SCADA system state can avoid traditional bad data detection systems, resulting in incomplete data in the SCADA system, erroneous decision-making in the control system, and causing huge losses to the safe operation [11]. Reference [12] analyzed the vulnerability of state estimation in smart grids and comprehensively reviewed the potential serious consequences that smart grids may face after being attacked by false data injection. The communication network of the power system has characteristics such as network specificity, security zoning, horizontal isolation, and vertical authentication, which have a certain degree of reliability and security. Current security case studies on smart grids indicate that physical isolation cannot fully guarantee the security of the power grid system [13]. The power system and related facilities are important supports for national industrial construction. The forms of attacks against industrial control equipment are increasing day by day, and research on attack mechanisms, defense strategies, and system security performance evaluation urgently needs to be deepened [14]. Network attacks in the power grid can be classified into disrupting the confidentiality, integrity, and availability of information according to different attack targets [15], while FDIAs can be classified as disrupting the integrity of data, posing a higher degree of threat to the power grid. According to the approach of constructing FDIAs, data injection attacks can be divided into two categories: manipulating data and disrupting network communication. In recent years, multiple power grid security accidents have been related to data tampering and loss, as well as damage to communication networks. Moreover, it is difficult to recover data from malicious damage [16]. With the development of technologies such as network communication, data analysis, and control decision-making in the power grid system, as well as the upgrading of hardware equipment, the level of intelligence is constantly improving, and the scope of malicious data injection attacks is also expanding. In a broad sense, disrupting the integrity of power grid information system data, causing control system instability, scheduling decision-making errors, causing economic losses, and wasting power and energy can all be regarded as FDIAs facing the power grid, which is not conducive to the construction of smart grids.
Intrusion detection systems have attracted widespread attention as an important means of deep defense for power CPS. Reference [17] combines packet load characteristics on the basis of behavioral characteristics. Considering that an attack behavior may affect multiple events across space and time, reference [18] proposes an intrusion detection method based on spatiotemporal event correlation to reduce the high false alarm rate caused by traditional intrusion detection systems using only a single event feature for attack identification. Reference [19] extracts periodic communication behavior features from the system to construct a whitelist for effective intrusion detection. Considering that communication traffic in network attacks may exhibit sudden changes in cycle size, new cycles or missing known cycles, and sudden strengthening of noise in the frequency domain, wavelet analysis methods are used to perform spectral analysis on traffic curves to identify abnormal frequencies [20]. However, industrial control networks not only include strong periodic data polling functions, but also configuration functions with certain randomness and non periodicity. Relying solely on traffic periodicity for detection may result in a high false alarm rate,some researchers have attempted to incorporate packet content into anomaly detection.
3 Model Construction
3.1 Power CPS Modeling Under False Data Attacks
In this paper, the topology modeling of power CPS is based on the interdependent network of complex theory. Power CPS is formed by a specific coupling mode between power system and information system, and power system is composed of synchronous generator, asynchronous generator, bus, transmission line, smart meter and other components, which mainly meet the needs of power production. The information system is composed of dispatching control system, data acquisition equipment, sensors, computing system, etc., and plays the roles of supervision and control, decision-making calculation, and data acquisition for the power system.
In order to simulate the CPS false data injection attack mode in power communication and find reliable countermeasures, this article summarizes the common CPS false data injection attack modes in the current power communication network, models them, and constructs a simple topology structure for the analysis and resolution in the following text.
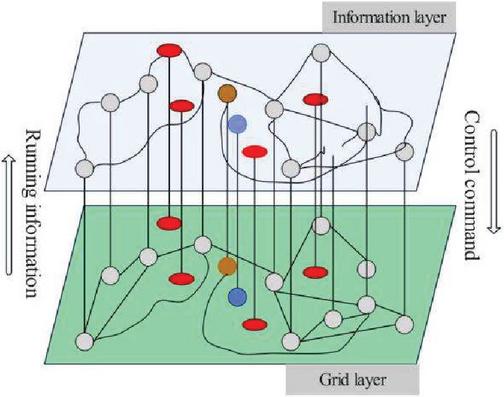
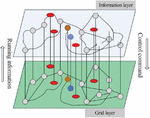
According to the above analysis of power CPS, ignoring the distribution network, Figure 1 shows a simple topological structure. In this structure, the whole CPS is abstracted into two undirected networks. Among them, the upper layer network is the information layer or called information system, information network, and the lower layer network is the power layer, which can be called physical system, power network or power system.
Figure 1 Schematic diagram of power CPS topology.
, and represents the power system physical equipment, where power plants and substations are power supply nodes and the internal structure of the system is ignored. represents the transmission lines, the abstracted power system is expressed as an unweighted undirected network with physical nodes, and has small-world characteristics for the power grid. The information network is the private communication network of electric power CPS, and each physical device is equipped with corresponding communication equipment for data monitoring and acquisition. In order to maintain the similarity, the model structure of the information network also has the characteristics of a small world and an information node corresponds to a power node, which is abstracted as a graph . represents the data collection and supervision equipment and network equipment of the information system. The network side is abstracted as a communication link, and the information communication system has information nodes. Based on the abstraction analysis of the power CPS, has the following structure:
| (1) |
In the formula (3.1), represents the internal adjacency matrix of the network layer, represents the adjacency matrix of the physical layer, represents the network physical interface matrix, which represents the interconnection between the network layer and the physical layer, and is the transpose matrix of . If there are connecting edges for network nodes and , the element in is , otherwise . The nodes in the information layer need the state data provided by the nodes in the power layer, and the nodes in the power layer need the control commands provided by the nodes in the information layer to operate safely. In the actual power system, each node is matched with a sensor or a data acquisition device. In order to describe and realize the topology, the CPS based on the “complete one-to-one correspondence” relationship in the dependent network.
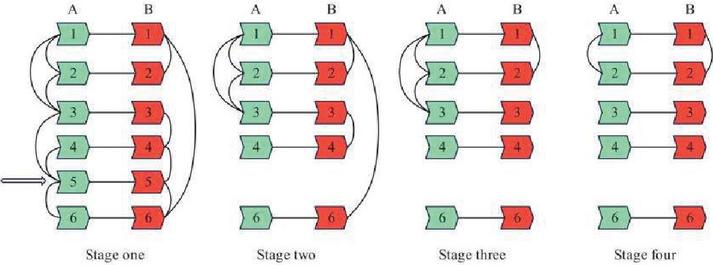
In this paper, the fragility of the current network structure is judged by seeking the most connected subgraph of the network structure on both sides. When any node of the system does not belong to the most connected subgraph, the function shows that the node is out of operation, and the structure shows that the system loses this node. Figure 2 shows the cascading failure process of the system structure, the red node represents the information layer node, and the green node represents the grid layer node. According to the principle of false data attack, the structural failure process of the attacked system is analyzed.
Figure 2 Schematic diagram of cascaded faults in system structure.
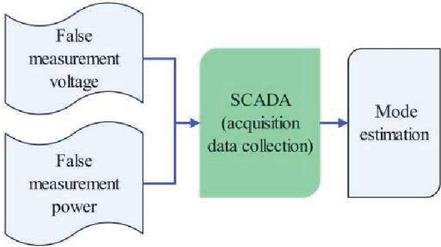
Traditional vulnerability research methods only consider the deviation of the state estimation results from the actual estimation value, but ignore the problem of state estimation convergence failure caused by different measurements. Figure 3 shows the impact of measurements on state estimates. This section focuses on the impact of false data injection voltage and power measurements on the vulnerability of state estimation.
From Figure 3, it can be seen that false data attacks on power CPS mainly create false voltage and power by injecting false data, causing the monitoring system to mistakenly believe that all parameters are in a normal state. Traditional methods cannot be used to implement and operate the power communication network, making it difficult to make reliable state estimates. If the false voltage and power can be effectively identified through reliable methods, the entire system state can be effectively evaluated.
Figure 3 Correlation between false data attacks and state estimation.
In state estimation, the power system balance equation and nonlinear model are constructed, and the nonlinear equations are solved by using the collected measurement data and iterative approximation method. The convergence value of the solved equations is used as the estimated value of the state variable. Formulas (2)–(4) are the solution process and convergence criteria of AC power flow state estimation. When the measurement vector of the quantitative measurement equation is , the state estimation vector is to find the minimum value of the objective function.
| (2) |
According to the Gauss-Newton iteration method, the solution of formula (2) can be obtained by iteration according to formula (3)
| (3) |
represents the number of iterations, represents the result of the -th iteration of the state variable, and represents the gain matrix. is the Jacobian matrix of the measurement vector of order , which takes any one of the following three terms as the convergence criterion.
| (4) |
In the formula (4), represents the sequence numbers of the components in the state vector , and , , are different convergence criteria selected according to the accuracy. The second formula indicates that the maximum absolute value of the state correction in the -th iteration calculation is less than the given convergence standard value, and this convergence criterion is commonly used in practice.
3.2 Identification and Correction of FDIAs
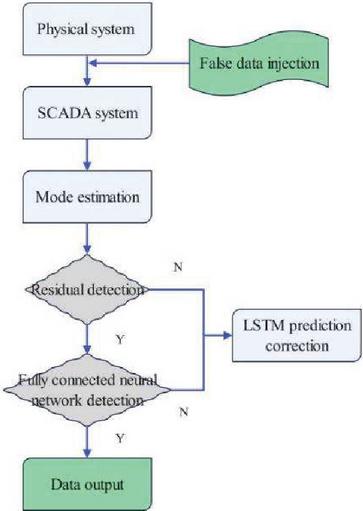
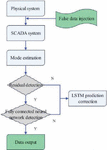
To enhance the filtering ability for bad data,the steps include: 1. Building a power system state estimation model, obtaining residual vectors based on the state estimation model, and comparing them dimension by dimension to see if they exceed the detection threshold. If they exceed the detection threshold,it is considered bad data. 2. Detect false data attacks through fully connected neural network detection to detect false data attacks that residual detection cannot detect. Use fully connected neural networks to determine whether each node has suffered from false data attacks. If it is determined that a node has suffered from false data attacks, it is considered that the measurements related to that node are untrustworthy and are all bad data. 3. Determine whether removing bad data affects system observability. If it does not, delete the bad data. The proposed method can effectively identify false data that traditional bad data detection methods cannot recognize, and can be well applied in small systems and distributed state estimation subregions. The process of detecting and correcting FDIAs is shown in Figure 4.
Figure 4 Flowchart of detection and correction of false data injection attack.
When the system is attacked by random false data, there are differences. Compared with the fitting residual value of normal data. At this time, the measurement data set attacked by random false data can be found by residual detection. The standardized residual error method is used to identify the bad data caused by random false data attacks and measurement errors. The power system nonlinear measurement equation can be expressed as:
| (5) |
In the formula (5), represents the -dimensional measurement vector, represents the -dimensional state vector, represents the number of power system nodes.
| (6) |
is the -dimensional state estimation vector.
| (7) |
In the formula (7), , , is an -dimensional covariance matrix, and is a -order Jacobian matrix.
The detection is to perform the dimensional residual error according to the method of hypothesis testing:
| (8) |
, is the dimension of the measurement vector, is the -th normalized residual value, and is the -th normalized residual threshold value, which takes 2.81 (false detection probability ). When the standardized residual value of the detection quantity measurement is greater than the threshold value.
When the system passes the residual detection, it is considered that there are no gross errors or random false data with errors greater than 3 in the current measurement. For perfect false data, the residual remains unchanged before and after the attack, and cannot be identified through residual detection methods. However, when an attack occurs, the voltage amplitude and phase angle values will deviate from the normal data before the attack. Therefore, a fully connected neural network can be used as a discriminator to determine whether each node in the power system has been subjected to perfect false data injection attacks.
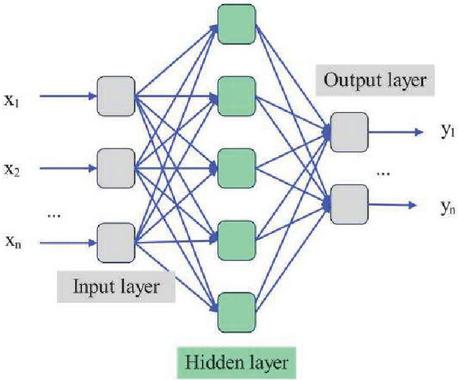
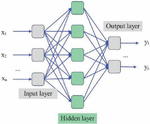
Fully connected neural network is the most common model of neural network, which means that the neurons between any two adjacent layers are connected. Fully connected neural network has more connections and weights, and have strong nonlinear fitting capabilities.. Compared with other machine learning algorithms, it cans effectively extract false data features. The fully connected layer neural network model is shown in Figure 5.
Figure 5 Fully connected neural network model.
The model are characterized by their layer-to-layer transfer functions:
| (9) |
is the input layer, is the output layer, is the activation function, is the weight, and is the offset.
It is judged whether the removal of bad data will affect the observability of the system. If it does not affect, the bad data will be deleted, and vice versa, the bad data will be predicted and corrected by the multivariable LSTM(Long Short-Term Memory) time series prediction model.
In statistics, a group of random variables composed of time order are usually called time series. For time series, there are the following important statistical characteristic quantities:
(1) Mean function:
| (10) |
(2) Variance function:
| (11) |
(3) If there is a mean for each state of the sequence, then the autocovariance would be:
| (12) |
In the formula (12), .
(4) Autocorrelation coefficient:
If the variance is used for normalization, then the autocorrelation can be converted to an autocorrelation coefficient :
| (13) |
The specific formulas are as follows:
| (14) | ||
| (15) | ||
| (16) |
In the formulas (14)–(16), represents the true value, represents the predicted value, and represents the number of variables predicted.
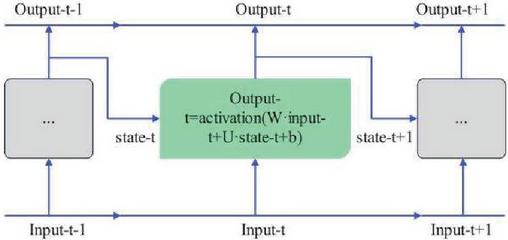
LSTM is evolved from Recurrent Neural Network (RNN). RNN is a basic deep learning algorithm used to deal with sequence problems. It handles the sequence by iterating through all sequence elements and saving a state that contains information about the sequence that has been viewed, that is, all information about the past. The Simple Recurrent Neural Network Layer (Simple RNN) model is shown in Figure 6.
Figure 6 SimpleRNN layer.
The SimpleRNN layer is characterized by its time step function:
| (17) |
In the formula (17), is the activation function, and are the weight, and is offset.
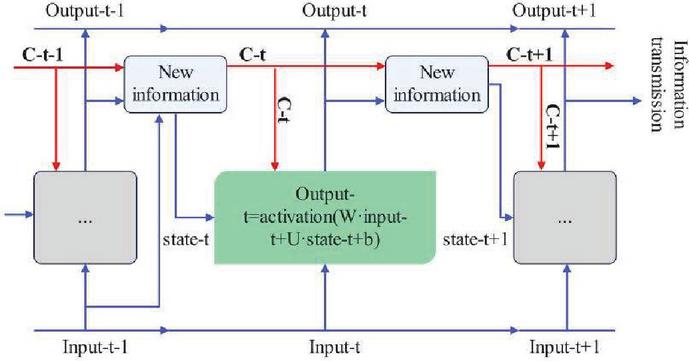
The long-short memory algorithm in the LSTM layer was developed by Hochreiter and Schmidhuber, which solves the problem of information loss in the SimpleRNN layer due to the disappearance of gradients. The LSTM layer is an improvement of the SimpleRNN layer. It adds an information transmission belt to transmit the information in the sequence to a later time step, and saves the information in real time for later use, so as to prevent the loss of earlier signals during processing. The LSTM layer model is shown in Figure 7.
Figure 7 LSTM layer.
The output function for the LSTM layer is:
| (18) |
In the formula (18), is information carrying across time steps, is the activation function, , and are weights, and is an offset. Its update method involves three different transformations, the transformation form is the same as the SimpleRNN unit, and the update method is as follows:
| (19) |
In the formula (19), , , , , and are the weight, , and are the offset. and are multiplied to forget irrelevant information in the information transfer belt, and and are multiplied to update information in the information transfer belt.
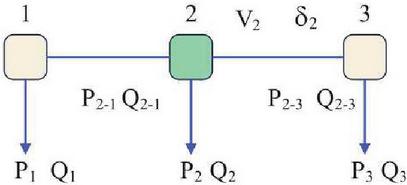
Figure 8 Node 2 related input data.
The input variable selection of the multivariable LSTM time series prediction model The quantitative measurements related to tampered data are shown in Figure 8. The relevant input data for Node 2 are , , , , , , , , , , and . When the voltage amplitude or phase angle of Node 2 deviates from the normal value, Node 2 is attacked by perfect false data, and the tampered data is corrected by outputting data.
4 Experimental Study
4.1 Experimental Methods
The experimental simulation uses Matlab software package Matpower7.0, all power flow calculations are AC. The test is run under IEEE39-bus and IEEE118-bus systems. The state estimation is run in AC mode with a maximum of 100 iterations and a weighted norm tolerance of 1 * 10 for the measurement residuals, and the state estimation is checked for bad data using the chi-square test with a tolerance of 6.25.
The processor of this system is i9-9900KS, the system running memory is 32GB, the hard disk memory is 1TB, and the graphics card model is GTX 1060.
The false data attack is divided into two different scenarios: in scenario 1, when the physical protection of the meter is different, the attacker can only access some specific meters, and the number of destroyed meters is not limited. Based on the above scenario description, attackers cannot attack the control center and convergence point, but can only attack ordinary measuring instruments. According to the coupling model of power CPS and the structural characteristics of the actual power system, the control center is a node with high network degree. In scenario 2, illegal personnel have the ability to destroy any protected and unprotected meters, but the number of meters damaged is limited. It assumes that the number of broken meters is limited, and the attacker has at most meters to attack.
4.2 Results
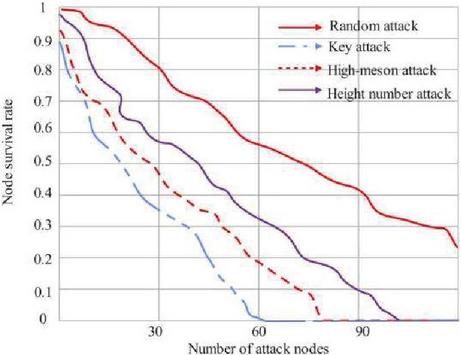
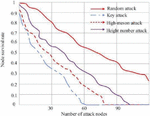
Figure 9 shows the node survival rate of different ways of false data attack systems. The experimental results show that any kind of false data attack will make the system more fragile, and the survival rate of the system nodes will continue to decline with the increase of the number of attacking nodes. Among them, compared with the other three attack methods, the node survival rate of the system decreases relatively slowly in the random attack method. On the contrary, high-criticality attacks make the survival rate of system nodes decline rapidly. When the number of attacking nodes is close to 60, the survival rate of the system drops to 0. To sum up, power CPS is more vulnerable to high-criticality attacks.
Figure 9 Survival rate of system nodes after attack.
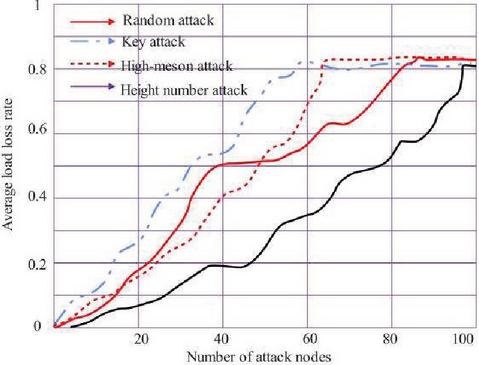
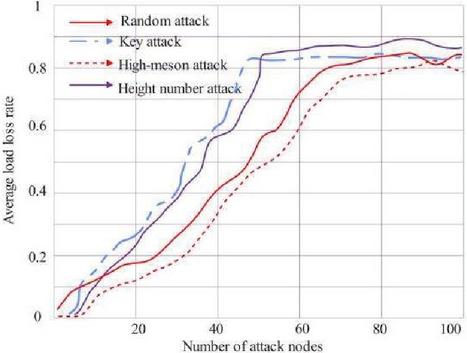
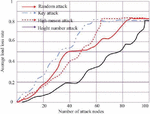
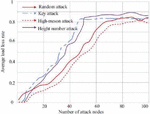
Figure 10 shows the comparison of the system load loss rate under random number coupling. Under the degree-betweenness coupling mode, the average load loss rate curves under different attack modes are shown in Figure 11.
Figure 10 Comparison of system load loss rate under random number coupling.
Figure 11 Comparison of system load loss rate under degree-betweenness coupling.
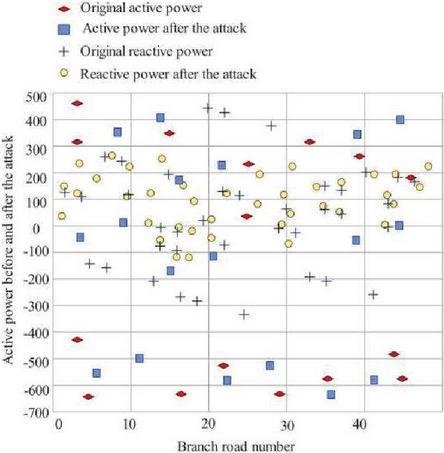
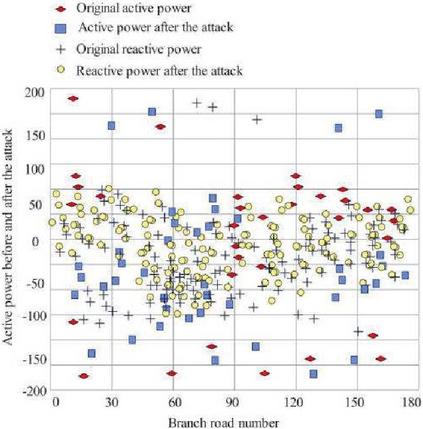
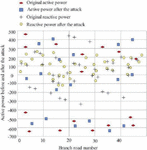
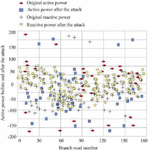
In system simulation experiments based on IEEE39-bus and IEEE118-bus standards, the attacker injects false data into the measurement data through the SCADA system or smart meter, such as voltage amplitude, branch active power, reactive power, etc. In order to study the influence of measurements on the limit state of the state estimate, the minimum value that leads to the failure of the state estimate convergence is calculated by continuously injecting false measurements of voltage and power. Taking the active and reactive power at the head of the false data attack branch as an example, we observe the false data attack injection situation, as shown in Figures 12 and 13.
Figure 12 Power values before and after IEEE39-bus attack.
Figure 13 Power values before and after IEEE118-bus attack.
The IEEE 39-bus has 46 branches, and its branch numbers are consistent with those of the standard system. The active power of the branch before the false data attack is 106.124 MW, the reactive power is 16.799 MW, and the active power after the attack is 72.341 MW, and the reactive power is 10.79 MW. When the power values before and after injection are equal, it means that false data has not been injected into the branch, and vice versa, if the power values before and after injection are not equal, it means that false data has been injected into the branch. IEEE118-bus has 186 branches, the original average active power is 1.64 MW, the average active power after injection is 5.70 MW, the original average reactive power is 0.245 MW, and the average reactive power after injection is 0.895 MW. The measurement value injected with false data may lead to non-convergence of state estimation, and the voltage and power are the main factors of non-convergence.
Keras library is used to build the neural network model in Python 3.7. The fully connected neural network adopted has four intermediate layers, each layer has 32 neurons. Among the 30,000 sets of normal historical data, we randomly select 3,000 sets to add attack vectors, verification data, and test data, of which training data accounts for 17/30, verification data accounts for 1/10, and test data accounts for 1/3. Then, we use statistical metrics to evaluate the performance of fully connected neural networks. Among them, true positive (TP) means the number of data detected with positive actual values and positive predictions, and false positive (FP) means the number of data with negative actual values and positive predictions. True negatives (TN) means the number of data with negative predictions and negative actual values, and false negatives (FN) means the number of data with negative predictions and positive actual values. The simulation results are shown in Table 1.
Table 1 Statistical table of simulation data of fully connected neural network
| Statistical Parameter | Forecast Result |
| TP | 9118 |
| FP | 0 |
| TN | 775 |
| FN | 6 |
| Accuracy | 98.90% |
| Sensitivity | 100% |
| Specific validity | 97.71% |
| Accuracy | 98.90% |
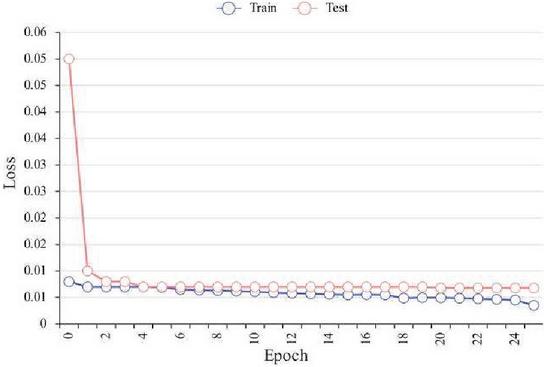
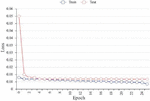
The loss function (loss) of the prediction model is the mean mean square error. Based on a comprehensive analysis of the size of the dataset, the complexity and performance of the model, as well as the training objectives, and in conjunction with existing research literature, the epoch setting for this article is ultimately determined to be 25.
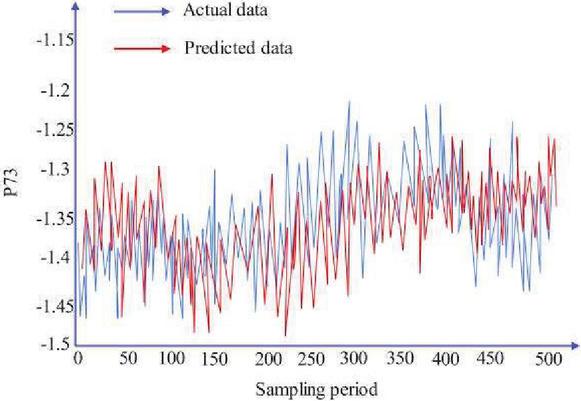
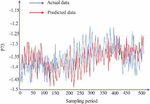
Figure 14 is a change of loss with epoch adopts the AdaDelta algorithm, and Figure 15 is an actual and predicted curve of the active power load of the node.
Figure 14 Change of loss with epoch when the prediction model adopts the AdaDelta algorithm.
Figure 15 Actual and predicted load curves when the prediction model adopts the AdaDelta algorithm.
Then, we use the same method to process the data of the prediction and evaluation indicators of the other three optimization algorithms, count all the data, and summarize the respective prediction and evaluation indicators when the prediction model adopts the above four optimization algorithms as shown in Table 2:
Table 2 Comparison of prediction and evaluation indicators
| Optimization Algorithm | RMSE | MAE | MAPE (%) |
| AdaGrad | 0.028058 | 0.021297 | 0.004948 |
| RMSProp | 0.029517 | 0.022657 | 0.005273 |
| Adam | 0.028345 | 0.021572 | 0.005014 |
| AdaDelta | 0.028636 | 0.021825 | 0.005076 |
4.3 Analysis and Discussion
The power system encompasses the production and consumption of electrical energy, consisting of power stations, transmission and distribution lines, power supply and distribution stations, and electricity consumption. To ensure that users can obtain safe, stable, and high-quality electricity in real time, it is necessary to monitor and adjust the production and transmission of electricity in real time. With the continuous expansion of the power grid scale and the increasing penetration rate of new energy, the power grid is vulnerable to adverse data interference and false data attacks, resulting in reduced security. Hackers can use false data injection attacks to attack the power system, causing it to collapse or gaining economic benefits, seriously endangering the safe operation of the power system.
This paper focuses on the study of false data injection attacks (FDIAs), analyzes the principle of FDIAs and their impact on power systems, and studies the methods of suppressing and detecting FDIAs based on distributed state estimation and neural networks. In addition, this paper establishes a specific simulation model. Simulation results show that the proposed method can effectively identify FDIAs and correct bad data, thus further reducing the impact of FDIAs on power system state estimation.
As shown in Figure 9, when the information network of the power CPS is attacked, the information network nodes under the fault cause the corresponding power network nodes to be unobservable. This unobservability makes the system show high sensitivity. For example, the dispatcher’s control of the power flow is inaccurate, which makes the information nodes continue to fail and the system fault area continue to increase. The information layer and the grid layer of power CPS have different coupling modes, and the impact of different attack strategies on the observability and controllability of the power layer may also be different under different coupling modes.
As shown in Figures 10 and 11, under the two coupling modes, the power CPS is attacked by different false data. The experimental results show that with the increase of the number of attacked information nodes, the average load loss rate of the power CPS shows an increasing trend. Among them, compared with other attacks, the load loss rate of the high-criticality attack method increases faster, that is, the system is more fragile under the high-criticality attack method.
Figures 12 and 13 show the active and reactive power when an attacker injects false data into the front and rear branch heads of IEEE39-bus and IEEE118-bus by solving a semidefinite programming (SDP)-based convexity framework. As can be seen from Table 1, the fully connected neural network can effectively detect whether the system node is attacked by perfect false data.
In Figure 14, when the AdaDelta optimization algorithm is used, loss can be maintained at a small level in both the training process and the testing process. At the same time, it can be seen from Figure 15 that within 500 sampling periods.
It can be seen from Table 2 that the prediction effects of the four optimization algorithms are relatively accurate and the errors are relatively small, among which the AdaGrad algorithm has the best effect. Through the comparison of the real value and the predicted value of the four different optimization algorithms for 500 sampling periods, it can be seen that compared with the random tampering of the quantity measurement by the perfect false data injection attack, the predicted value of the LSTM time series prediction model used in this paper is similar to the real value, which can well correct the tampered data.
From the above analysis, we can see that the fast early warning method of false data injection attack in CPS of power communication network proposed in this paper has good effect.
On the basis of traditional bad data detection, an improved method for identifying and correcting false data injection attacks based on neural networks has been designed. Firstly, the residual vector is obtained based on the state estimation model, and the residual detection method is used to determine whether each measurement has been subjected to false data attacks or interference, resulting in bad data; Secondly, by using fully connected neural networks to detect false data attacks, false data attacks that cannot be detected by residual detection can be detected. If a node is judged to have suffered from false data attacks, it is considered that the measurements related to that node are unreliable and are all bad data; Then, determine whether the removal of bad data affects the observability of the system. If it does not affect, delete the bad data. Otherwise, use a multivariate LSTM time series prediction model to predict and correct the bad data; Finally, a specific simulation model was established, and numerical simulations showed that the proposed method can effectively identify false data injection attacks and correct bad data, further reducing the impact of false data injection attacks on power system state estimation.
5 Conclusion
This paper focuses on the study of FDIAs in power systems, and analyzes the principle of FDIAs and their impact on power systems. Moreover, this paper studies the methods of suppressing and detecting FDIAs based on distributed state estimation and neural network, and designs a method of identifying and correcting FDIAs based on neural network. In addition, this paper detects false data attacks through fully connected neural network detection, to detect false data attacks that cannot be detected by residual detection, and establishes a specific simulation model. Simulation results show that the proposed method can effectively identify FDIAs and correct bad data, thus further reducing the impact of FDIAs on power system state estimation.
At this stage, the study on FDIAs is based on a certain time section. In the future, attackers can control the measurement unit to carry out uninterrupted and continuous FDIAs, so as to slow down the computing efficiency of the defense algorithm, and even make the defense algorithm invalid. Therefore, how to build a defense system against continuous FDIAs needs further research.
This study aims to investigate the vulnerability of power CPS under the assumption that attackers have access to all configuration information of the system. However, attackers may not have a complete understanding of the system configuration and network structure of power CPS. Further research on the vulnerability and response strategies of power CPS under false data attacks can be conducted under the assumption of incompleteness. Secondly, this article mainly studies false data attacks under the DC power flow model, the time required to establish attack vectors, and the number of damaged instruments. Further research is needed to establish attack vectors for false data attacks under the AC power flow model
Acknowledgement
Science and Technology Project of Inner Mongolia Electric Power (Group) Co., Ltd. (Project Name: Research and Application of Key Technologies for Multi-dimensional Risk Assessment and Early Warning of Power Communication Networks, Project Number: 2023-5-41).
References
[1] Jha, A. V., Appasani, B., Ghazali, A. N., Pattanayak, P., Gurjar, D. S., Kabalci, E., and Mohanta, D. K., ‘Smart grid cyber-physical systems: communication technologies, standards and challenges’, Wireless Networks, 27(4), 2595–2613, 2021.
[2] Amin, M., El-Sousy, F. F., Aziz, G. A. A., Gaber, K., and Mohammed, O. A., ‘CPS attacks mitigation approaches on power electronic systems with security challenges for smart grid applications: A review’, Ieee Access, 9(1), 38571–38601, 2021.
[3] Zhou, X., Yang, Z., Ni, M., Lin, H., Li, M., and Tang, Y., ‘Analysis of the impact of combined information-physical-failure on distribution network CPS’, IEEE Access, 8(2), 44140–44152, 2020.
[4] Wu, Y. D., Ge, M. F., Liu, Z. W., Zhang, W. Y., and Wei, W., ‘Distributed CPS-based secondary control of microgrids with optimal power allocation and limited communication. IEEE Transactions on Smart Grid’, 13(1), 82–95, 2021.
[5] Yang, Y., Wang, S., Wen, M., and Xu, W., ‘Reliability modeling and evaluation of cyber-physical system (CPS) considering communication failures’, Journal of the Franklin Institute’, 358(1), 1–16, 2021.
[6] Habib, M. K., and Chimsom, C., ‘CPS: Role, characteristics, architectures and future potentials. Procedia Computer Science’, 200(3), 1347–1358.
[7] Mazumder, S. K., Kulkarni, A., Sahoo, S., Blaabjerg, F., Mantooth, H. A., Balda, J. C., … and De La Fuente, E. P., ‘A review of current research trends in power-electronic innovations in cyber–physical systems’, IEEE Journal of Emerging and Selected Topics in Power Electronics, 9(5), 5146–5163, 2021.
[8] Xu, L., and Guo, Q., ‘Integrated Modelling, Analysis and Optimization for Cyber-Physical Power Systems Considering the Impacts of Communication Networks’, Cigré Science & Engineering, 28(2), 160–181, 2023.
[9] Zhang, X., and Li, J., ‘Power control for cognitive users of perception layer in complex industrial CPS based on DQN. IEEE Access, 9(1), 25371–25382, 2021.
[10] Konstantopoulos, G. C., Alexandridis, A. T., and Papageorgiou, P. C., ‘Towards the integration of modern power systems into a cyber–physical framework’, Energies, 13(9), 2169–2180, 2020.
[11] Rana, M. M., and Bo, R., ‘IoT-based cyber-physical communication architecture: challenges and research directions’, IET Cyber-Physical Systems: Theory & Applications, 5(1), 25–30, 2020.
[12] Krause, T., Ernst, R., Klaer, B., Hacker, I., and Henze, M., ‘Cybersecurity in power grids: Challenges and opportunities’, Sensors, 21(18), 6225–6237, 2021.
[13] Wang, Y., Liu, D., Xu, X., and Dai, H., ‘Cyber-physical power system modeling for timing-driven control of active distribution network’, Journal of Modern Power Systems and Clean Energy, 8(3), 549–556, 2020.
[14] Cui, H., Li, F., and Tomsovic, K., ‘Cyber-physical system testbed for power system monitoring and wide-area control verification’, IET Energy Systems Integration, 2(1), 32–39, 2020.
[15] Raisin, S. N., Jamaludin, J., Rahalim, F. M., Mohamad, F. A. J., and Naeem, B., ‘Cyber-physical system (CPS) application-a review’, REKA ELKOMIKA: Jurnal Pengabdian kepada Masyarakat, 1(2), 52–65, 2020.
[16] Elma, O., Cali, U., and Kuzlu, M., ‘An overview of bidirectional electric vehicles charging system as a Vehicle to Anything (V2X) under Cyber–Physical Power System (CPPS)’, Energy Reports, 8(1), 25–32, 2022.
[17] Liu, X., Chen, B., Chen, C., et al., ‘Electric power grid resilience with interdependencies between power and communication networks–a review’, IET Smart Grid, 3(2), 182–193, 2020.
[18] Jimada-Ojuolape, B., and Teh, J., ‘Impact of the integration of information and communication technology on power system reliability: A review’, IEEE Access, 8(1), 24600–24615, 2020.
[19] Abdelmalak, M., Venkataramanan, V., and Macwan, R., ‘A survey of cyber-physical power system modeling methods for future energy systems’, IEEE Access, 10(1), 99875–99896, 2022.
[20] Jha, A. V., Appasani, B., Ghazali, A. N., and Bizon, N., ‘A comprehensive risk assessment framework for synchrophasor communication networks in a smart grid cyber physical system with a case study’, Energies, 14(12), 3428–3440, 2021.
Biographies

Jiankun Zhao (senior engineer), graduated from North China Electric Power University in 2016 with a master’s degree in engineering, joined Inner Mongolia Electric Power Research Institute in May 2016, mainly engaged in high-voltage and insulation technology research. He has won 1 first prize and 3 second prizes of Inner Mongolia Electric Power (Group) Co., Ltd. Science and Technology Progress Award, published 12 papers, authorized 3 invention patents, and won the “China Electric Power Outstanding Young Scientific and Technological Talent Award” in 2022.

Kaiyue An (senior engineer), graduated from Inner Mongolia University in 2015 with a master’s degree in engineering, joined Inner Mongolia Electric Power Communication Company in September 2015, mainly engaged in communication technology research. She has published 7 papers, authorized 2 invention patents, and won the title of “Level 3 Engineer” in 2021.

Xiang Wang (Engineer), graduated from the Hong Kong University of Science and Technology in 2017 with a master’s degree in engineering, joined Inner Mongolia Electric Power Communication Company in 2017, mainly engaged in system communication maintenance management and departmental engineering project management. She has published 6 papers and authorized 2 invention patents.
Journal of Cyber Security and Mobility, Vol. 13_6, 1331–1356.
doi: 10.13052/jcsm2245-1439.1365
© 2024 River Publishers
