Application of Complex Network Attack and Defense Time Game Model in Network Security Defense Decision
Zinan Zhu1,* and Lin Zhou2
1Information Center, Changchun Polytechnic, Changchun 130000, China
2Innovation and Entrepreneurship College, Zhongshan Polytechnic, Zhongshan 528400, China
E-mail: zhuzinan0116@163.com
*Corresponding Author
Received 03 September 2024; Accepted 18 February 2025
In a complex network environment, this study introduces the susceptible sick removed model to solve the optimal defense action timing. By combining FlipIt game theory, a complex network attack and defense time game model is designed. The game equilibrium is solved and an algorithm for selecting the optimal defense time strategy is proposed. The data validate that the relationship between the sizes of and is different, corresponding to different defense effects. In a small world network with and , the k value was 32. At 60 seconds, the proportion of I1 was 0.448, 0.280 higher than S1. In a network with and , the proportion of infected nodes fluctuated between 0.670 and 0.850 as node proportion stabilized. Adjusting the time strategy dynamically significantly increased defense benefits. Compared to , a defense strategy resulted in a 161.36% defense revenue increase. In the current complex network environment, the application of game theory can provide a foundation for methods of optimal defense timing decision-making. In the context of a complex Internet with small-world effects and scale-free characteristics in the real world, the research method has been demonstrated to effectively enhance network defense effectiveness by dynamically adjusting the time strategy.
Keywords: Network security, small world network, complex networks, time game, offensive and defensive confrontation.
The essence of network security lies in the confrontation between attack and defense (A–D). In network attack and defense confrontation (ADC), the two sides present core characteristics of game theory, such as target opposition, strategic dependence, and non-cooperative relationships through interaction and strategy selection. This makes game theory an effective tool for analyzing and modeling network ADC. By utilizing the ideas of A-D games, information security issues, in reality, are transformed into mathematical models to achieve scientific and accurate modeling and predictive reasoning of network attack behavior. It can provide a theoretical basis for the research of information system defense decision-making problems [1–3]. Exploring network security defense (NSD) decision-making based on game models has important practical significance [4–6]. In previous research on information security decision-making, random network models are mainly used to describe the actual network. However, recent advancements in computer data processing and computing capabilities have led to the proliferation of statistical research on real network data. This research has revealed that real networks are not merely random but rather complex networks characterized by small-world and scale-free properties.
With the rapid development of the Internet and the great progress of network technology, network security has gradually encountered many problems, such as being attacked by computer viruses and other attacks, causing significant damage to network systems. Faced with this situation, some scholars have conducted research on NSD decision-making. Devalk K et al. proposed a visual attack design to provide a dynamically changing real-time view of computer networks regarding NSD issues. Through scheme evaluation, malicious network activities could be identified and help improve network security awareness [7]. Zhu Z et al. proposed using deep reinforcement learning algorithms to evaluate the defense scenarios against network attacks, aiming to demonstrate the superiority of their algorithms and strategies for effective NSD [8]. Al Eiadeh, M. R. et al. proposed the utilization of network attack algorithms for the extraction of pertinent information from attack graphs. They further evaluated decision frameworks using attack graphs to provide enhanced resource allocation and security decision-making [9]. Jena S et al. proposed a global energy balancing framework using interconnected DC clusters to address network security issues in microgrid clusters. The algorithm was validated using a digital simulator, demonstrating its scalability and defense capabilities [10]. Teng Z et al. proposed a Bayesian reputation model based on time series analysis to address security issues in wireless sensor networks. The model was combined with an adaptive maintenance function to enhance the adaptability of the evaluation model. This combination proved that the model can effectively improve the detection rate of malicious nodes in the network [11].
Gomez Aguilar J F et al. conducted statistical analysis on a non-linear susceptible infectious removable (SIR) model in a feedforward neural network combined with a local search algorithm, demonstrating the high accuracy and applicability of their approach to model solving [12]. Al Harbi O et al. proposed using machine learning models and intrusion detection systems to enhance network defense infrastructure for network security issues. Through the detection and extraction of autoencoders and the multi-class classification of convolutional neural networks and bidirectional long-term memory networks, the superiority of this model in anomaly detection was evaluated [13]. Alhaj T A et al. proposed a problem regarding network intrusion detection systems. This problem involved classifying and associating alerts through causal relationships and then constructing an alert correlation attack scheme. The integrity and robustness of the model could be tested using a dataset, and the overall evaluation effect could be verified [14]. Harishkumar et al. proposed a detection model for the network threat problem of botnet traffic, which belongs to generative algorithms and attention-based bidirectional long-term memory networks. A series of experimental evaluations on disparate datasets have demonstrated that the model exhibits high detection accuracy and provides robust defense against sophisticated network threats [15]. Rehman Z et al. have proposed the utilization of modeling methods to establish an active defense framework for addressing the security concerns associated with the Internet of Things (IoT). This framework integrated mobile target defense technology with network deception and incorporated crucial measures such as operating system diversity technology to reduce defense expenditures. A thorough evaluation and analysis have been conducted, leading to the conclusion that the graphical security model method can mitigate the impact of attacks while ensuring high-performance levels [16]. Chui K T et al. proposed a method involving univariate feature selection to achieve sustainable IoT security regarding the issue of sustainable logistics network security for entrepreneurs. The efficiency and accuracy of deep convolutional neural network models could ensure network security in IoT environments [17]. Liu et al. proposed a two-layer attack defense method using deep learning to generate stronger adversarial samples for the problem of air traffic signal communication interference, thereby improving the defense performance and robustness of recognition models [18]. Abolfathi M et al. proposed a website fingerprint attack model and an efficient defense strategy based on deception to address the issue of network privacy and its enhancement techniques. By disrupting the classification of fake data packets to confuse defenders, the accuracy of fingerprint attacks could be reduced, ensuring the effectiveness and practicality of defense methods [19]. Baek F et al. proposed the use of data augmentation methods in computer vision applications in architecture, combining conditional generative adversarial networks and target classifiers to support adversarial attacks and defenses, thereby improving the accuracy of visual models for architectural applications [20].
In summary, in the field of NSD, most research is built on the behavioral strategies of A-D agents. These studies overlook the impact of A-D timing on real network security and rarely start from A-D timing strategies. In the analysis of network security state evolution, the complexity of real networks is ignored. Previous studies have not taken into account the actual network environment, resulting in poor practicality and universality of decision-making methods. Ignoring the timing of the action will be detrimental to the dynamic acquisition of the most favorable defensive action timing. To fully consider the timing of A-D and improve the universality and timeliness of NSD decision-making, this study is based on the ADC perspective, using complex network theory (CNT) and time game theory (TGT) to study the characteristics of network structure. By utilizing the optimal defense time strategy selection algorithm, the equilibrium solution of the time game is obtained, and a complex network attack defense time game (CNATTG) is constructed to improve the defense effectiveness of complex networks. Given the excellent performance of the SIR model in information transmission, it will be applied to the construction of network propagation dynamics models. Due to the fact that the FlipIt game is more in line with the reality of network A-D, it can realistically depict real-time and sudden network attacks and defenses, which will be hidden and introduced into research.
The advantages of the CNDTG model mainly lie in three aspects. Firstly, it incorporates the FlipIt game theory and its A-D strategies to ensure the security status of network nodes and resource systems. Secondly, it is possible to analyze the internal environment of complex networks by introducing the SIR model to analyze changes in the status of network nodes while also changing the ownership of system resources. Finally, the optimal defense time strategy selection algorithm is adopted to adapt to complex network environments and construct a strategy space for A-D sides, thereby achieving the application of NSD decisions.
The contribution of this study lies in using FlipIt game theory to analyze the A-D strategies of network security to obtain the security status of network nodes. On the other hand, the optimal defense time strategy selection algorithm is used to obtain the best A-D strategy, and the equilibrium solution of the time game is calculated in the small world networks (SWN), as well as the maximum A-D benefits of the CNDTG model. Therefore, the constructed CNDTG model can achieve secure defense decisions against attack behavior in complex networks and improve the performance of network security.
The study consists of four sections. Section 1 is a literature review that introduces the research status of industry scholars on NSD, SIR models, and FlipIt games. Section 2 constructs the CNADTG model and proposes an algorithm for selecting the optimal defense time strategy. Section 3 conducts a result analysis to study the defense effectiveness and defense effectiveness of the model. Section 4 summarizes the research methods and other content, pointing out the shortcomings of this study and future research directions.
To thoroughly assess the elements of A-D timing and enhance the universality and timeliness of NSD decision-making, this study adopts the ADC perspective and investigates the network structure characteristics based on CNT and TGT, thereby constructing a CNADTG model. Afterward, the respective benefits of attackers and defenders during the A-D process are quantified, which is called the A-D benefit function. At the same time, game equilibrium is solved to obtain the optimal defense time strategy selection algorithm.
The problem of network security is becoming increasingly serious, threatening the information security of the country and its people. Traditional NSD methods mostly belong to passive defense, and relying on passive defense makes it difficult to respond to rapidly changing network attacks and cannot truly guarantee the security of cyberspace. Therefore, it is necessary to develop active defense technology and conduct research on NSD decision-making. Due to the neglect of action timing factors in previous research on defense decision-making, it is not possible to dynamically select the most favorable defense action timing. When describing the real network, the internal structural characteristics of the network are not taken into account, which affects the defense effectiveness. In this study, FlipIt game theory is introduced to construct a CNADTG model for network defense timing decision-making. Firstly, based on CNT, the internal structure of the network is analyzed. Complex networks have small worldliness and scalelessness. Therefore, the SIR model is introduced to study the state transition of network nodes.
Assuming that in a network environment, the total number of nodes is . Each node has three states, first being normal state . In this state, if the attacker has not launched an attack or the system is in a defensive state, the working state of the network node is normal, and there is a possibility of being attacked by external factors and transitioning to an infected state at any time. Next is infection state . After being attacked, the normal node state changes to infection state. This node has infectivity and will attack adjacent nodes along the connection edge, the virus is spread to adjacent nodes. During this period, there is a possibility that infected nodes may be detected and repaired by the defending party. The node still has a repair state , and after repair, it has immune capacity and will not be infected again in a short period. However, its immune capacity will gradually weaken until it disappears, and the node state will become normal. When analyzing the security status of a network system, the key lies in determining the current state of network nodes. In the SIR model, when neither the attacker nor the defender takes action, the network nodes are normal and the system operates normally according to instructions. When the attacker implements an attack and controls resources, network nodes are infected. The attacker invades the system to attack the application software and servers, gradually expanding outward and ultimately causing serious damage to the system’s resources. Due to the small world nature of complex networks, key nodes in the system play a very important role in network attacks and defense. When a node is infected, it becomes a “super spreader” due to its high clustering characteristics, thereby accelerating the spread of network attacks. When the defense party takes action to control resources, the network nodes are in a normal and repair state. If the defense team repairs from a critical point, it will speed up the repair process.
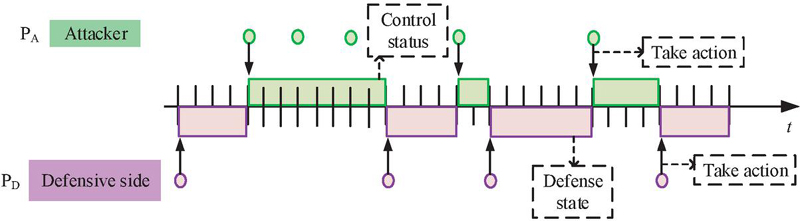
Assuming that both the A-D sides choose a time strategy, the strategy is a periodic strategy with a random process, which means that both sides initiate actions every fixed period. During the predetermined strategy cycle, the moment when the first action is initiated is randomly selected, and the entire A-D process is a non-adaptive continuous game process. According to the TGT principle, it can be found that there is a certain correlation between node state migration and ADC results. This study analyzes the state changes of network nodes at time . The attacking party’s cycle strategy and the defending party’s cycle strategy are set to and , respectively. Figure 1 is a schematic diagram of the FlipIt game.
Figure 1 Diagram of behavioral changes of A-D parties in FlipIt game.
Figure 1 shows that the two sides in the FlipIt game are the defender and the attacker, with the goal of competing for control of a single shared resource. Either party in the game can obtain control of resources at any time through “preemption” behavior, however, apart from that, both parties cannot know which party holds control of resources at any time. The act of seizing is accompanied by the transfer or retention of resource control. When , the defending party controls the system resources, the network nodes are in a normal state. According to , the attacking party initiates actions, with a time interval of between each attack. After some normal nodes are infected, they spread and spread rapidly. According to , the defending party initiates defense, with an interval of between each detection and repair of infected nodes, aiming to avoid further damage to the system and ensure system security. When A-D sides initiate actions simultaneously, their adversarial behavior cancels out and does not change the security status of network nodes. In the FlipIt game, players expend a certain amount of action cost to control public resources, with control alternating between the two actions. The rewards obtained from these actions are proportional to the time controlled by both parties, and the benefits are determined by the resource rewards and action costs. The concealment of actions during resource control and alternation ensures the optimal strategy of players in the game, which is also the biggest feature of FlipIt game.
According to the description and analysis in Figure 1, the node state transformation parameter at time is set to . indicates the state change of network nodes after ADC. represents the attacker’s control of resources, while represents a transition from to . represents the defense party controlling resources, at which point indicates that the state of the network node transitions from to . The mathematical expression of is shown in Equation (1).
| (1) |
The expression of is shown in Equation (2).
| (2) |
The above analysis indicates that in complex network environments, constructing the differential equation of node state evolution of the SIR model can obtain relevant expressions, as shown in Equation (3).
| (3) |
In Equation (3), is the probability that node is in at time . At this moment, the probability of the node being in is set to , and the probability of being in is set to , . The connection relationship between nodes and is represented as , and the connection method is set according to the construction methods of SWN and scale-free networks. If these two nodes are directly connected, ; if they cannot, then . The infection rate is set to , indicating the rate at which the attacker controls resources. The repair rate is set to , indicating the rate at which the defending party controls resources. is the recovery rate, which represents the rate at which the repaired node becomes a normal node. For the ease of calculation, and are set as constants.
The CNADTG model is represented as a six tuple . represents a gathering of players. and represent the attacking and defending sides, respectively. represents the set of policies. and represent the time strategies of the attacking and defending sides, respectively. , , , and respectively represent the number of time strategies of the attacking and defending sides, and . The time sets are and , which represent the sum of the time taken by A-D sides to control resources. and represent the total time spent by the attacking and defending parties controlling resources. The network node state variables are , , and . represents the total time. The set of network node state transition functions is , . , , and represent the transfer functions of network node ’s normal state, infection state, and repair state, , , and . The revenue function is set to . and represent the benefit functions of the attacker and the defender, respectively. After the A-D sides take action, the difference between the return they receive and the cost of the action is set as revenue. To calculate the revenue reasonably, Table 1 sets A-D parameters.
Table 1 Definition of relevant symbols
| Symbol | Name | Specific Meanings |
| Attack return | The reward obtained by the attacking party after successful attack | |
| Defense return | Rewards received by the defending party after implementing protection | |
| Attack return coefficient | The actual degree of harm caused by launching an attack | |
| Defense return coefficient | The actual degree of protection generated by the implementation of protection | |
| Total attack cost | The total cost paid by the attacking party to launch the attack | |
| Total defense cost | The total cost paid by the defense party to implement protection | |
| Attack cost | The price paid by the attacking party for launching an attack | |
| Defense cost | The price paid by the defending party for implementing a protective measure | |
| Number of attack actions | Number of actions taken by the attacking party within time | |
| Number of defensive actions | The number of actions taken by the defending party within time | |
| Attack cost utility coefficient | The actual degree of loss caused by the attack cost | |
| Defense cost utility coefficient | The actual degree of loss caused by defense costs |
In Table 1, the returns of A-D parties indicate that the ownership of system resources has changed due to the impact of network node state migration, resulting in related changes in the network system. To calculate based on the evolution of node security status, and the relevant calculation formula is obtained as shown in Equation (4).
| (4) |
To calculate , the relevant calculation formula is shown in Equation (5).
| (5) |
Assuming that the A-D sides launch actions at fixed time intervals, the returns and consumption costs obtained by both sides are related to their number of actions , as shown in Equation (6).
| (6) |
The calculation formulas for and are shown in Equation (7).
| (7) |
To simplify the calculation, , , , and are used to unify the units of attack return and action cost. The formula for is shown in Equation (2.1).
| (8) |
The calculation formula for is shown in Equation (9).
| (9) |
After completing the construction of the CNADTG model, the game equilibrium strategy is solved. For both sides of the attack, regardless of the opponent’s strategy, there is a corresponding optimal strategy in their own set of strategies. In the model, if has an optimal attack strategy and has an optimal defense strategy , then the optimal combination of A-D strategies is the Nash equilibrium solution of the model. ADC results are interdependent, and both can dynamically adjust their strategies based on their own returns. If both parties reach a game equilibrium, neither party can unilaterally adjust their strategies to increase their income, as shown in Equation (10).
| (10) |
In complex networks, due to the large number of nodes and decision space, the complexity of traditional value iteration methods increases. In the equilibrium strategy solving problem, this study transforms it into a dynamic programming problem that maximizes A-D benefits. The relevant dynamic programming equations are shown in Equation (11).
| (11) |
In Equation (11), if is the optimal solution of the equation, then the game equilibrium strategy is . By selecting MATLAB software and solving the dynamic programming problem, can be obtained, which is the maximum profit of both A-D under the balanced strategy. On this basis, can be obtained. The is the optimal defense strategy. Based on the above analysis, the optimal defense time strategy selection algorithm is obtained based on the CNADTG model. The relevant process of this algorithm is shown in Figure 2.
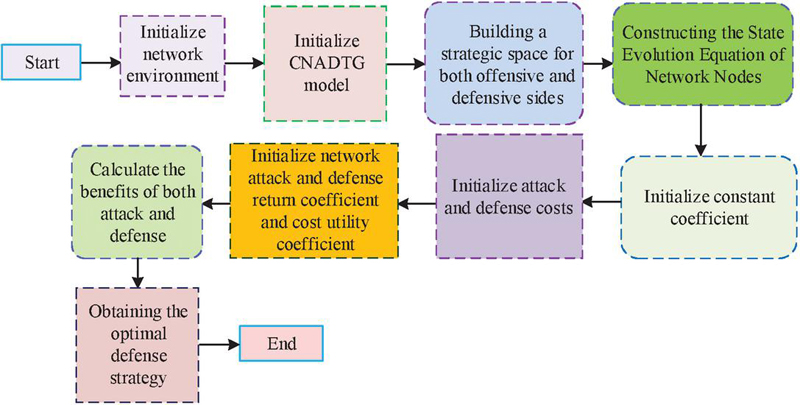
Figure 2 Algorithm related processes.
In Figure 2, the algorithm input is the CNADTG model, and the algorithm output is . In the algorithm process, the network environment is first initialized. is initialized and builds a strategic space for A-D. The network node state evolution equation is constructed. The constant coefficients , , and are initialized, processing the A-D costs and through the initialization operation and initializing the network A-D return coefficient and cost utility coefficient. According to Equations (2.1) and (9), the profits of A-D parties are calculated. Based on Equation (11), is solved and is obtained. The value of the attack defense equilibrium strategy solved is the most stable solution in the game model. Therefore, under the optimal attack defense time strategy, any deviation from the equilibrium strategy by either party will lead to a decrease in their game returns. The design of algorithms not only reflects the behavioral space of both the offensive and defensive sides but also calculates the optimal strategies and benefits of both sides.
The effectiveness of the research and construction model is analyzed, and SWNs, scale-free networks, and MATLAB platforms are selected for numerical analysis of the model. After construction, the corresponding complex network environment is obtained, with a total number of network nodes of 1,000 [21]. Table 2 shows the detailed parameters of the experiment.
Table 2 Related parameter settings
| Project | Parameter | ||||||
| Revenue function | |||||||
| 1 | 1 | 1 | 1 | 1 | 1 | ||
| Network evolution parameters | |||||||
| 100 | 0.8 | 0.2 | 0 | 0.1 | 0.1 | 0.1 | |
| Total number of nodes | |||||||
| 1000 | |||||||
Table 2 shows that in a network environment with a total of N nodes, each node has three states: normal state “S”, infected state “I”, and repaired state “R”. The selection of 1,000 nodes for network scale takes into account the computational time required by the properties of large-scale computer networks, ensuring not only the rationality of time but also exploring the impact of network structure on its robustness. In addition, a network of 1,000 nodes can demonstrate significant performance advantages in experimental design and has applicability in result analysis. In the initial state, the ratio of the three network node states is , and the time interval for the A-D game is set to [0,100]. Due to the structure of FlipIt game and CNADTG model, the study uses a simulated network environment to test network attacks. However, the internal network in the simulated network environment is mainly composed of servers and several user hosts, which are often the main targets of attackers. The external network is mainly a public network, and attackers will target the vulnerabilities and terminals of its servers to cause damage. In addition, firewalls and virus detection systems can perform physical isolation and qualified detection of attacks on internal networks, providing a reference for defense measures. Therefore, based on the description of vulnerability information in the national information security vulnerability database and other systems, vulnerability scanning tools are used to scan the experimental network environment and explore the security vulnerabilities of nodes. The relevant information obtained is shown in Table 3.
Table 3 Related vulnerability information
| Network Node | Operating System | Vulnerability Information | CVE Number |
| FTP server | Linux | Code injection vulnerability | CVE-2022-33980 |
| FTP server | Linux | Operating System Command Injection Vulnerability | CVE-2022-31138 |
| File server | Linux | Buffer Overflow Vulnerability | CVE-2020-20746 |
| File server | Linux | Information leakage vulnerability | CVE-2022-31139 |
| File server | Linux | Path traversal vulnerability | CVE-2021-40668 |
| Web server | Linux | Cross Site Scripting Vulnerability | CVE-2022-22502 |
| Web server | Linux | Vulnerability in permission and access control issues | CVE-2022-1874 |
| Database server | Linux | Buffer Overflow Vulnerability | CVE-2020-25211 |
| User | Linux | Authorization issue vulnerability | CVE-2022-20126 |
| User | Linux | Vim Security Vulnerability | CVE-2022-2345 |
| User | Linux | Deep assign security vulnerability | CVE-2021-40663 |
Table 3 shows the security vulnerability information under different network nodes. There are also different vulnerability information under the same node, such as information leakage vulnerabilities, path traversal vulnerabilities, etc. Table 4 provides information on relevant offensive and defensive behaviors based on the MIT offensive and defensive behavior information database.
Table 4 Attack behavior information
| Serial Number | Attack Strategy | Related Description |
| 1 | Install listener program | Install listener program |
| 2 | Steal account and password | Stealing account passwords |
| 3 | Install delete trojan | Implant Delete Trojan |
| 4 | Violent crack password | Violent password cracking |
| 5 | Remote buffer overflow | Remote buffer overflow |
| 6 | Send abnormal data to root | Send abnormal data to the root |
| 7 | Remote code injection | Remote code injection |
| 8 | Shutdown database server | Shutdown Database Server |
| 9 | Homepage attack | Web attacks |
| 10 | Attack address blacklist | Attack address blacklist |
Table 4 shows 10 attack strategies, such as installing listening programs, implanting and deleting trojans, and web attacks. On this basis, a comparative analysis is conducted on the effectiveness and effectiveness of defense strategies. Based on the CNADTG model and its optimal defense strategy selection algorithm, the behavior and periodic strategy space of both attackers and defenders are constructed in a simulation environment. The network model calculates the benefits and numerical analysis of attack behavior information through constant coefficients to obtain the optimal defense strategy, thereby achieving the optimal stable solution of the game model.
To verify the effectiveness of the research model, complex network selection and model numerical analysis were conducted. By setting experimental parameters, a comparative analysis of defense effectiveness and defense effectiveness was conducted based on the above security vulnerability information and A-D behavior information.
In the simulation network environment and the A-D behavior of the CNATTG model, the infection rate , repair rate , and recovery rate of network nodes are set to 0.1, and the A-D return coefficient (), cost coefficient (), and cost utility coefficient () are all set to 1. Combined with the time interval of A-D games, the information in the information security vulnerability database is systematically analyzed to test the network model’s defense performance against security vulnerabilities. Based on the relationship between the size of and , the effectiveness of strategic defense in and situations is analyzed. and are set to 5 and 3, respectively. According to the equation in Equation (3), the infection rate and recovery rate of its network nodes are both set to 1 to ensure the effectiveness of network defense analysis and reflect the node changes in the SWN. The changes in node state changes of the SWN at different times and node degrees k are shown in Figure 3.
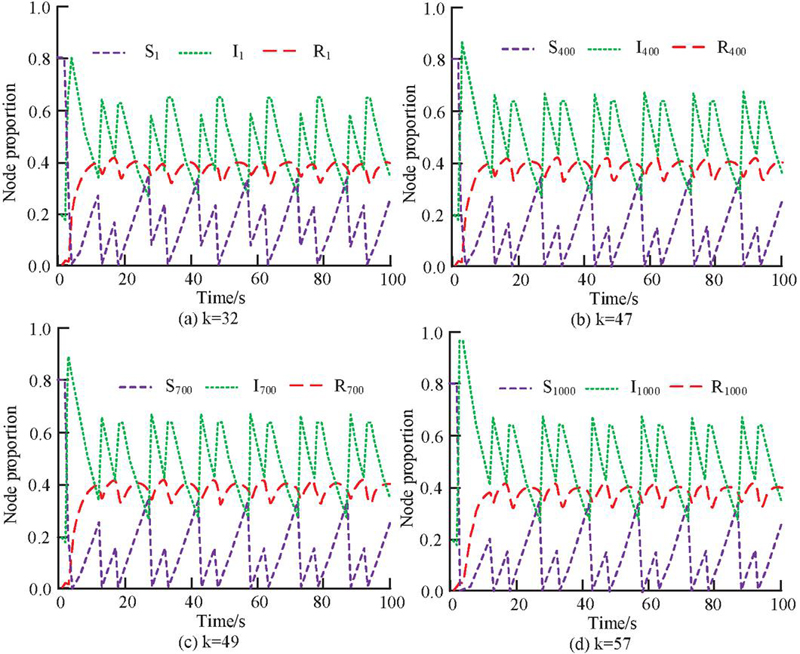
Figure 3 Changes in the state of SWN nodes when and .
In the four sub-graphs of Figure 3, given the A-D strategy, the state changes of different network nodes are basically consistent. Overall, at the same time, the proportion of infected nodes (PoIN) “I” is the highest, followed by the proportion of repair nodes “R”, and the proportion of normal nodes “S” is relatively minimum. In Figure 3(a), when the time is 40 seconds, the proportion of S is 0.308, which is 0.092 less than R, and the latter is 0.400. When the time is 60 seconds, the proportion of I is 0.448, which is greater than that of nodes in the other two states. In Figures 3(b) to 3(d), when the time is 40 seconds, the proportion of R is 0.405, which is 0.003 more than R, 0.006 more than R, and 0.247 more than S. The comprehensive results show that in the strategy with an attack cycle of 5 and a defense cycle of 3, the evolution of node status over time for nodes 1, 400, 700, and 1000 in the SWN environment is roughly the same. This is because the average path length of nodes in the SWN is short and the clustering coefficient is high, resulting in a relatively uniform distribution of nodes and no hub points. The internal structural characteristics are basically the same as those of random and regular networks, so the change in node status is not closely related to the network structure.
In addition, under the same A-D cycle strategy, the node state changes of the scale-free network analyzed at different times and k values are shown in Figure 4.
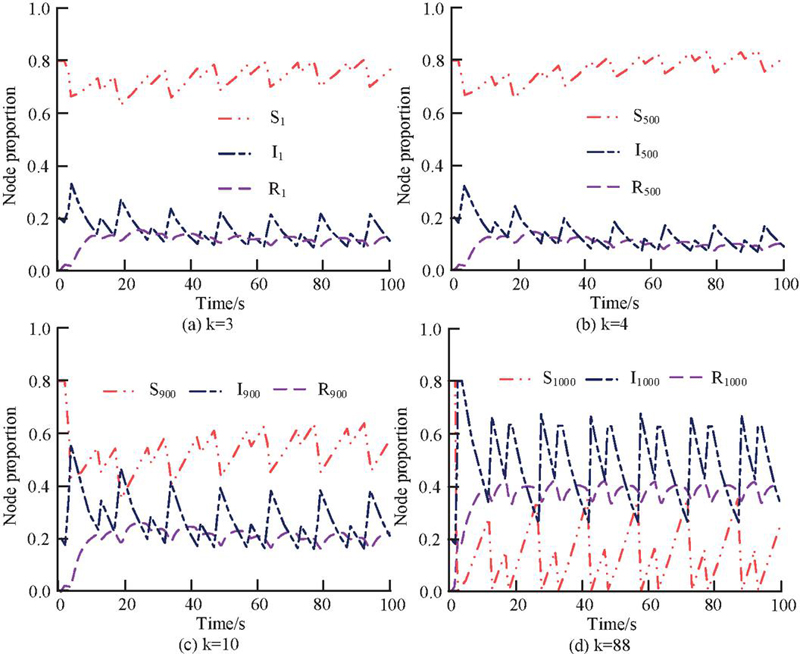
Figure 4 Changes in the state of scale-free network nodes when and .
In Figures 4(a) and 4(b), when attacking or repairing the 1st and 500th nodes, the k values of the two nodes are small, and the proportion of S and S ranges from 0.660 to 0.800. The proportion of I and Iis both below 0.4, and gradually decreases with time, then stabilizes at around 0.1. Finally, the proportion of R and Rrapidly increases before 20 seconds, with a maximum of no more than 0.2. As time goes by, the proportion of repair status for the first and 500th nodes remains relatively stable at around 0.1. In Figure 4 (c), the normal state of the 900th node changes significantly over time, with the overall proportion decreasing from 0.8 to around 0.4. At the same time, the PoINs is between 0.2 and 0.6, and the overall trend is slowly decreasing. The repair status of the nodes shows more significant changes compared to Figures 4(a) and 4(b), and remains stable at around 0.2 over time. In Figure 4(d), when the 1000th node is attacked, as it belongs to the central node, the node has a larger k value and a faster infection rate. Within 1 to 3 seconds, the proportion of S rapidly decreases from 0.800 to 0.000. After implementing the repair, the proportion of S shows periodic changes. Comparing Figures 3 and 4, it is found that the network environment affects the evolution of network security states. This is due to the power-law distribution of nodes in scale-free networks, where most nodes have low connectivity and slow network attacks or system repairs at that node, while a few hub nodes have high connectivity and fast network attacks or system repairs at that node. This structural feature also makes scale-free networks both robust and vulnerable.
Afterward, and are set to 3 and 4 respectively, and the analysis of the node state changing in the SWN under this cycle strategy is shown in Figure 5.
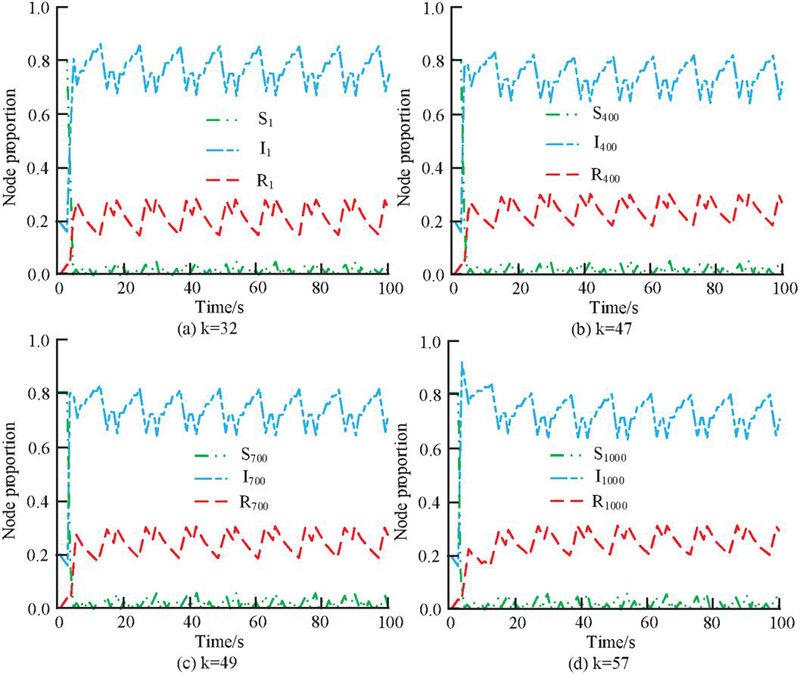
Figure 5 Changes in the state of SWN nodes when and .
In Figure 5, when the attack cycle is less than the defense cycle, the attack party’s frequency of action increases and the infection speed increases. When the PoIN varies periodically, compared to Figure 3, the PoIN in Figure 5 increases, with a fluctuation range of 0.670 to 0.850. In Figure 5(a), when the time is 80 seconds, the proportion of S is 0.000, which is 0.257 less than R, and the latter is 0.257. When the time is 90 seconds, the proportion of I is 0.752. The node state in Figure 5(b) is basically consistent with Figure 5(a), where as time increases, the proportion of S is slightly lower than that of S, while the changing trends of I and R are consistent with the situation of the first node. This indicates that the states of the first node and the 400th node are in a stable periodic change. In Figure 5(c), when the time is 20 seconds, the proportion of R is 0.264, which is 0.462 less than I, and the latter is 0.726. In Figure 5(d), the proportion of S has exceeded 0.8, and the changes in the proportion of I and Rare basically consistent with Figure 5(c). At the same time, the states of all four nodes undergo periodic changes. This is because if either side’s actions are higher than the other, it will cause a corresponding change in the PoINs. When the behavior of the defending party is higher than that of the attacking party, the PoINs is relatively low, and vice versa, the proportion is relatively high. Comparing Figures 3 and 5, different time strategies will significantly affect the state changes of SWN nodes.
Finally, under the same strategy with an attack cycle of 3 and a defense cycle of 4, the state changes of different nodes in the analyzed scale-free network are shown in Figure 6.
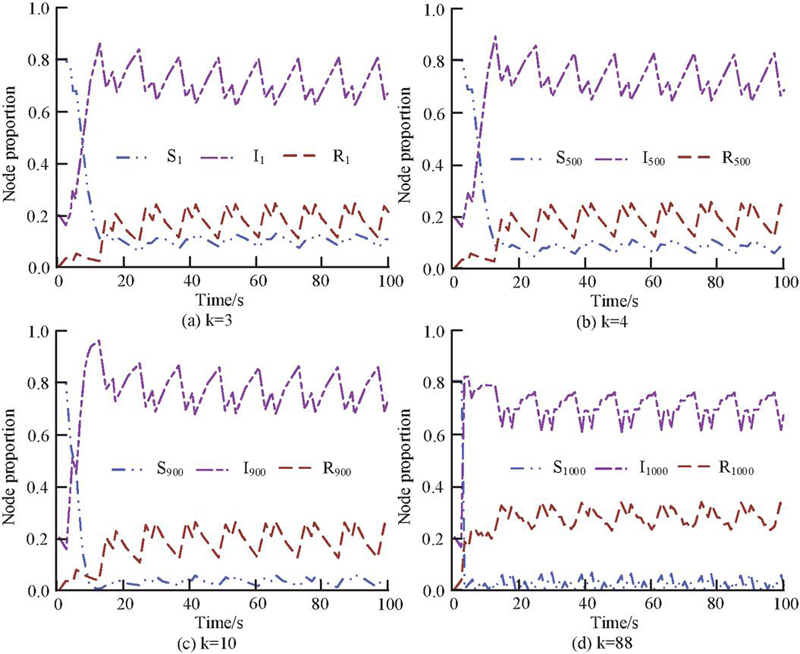
Figure 6 Changes in the state of scale-free network nodes when and .
In Figure 6, when the node state tends to stabilize and its changes are periodic, the proportion of common infected nodes ranges from 0.640 to 0.680, and the proportion of central infected nodes ranges from 0.610 to 0.750. In Figure 6(a), when the time is 40 seconds, the proportion of R is 0.675, while the proportion of I is 0.223. At the same time, the node state in Figure 6(b) is basically consistent with Figure 6(a). The states of the first and 500th nodes are relatively stable and less affected by the degree of network nodes. In Figure 6(c), the proportion of I is significantly higher than that in Figures 6(a) and 6(b), while the change in S with time is relatively small and the proportion of nodes is below 0.1 after 20 seconds. In Figure 6(d), the proportions of S and I are 0.024 and 0.746, respectively, with the former being 0.722 smaller than the latter. The proportion changes of nodes S, I, and R are significantly different from the previous three graphs. Among them, the proportion change of I is relatively stable and periodic. After 20 seconds, the proportion of the node state is below 0.8. The proportion of R is generally between 0.2 and 0.4, while the proportion range of S is the smallest. Finally, compared with the results in Figure 4, Figure 6 improves the node infection rate and the PoINs. This is because the time strategies of the two are different. The results in Figure 6 indicate that when the attacker’s action frequency is fast enough, the infection rates of both ordinary nodes and central nodes significantly increase, and the floating range is correspondingly reduced. Consequently, it is evident that disparate temporal strategies exert a substantial influence on the alterations in network node status and are efficacious.
This study analyzes the defense effectiveness of the model and the periodic strategy of the fixed attacker. The is set to 14 and the defense benefits under different defense strategies is analyzed with different values, as shown in Figure 7.
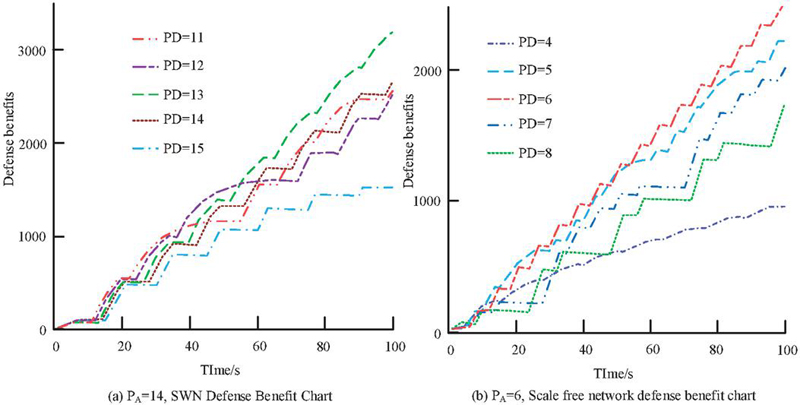
Figure 7 Defense benefits under different defense strategies.
In Figure 7, with different values, there are differences in the corresponding defense benefits. As time increases, the corresponding defense benefits increase. In Figure 7(a), at a time of 100 seconds, the defense benefit is highest at 3180.95 with an value of 13. The defense benefit is the smallest at a value of 15, which is 1519.05. In Figure 7(b), at a time of 100 seconds, the defense benefit is highest at 2487.27 with an value of 6. The defense benefit is the lowest at 951.63 with a value of 4. From this, increasing the A-D game time will improve the benefits of defense testing strategies. The dynamic time adjustment strategy has a more significant increase in defense benefits, with a value of 161.37%, which is much higher than the fixed period defense strategy method. This further proves that the strategy of dynamically adjusting time can achieve maximum defense benefits.
The defense effectiveness under different attack are strategies analyzed, with red dots representing the defense benefits of the optimal defense strategy, as shown in Figure 8.
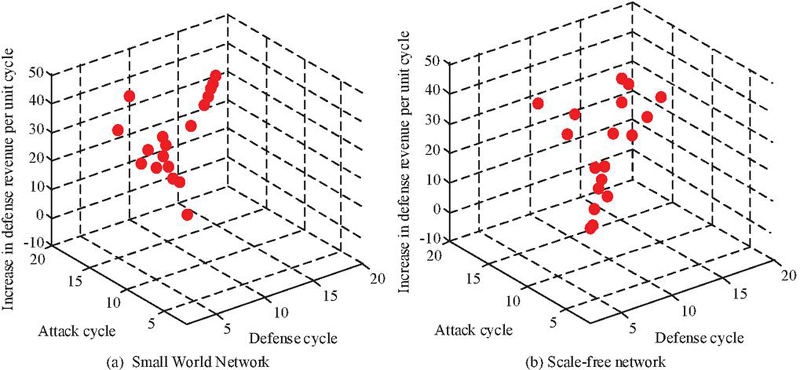
Figure 8 The defense effectiveness results of different network environments under A-D cycle strategies.
In Figure 8(a), when values are 2, 3, 4, 5, and 6, the corresponding optimal values are 2, 2, 2, 3, and 2, respectively. This indicates that when the frequency of action of the attacking party is at a high level, the defending party can increase the frequency of action to prevent further damage to the system. When the value is 14, the optimal value is 13, and the maximum increase in defense per unit cycle is 35.89. This validates the effectiveness and correctness of the results in Figure 8 (a). In Figure 8(b), when the values are 2, 3, 4, 5, and 6, the corresponding optimal values are 2, 3, 4, 6, and 6, respectively. Compared to SWNs, scale-free networks have stronger robustness as the defense frequency of the defending party increases with the increase of attack frequency.
Finally, based on the attack behavior in the real-world network environment, the study selects the dataset from the Computer Science Institute of Castillay (CSIC) and combines it with other advanced algorithm models for detection. The results are shown in Table 5.
Table 5 Detection results of different algorithm models on the CSIC dataset
| Algorithm Model | Detection Rate (%) |
| Image segmentation method | 94.57% |
| Multi-classifier | 97.64% |
| Convolutional Neural Network | 98.79% |
| K-cluster analysis | 98.52% |
| This article’s algorithm | 99.36% |
According to Table 5, the current advanced methods have a detection rate of over 97% for NSD, with the multi-classifier algorithm model having a detection rate of 97.64% and the K-cluster analysis method having a detection rate of 98.52%. The highest detection result of the A-D algorithm model in this article is 99.36%, which proves the superiority of the CNATTG model based on the A-D time strategy selection algorithm and game theory.
To fully consider the timing of A-D and improve the universality and timeliness of NSD decision-making, this study combined CNT and TGT from the perspective of ADC to study the network structure characteristics and constructed a CNADTG model. By quantifying the A-D benefit function and solving the game equilibrium, the optimal defense time strategy selection algorithm was obtained. The results showed that there were differences in the state changes of network nodes under different complex networks and node degrees. When and were 5 and 3, respectively, in a SWN, the k value was 32. When the time was 40 seconds, the proportion of S was 0.308, 0.092 less than R, and the R is 0.400. Under the same time strategy, in a scale-free network, when attacking or repairing the 1st and 500th nodes, the k values of both nodes were small, and the proportion of S and S ranged from 0.660 to 0.800. Dynamically adjusting time strategies could affect defense benefits. In a SWN, was 14, and at a time of 100 seconds, the maximum defense benefit was 3180.95 with a value of 13. The minimum defense benefit for a value of 15 was 1519.05. Therefore, it indicates that the dynamic time adjustment strategy will significantly improve defense benefits, thereby verifying the effectiveness and feasibility of the research model. However, NSD methods that only focus on time strategies cannot meet the synchronization of network A-D actions, which poses certain risks to the implementation of A-D strategies. In addition, the amount of experimental data collected in the research is relatively small, and the experimental design and result analysis are not rich enough. Therefore, in subsequent research, it is necessary to consider the consistency between time and A-D actions, and further improve the universality and practicality of network defense models.
[1] Sikora L S, Lysa N K, Tsikalo Y I. and Fedevych O Y. System-Information and Cognitive Technologies of Man-Made Infrastructure Cyber Security. Journal of Cyber Security and Mobility. 2023, 12(03), 389–414.
[2] Del Rey A M, Vara R C, Gonzalez S R. A computational propagation model for malware based on the SIR classic model. Neurocomputing, 2022,484(May 1):161–171.
[3] Zhang Y, Xu X, Shi Y. Construction and Analysis of Network Cloud Security Situation Awareness System Based on DBN-DE Algorithm. Journal of Cyber Security and Mobility. 2024, 13(03):439–60.
[4] Xing H, Liu Y. Graph attention network for Car-Following Model under game between desired and real state. IET intelligent transport systems, 2022,16(6):800–812.
[5] Yu Y, Peng W, Lu J. Wireless network security game based on conditional privacy policy. Computer communications, 2022,184(Feb.):96–106.
[6] Hussain S S, Razak M F A, & Firdaus A. Deep Learning Based Hybrid Analysis of Malware Detection and Classification: A Recent Review. Journal of Cyber Security and Mobility, 2023, 13(01), 91–134.
[7] Devalk K, Elmqvist N. Riverside: A design study on visualization for situation awareness in cybersecurity. Information visualization, 2024, 23(1):40–66.
[8] Zhu Z, Chen M, Zhu Z Y. Effective defense strategies in network security using improved double dueling deep Q-network. Computers & Security, 2024, 136(1):103578–103589.
[9] Al-Eiadeh M R, Abdallah M. PR-DRA: PageRank-based defense resource allocation methods for securing interdependent systems modeled by attack graphs. International Journal of Information Security, 2025, 24(1):1–37.
[10] Jena S, Padhy N P. Cyber-Secure Global Energy Equalization in DC Microgrid Clusters Under Data Manipulation Attacks. IEEE Transactions on Industry Applications, 2023, 59(5):5488–5505.
[11] Teng Z, Zhu S, Li M, Yu L, Gu J, Guo L. Wireless sensor network security defense strategy based on Bayesian reputation evaluation model. IET Communications, 2024, 18(1):55–62.
[12] Gomez-Aguilar J F, Sabir Z, Saad U K M. Neuro-Evolutionary Computing Paradigm for the SIR Model Based on Infection Spread and Treatment. Neural processing letters, 2023, 55(4):4365–4396.
[13] Al-Harbi O, Hamed A. A dual-stage deep learning model based on a sparse autoencoder and layered deep classifier for intrusion detection with imbalanced data. International Journal of Sensor Networks, 2024, 45(2):74–86.
[14] Alhaj T A, Siraj M M, Zainal A, Idris I, Nazir A, Elhaj F, Darwish T. An effective attack scenario construction model based on identification of attack steps and stages. International Journal of Information Security, 2023, 22(5):1481–1496.
[15] Harishkumar S, Bhuvaneswaran R S. Enhanced DGA detection in Botnet traffic: leveraging N-Gram, topic modeling, and attention BiLSTM. Peer-to-Peer Networking and Applications, 2025, 18(1):1–20.
[16] Rehman Z, Gondal I, Tari G Z. Proactive defense mechanism: Enhancing IoT security through diversity-based moving target defense and cyber deception. Computers & Security, 2024, 139(4):103685–103700.
[17] Chui K T. Sustainable IoT Security in Entrepreneurship: Leveraging Univariate Feature Selection and Deep CNN Model for Innovation and Knowledge. Sustainability, 2024, 16(14):1–13.
[18] Liu M, Zhang Z, Chen Y, Ge J, Zhao N. Adversarial Attack and Defense on Deep Learning for Air Transportation Communication Jamming. IEEE Transactions on Intelligent Transportation Systems, 2023, 25(1):973–986.
[19] Abolfathi M, Inturi S, Jafarian B K H. Toward enhancing web privacy on HTTPS traffic: A novel SuperLearner attack model and an efficient defense approach with adversarial examples. Computers & Security, 2024, 139(4):103673–103687.
[20] Baek F, Kim D, Park S, Kim H, Lee S. Conditional Generative Adversarial Networks with Adversarial Attack and Defense for Generative Data Augmentation. Journal of computing in civil engineering, 2022, 36(3):4022001–4022015.
[21] Smarandache F. Plithogeny, plithogenic set, logic, probability and statistics: a short review. Journal of Computational and Cognitive Engineering, 2022, 1(2):47–50.

Zinan Zhu obtained her Bachelor’s Degree in Computer Science and Technology from Jilin Normal University in 2005, and earned a Master’s Degree in Control Engineering from Jilin University in 2012. Currently, she works at the Information Center of Changchun Polytechnic, where she is responsible for network security-related operations. Her research focuses on computer technology, network security technology, and computer education.

Lin Zhou graduated from Beijing Normal University with a doctoral degree in education management (2019). At present, she is an associate professor and director of the Department of Employment and Entrepreneurship in the College of Innovation and Entrepreneurship of Zhongshan Polytechnic. She is a member of the Employment and Entrepreneurship Guidance Expert Group of China Employment Network and a mentor of innovation and entrepreneurship in Guangdong Province. She has published more than 20 papers, published 2 monographs, compiled 3 textbooks, and presided over more than 10 provincial teaching and scientific research projects. Her research fields include education management informationization, network curriculum development, innovation and entrepreneurship education, career and employment guidance, etc.
Journal of Cyber Security and Mobility, Vol. 14_2, 311–338.
doi: 10.13052/jcsm2245-1439.1423
© 2025 River Publishers