A Deep Reinforcement Learning Framework for Attack-Fault Tree Analysis and Security Assessment in Power Systems
Chengzhe Liu1, Xiaochen Yang1, Manpo Li1, Tianqu Tong1, Long Yin2,* and Yating Jiang2
1Northeast Branch of State Grid Corporation of China, Shenyang 110180, China
2Software College, Northeastern University, Shenyang 110169, China
E-mail: 2110499@stu.neu.edu.cn
*Corresponding Author
Received 17 October 2024; Accepted 11 May 2025
Abstract
Cyber-physical systems (CPS), such as power plants and critical infrastructure, face growing safety and security risks due to increased interconnectivity and automation. To address these challenges, we propose a framework that combines deep reinforcement learning (DRL) and Bayesian probability to model and assess vulnerabilities and attack paths. Leveraging Deep Q-Learning Networks (DQN) and cumulative probability, our method improves the identification and prioritization of effective attack paths. We also introduce the attack-fault tree (AFT) model to evaluate interactions between safety and security events. Using Uppaal SMC and statistical timed automata, we simulate dynamic scenarios and generate probabilistic estimates of metrics such as attack cost, duration, and impact. By analyzing both current and hypothetical scenarios, our approach supports informed, adaptive defense strategies for resilient CPS.
Keywords: Attack-fault tree (AFT), deep reinforcement learning, power system security, Bayesian probability theory.
1 Introduction
With the growing digitalization of energy infrastructure, power systems have become prime targets for cyber threats. The International Energy Agency (IEA) reports that cyberattacks on energy systems more than doubled from 2020 to 2022, with utilities facing an average of 1,101 weekly attacks globally in 2022 [1]. That year, 48 successful cyberattacks targeted Europe’s energy infrastructure, and the share of targeted attacks in the EU rose from 9.8% to 46.5% in just six months of 2023 [2]. These trends highlight the urgent need for tailored cybersecurity frameworks for power systems.
Penetration testing is widely used to uncover vulnerabilities in industrial control systems, but many tools still rely heavily on expert input. As attacks grow more complex, effective simulation methods have become vital for anticipating threats and formulating defense strategies, especially since rule-based systems often fall short.
Reinforcement learning (RL) offers a more adaptable defense by learning from data and responding to emerging threats in real time. Research increasingly integrates RL and deep learning with intrusion detection and attack path discovery, aiming to trace threats from entry point to target in constrained environments.
Many attack path discovery methods use MULVAL [3], an open-source tool for generating attack trees from network topology. For example, Hu et al. \cite{hu2020automated} used MULVAL with deep RL to automate penetration testing, marking the first full RL-based vulnerability exploitation system. However, their model assumed uniform action success rates, overlooking path-specific variations.
The attack-fault tree (AFT) method captures the interplay between insecure components and failure events but depends on accurate modeling of attack paths. Traditional manual tree construction often misses many realistic attack scenarios.
To address this, we propose a DRL-based approach to identify optimal attack paths within system attack graphs. These paths are enriched with real-world penetration testing data, enabling the calculation of failure probabilities and success rates. The resulting AFT model supports analysis of attack lethality and detectability to assess overall system impact.
The main contributions of this article can be summarized as follows:
• A method combining Deep Q-Learning and Bayesian probability to score attack matrices and identify optimal paths;
• Evaluation of the approach via power system network simulations for AFT analysis and security assessment;
• Use of Uppaal SMC to model and estimate safety and security metrics under accidental and malicious disruptions.
Paper organization: Section 2 reviews related work in RL and AFT. Section 3 details the proposed methodology. Section 4 presents simulation results and analysis. Section 5 concludes with key findings and future implications for critical infrastructure security.
2 Related Works
Recent advances in machine learning have demonstrated significant potential in enhancing both cybersecurity and control mechanisms within critical cyber-physical systems. For instance, Ahmari et al. [4, 5] introduced data-driven coordination strategies for UAV-UGV systems and identified security vulnerabilities in autonomous landing procedures. Complementing this, Wang et al. [6] proposed a structure-preserving stability analysis method tailored for power systems, while Banitaba et al. [7] employed stochastic computing to strengthen neural network robustness. Meanwhile, Sheida et al. [8] focused on developing secure control frameworks for hybrid DC microgrids.
Within this broader context, Deep Reinforcement Learning (DRL) has emerged as a powerful tool for intelligent decision-making in power and energy systems. Elsayed et al. [9] demonstrated the effectiveness of DQN in optimizing resource allocation in dense network environments. Extending this line of research, Zhang et al. [10] and Wei et al. [11] applied DRL techniques for optimal PMU placement and adaptive line reclosing, respectively. Other researchers have adopted algorithms such as DDPG and distributed DRL to defend against false data injection (FDI) attacks [12, 13]. To further enhance cybersecurity, Etezadifar et al. [14] proposed a dual replay memory mechanism for NILM systems, and Sahu et al. [15] integrated OpenDSS with SimPy to develop RL-based grid control solutions. Additionally, adversarial training and multi-agent RL methods have been explored to improve system resilience against dynamic threats [16–20].
In parallel with these algorithmic innovations, Attack-Fault Tree (AFT) models remain a foundational tool for quantitative safety-security co-analysis. Kumar et al. [21] and Liu et al. [22] integrated AFTs with formal verification to evaluate cyber risks in railway systems. Building on this foundation, recent contributions have introduced advanced AFT modeling techniques such as the AFMT framework [23], parametric sensitivity analysis [24], and automated AFT generation from system specifications [25]. Furthermore, new methods have been proposed for querying AFTs and conducting trade-off analysis between safety and security objectives [26, 27].
When applied specifically to power systems, fault and attack modeling has been further enriched through domain-specific adaptations. Volkanovski et al. [28] and Song et al. [29] incorporated fault tree logic with power flow analysis and load prioritization strategies. At the same time, Bayesian extensions of AFT have been proposed to address SCADA system vulnerabilities, as demonstrated by Meyur [30] and Tian et al. [31].
Despite these advances, a notable gap remains: most existing research addresses safety and security in isolation, and AFT modeling often depends on manual, expert-driven construction processes that lack scalability. To address these limitations, we propose a novel AFT-based analysis framework that integrates deep reinforcement learning with Bayesian inference. This approach aims to automate the construction and evaluation of AFTs, enabling more efficient, adaptive, and comprehensive assessment of cyber-physical security risks in modern power systems.
3 Proposed Attack Tree Generation Approach
3.1 Framework Architecture
To enable analysts to accurately assess the capabilities of potential attackers, we employ a Bayesian probability and reinforcement learning-based approach to construct an attack tree suited to the power system context. Initially, we use vulnerability scanning tools like MASSCAN and Nmap to scan system ports, followed by routing analysis software to detect system topology based on the service ports and IP addresses obtained from the scans. Figure 1 shows the architecture of our automated attack tree construction system.
3.2 Bellman Optimality Equation
Since reinforcement learning focuses on sequential decision-making, DQN employs the Bellman optimality equation to guide attack path selection. By learning which actions yield the highest cumulative rewards, DQN iteratively refines its strategy to align with an adversary’s objectives.
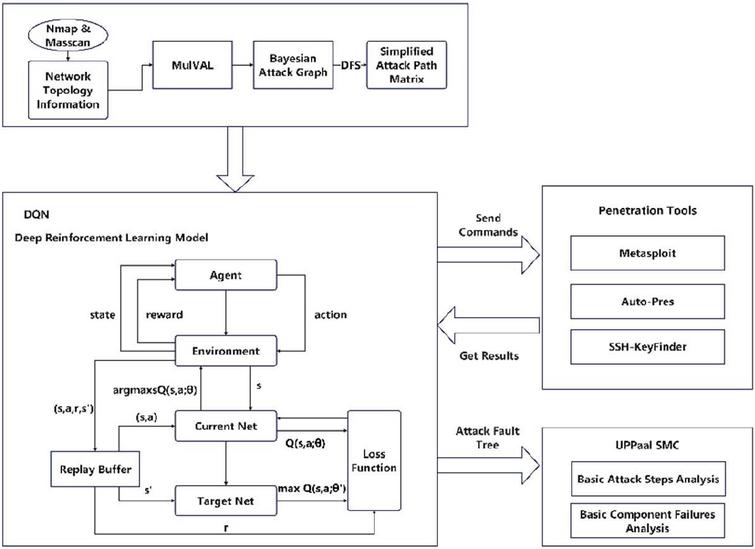
Figure 1 Architecture of the automated attack tree construction system.
The value function is defined as:
| (1) |
where is the total discounted reward from time step onward, and denotes the transfer probability with S.
The Q-function further evaluates the expected return for taking action in state :
| (2) |
Under a given policy , the value function can be expressed as:
| (3) |
The optimal value function and corresponding optimal policy are defined as:
| (4) |
Using these, the Bellman optimality equation for the Q-function becomes:
| (5) |
In our deterministic MDP setting, where each action leads to a unique next state, this simplifies to:
| (6) |
3.3 Deep Q-Learning
Q-Learning is a value-based reinforcement learning algorithm that learns a policy to maximize expected future rewards by estimating a Q-function, , representing the expected return for taking action in state .
In Deep Q-Learning, this function is approximated by a neural network , where denotes the learnable parameters. The network takes state as input and outputs a vector , where each element represents the Q-value for an action . The action with the highest Q-value is selected, transitioning the system to state , and the process repeats.
The loss function is based on the Bellman optimality equation, or arbitrary neighboring steps , we have the loss function in Equation (7):
| (7) |
Where is the Q-value from the target network, a separate neural network with parameters periodically synced with the online network’s parameters . This design stabilizes learning by decoupling target estimation from action selection. Minimizing the loss updates to better approximate the optimal Q-function .
During training, the DQN interacts with the environment using the online network, storing experience tuples in a replay buffer. Mini-batches are sampled from this buffer to compute the loss and update via gradient descent.
3.4 Bayesian Conditional Probability Theorem
We use Equation (8) to calculate each node’s intrinsic attack probability based on its CVSS score.
| (8) |
CVSS is an open standard for quantifying vulnerability severity on a 0–10 scale, grouped into four risk levels: low, medium, high, and critical. We use CVSS 3.1, which improves exploitability and impact metrics. In the CVSS framework, the following four indicators are used to measure exploitability:
• AV(Attack Vector): Measures how remotely a vulnerability can be exploited. Values: Network (0.85), Adjacent (0.62), Local (0.55), Physical (0.2).
• AC(Attack Complexity): Assesses the difficulty of exploitation. Values: Low (0.77), High (0.44).
• PR(Privileges Required): Indicates the permissions needed for exploitation (scope unchanged). Values: None (0.85), Low (0.62), High (0.27).
• UI(User Interaction): Reflects the need for user involvement. Values: None (0.85), Required (0.62).
According to Bayes’ theorem, let be the cumulative probability of node S, e its predecessors with cumulative probability , and its intrinsic rate. The cumulative probability for AND and OR nodes is calculated as follows.
• Under the AND condition, node S is activated only if all parent nodes are used. Its cumulative probability is given by Equation (9).
| (9) |
• Under the OR condition, node S is activated if any parent node is used, as shown in Equation (10).
| (10) |
• For attacked nodes, the predecessor’s posterior probability is calculated using Equation (11).
| (11) |
3.5 Deep Q-Learning Network Training
The DQN agent learns optimal attack paths by navigating a matrix that abstracts the Bayesian attack tree. Exploitability scores serve as inputs, and training simulates an attacker evaluating each step’s success likelihood. A softmax function smooths action selection, guiding the agent toward the most effective path to compromise the target system.
Each vulnerability’s attack score is computed using Equation (12), which incorporates CVSS metrics. The exploitability score (capped at 10) adjusts the base score to reflect the ease of exploitation.
| (12) |
The DQN framework proceeds as follows: convert the MULVAL attack graph into a loop-free Bayesian attack tree, then apply Depth-First Search (DFS) to identify all potential paths to the target. For each path, the agent calculates cumulative probabilities and node scores, then constructs a simplified attack score matrix. This matrix is input into the DQN model, which evaluates total rewards across paths. The path with the highest reward and fewest steps is selected, and the model is iteratively trained to improve accuracy.
The agent updates Q-values using the Bellman optimality equation to reflect expected future rewards. Through repeated exploration, the agent refines its Q-values by selecting paths, receiving rewards, and updating accordingly, ultimately converging on the most efficient attack path. After training, the DQN model converges on the path with the highest total reward. It prioritizes actions with the greatest immediate and future rewards, simulating an intelligent attacker that efficiently identifies the optimal path to compromise the target system.
4 Experiments
We evaluate the proposed approach by constructing Bayesian attack trees for a small power system, integrating them with a fault tree to form an attack-fault tree, and analyzing failure impacts under various attack scenarios using UPPAAL SMC.
4.1 A Case of Small Power System
Figure 2 shows the network topology of a small power system, consisting of a web server, intelligent fault management (IFM) nodes, and intelligent energy management (IEM) nodes. The IEM node, classified as a “WorkStation,” controls subnet load equipment (generators, DC converters, and storage devices). If compromised, it can disrupt power supply and cause overloads.
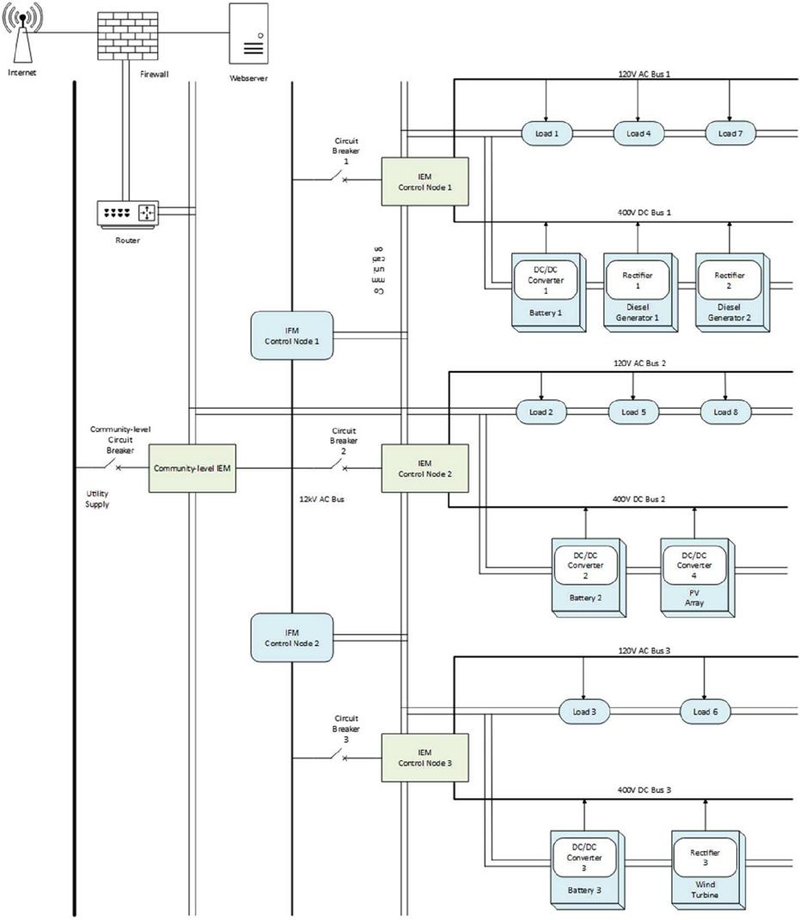
Figure 2 A local framework example of the smart power system.
IFM nodes monitor IEMs and substation equipment. During high-voltage line faults, the IFM reconfigures the system to maintain power delivery. It communicates with IEMs over a local LAN and functions as a “file server” using FTP. A compromised IFM can be exploited to implant Trojans, gain system control, and send forged messages to IEMs.
In the broader network, the IFM sends configuration files and commands to IEMs via NFS. The IFM acts as the NFS server, while IEMs mount shared files for access and can upload modified data for synchronization.
We use Nmap and Masscan to initialize vulnerability, port, and protocol data for the web and file servers. Table 1 details host configurations. The file server uses FTPS over TCP, chosen for infrastructure compatibility. Then we use the proposed DQN-based method to find the optimal attack path to compromise IEM nodes.
Table 1 Host configuration information
| Host | Vulnerability | Port | Product | Protocol |
| Web Server | CVE-2021-36749 | 443 | Apache | HTTP/HTTPS |
| File Server | CVE-2017-17405 | 20 | – | FTPS |
| Workstation | – | – | – | HTTP/HTTPS/FTPS |
4.2 Attack-Fault Tree Modeling
Figure 3 shows the proposed attack-fault tree (AFT), which integrates key attack paths from the Bayesian attack tree into a master fault tree format. It includes four subtrees: one for the IFM node, one for the IEM control node, and two for network access. Table 2 lists disruption probabilities for basic component failures (BCFs), representing individual failures and their likelihood of causing broader system compromise. Table 3 details the configuration of attack paths and basic attack step (BAS) variables used in the AFT.
Table 2 Configuration of BCF leaf variables
| Base Event | Disruption |
| G4, G5, G34, G46 | 8.14e-005 |
| G12, G26, G27, G30, G31, G55, G58, G67, G68 | 1e-008 |
| G16, G33, G45 | 4.43e-005 |
| G19, G37, G42, G49 | 4.3e-006 |
| G20, G38, G50 | 3e-007 |
| G21, G25, G29, G39, G43, G51, G54 | 1e-007 |
| G22, G40, G52 | 5e-007 |
| G64, G65 | 5.44e-005 |
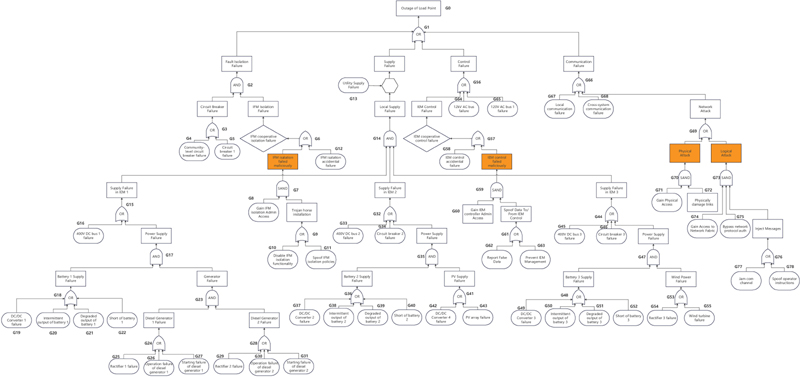
Figure 3 The attack-fault tree of smart grid.
Table 3 Configuration of BAS leaf variables
| Attack Description | Label | Attack Path | Type | Description |
| Disable IFM isolation functionality | A1 | G8, G10 | Logical | [G8]: w1 60, w2 40, f 40, v 3, d 100, lambda 0.001188, lambda1 0.001188; [G10]: w1 60, w2 40, f 50, v 2, d 500, lambda 0.00037, lambda1 0.00037 |
| Spoof IFM isolation policies | A2 | G8, G11 | Logical | [G11]: w1 80, w2 20, f 50, v 4, d 500, lambda 0.000178, lambda1 0 |
| Report False Data | A3 | G60, G62 | Logical | [G60]: w1 60, w2 40, f 40, v 3, d 100, lambda 0.000596, lambda1 0.000596; [G62]: w1 80, w2 20, f 25, v 2, d 500, lambda 0.0005, lambda1 0 |
| Prevent IEM Management | A4 | G60, G63 | Logical | [G63]: w1 80, w2 20, f 40, v 4, d 500, lambda 0.0005, lambda1 0 |
| Cut Network | A5 | G71, G72 | Physical | [G71]: w1 60, w2 40, f 20, v 2, d 5, lambda 0.0011, lambda1 0.0011; [G72]: w1 80, w2 20, f 5, v 1, d 50, lambda 0.00301, lambda1 0 |
| Jam Network Communications | A6 | G74, G75, G77 | Logical | [G74]: w1 60, w2 40, f 20, v 2, d 5, lambda 0.001188, lambda1 0.001188; [G75]: w1 60, w2 40, f 10, v 1, d 50, lambda 0.0011, lambda1 0.0011; [G77]: w1 80, w2 20, f 10, v 1, d 100, lambda 0.001, lambda1 0 |
| Inject Packets | A7 | G74, G75, G78 | Logical | [G78]: w1 80, w2 20, f 30, v 2, d 250, lambda 0.001, lambda1 0 |
To enhance real-world relevance, attacks are based on documented incidents and threat models from industry reports and standards (e.g., IEC 61850 and NIST taxonomies). Parameters like attack frequency, duration, and success rate in Table 3 are derived from empirical data or typical attacker profiles.
Simulations are conducted under AS-IS and WHAT-IF scenarios. In AS-IS, detection is disabled, allowing attackers to exploit the configuration and establish a baseline. In WHAT-IF, detection weights w1 and w2 are applied to evaluate effectiveness under enhanced defense. Comparing both scenarios reveals the impact of detection mechanisms in realistic environments.
4.3 Analyzing Simulation Results
To assess system disruption in a realistic context, we consider five scenarios: (1) AFT with both faults (BCFs) and attacks (BASs), (2) AFT with only faults, (3) attacks without detection, (4) attacks with low detection, and (5) attacks with high detection. Detection levels are adjusted via parameters w1 and w2.
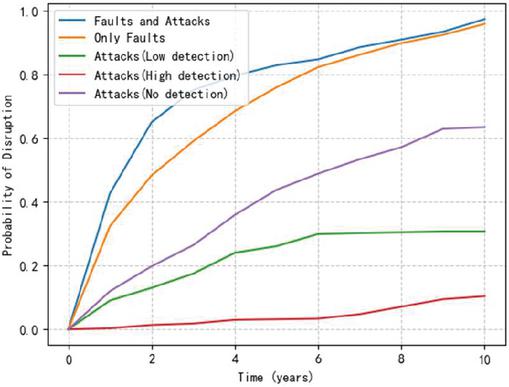
Figure 4 Probability of disruption with time.
Figure 4 shows the 10-year simulation results, evaluated annually. Attack presence increases failure probability over time due to repeated attempts. High detection keeps failure rates low, while low detection allows attackers to bypass defenses, raising the risk. Even without attacks, failure probability grows over time due to aging, software errors, and maintenance gaps.
Table 4 lists BCF leaf nodes, with control and communication nodes posing the greatest risk. G65 (120V AC bus1 fault) has the largest impact (13.132%), followed by G68, G67, and G64 – all part of shared fault paths, revealing key vulnerabilities in power and communication links.
Attack-induced failures escalate more rapidly than fault-based ones. Table 5 shows attack paths A1–A4 (targeting IFMs and IEMs) lead to steeper increases in failure probability compared to A5–A6 (targeting network-level devices). This underscores the importance of deploying strong detection and protection at field-level nodes.
Table 4 Analysis of fault percent of disruptions against all (92.5425%)
| Leaf | P(t 3650) | %Diff | Leaf | P(t 3650) | %Diff |
| G4 | 0.924892 | -0.0533 | G39 | 0.921559 | -0.3866 |
| G5 | 0.923259 | -0.2166 | G40 | 0.921659 | -0.3766 |
| G12 | 0.921959 | -0.3466 | G42 | 0.925525 | 0.01 |
| G16 | 0.862032 | -6.3393 | G43 | 0.925025 | -0.04 |
| G19 | 0.921059 | -0.4366 | G45 | 0.913826 | -1.1599 |
| G20 | 0.922826 | -0.2599 | G46 | 0.897728 | -2.7697 |
| G21 | 0.922359 | -0.3066 | G49 | 0.921159 | -0.4266 |
| G22 | 0.925759 | 0.0334 | G50 | 0.921259 | -0.4166 |
| G25 | 0.923392 | -0.2033 | G51 | 0.926792 | 0.1367 |
| G26 | 0.925725 | 0.03 | G52 | 0.922559 | -0.2866 |
| G27 | 0.923825 | -0.16 | G54 | 0.924092 | -0.1333 |
| G29 | 0.925192 | -0.0233 | G55 | 0.924759 | -0.0666 |
| G30 | 0.923426 | -0.1999 | G58 | 0.925692 | 0.0267 |
| G31 | 0.923559 | -0.1866 | G64 | 0.800804 | -12.4621 |
| G33 | 0.915826 | -0.9599 | G65 | 0.794105 | -13.132 |
| G34 | 0.900061 | -2.5364 | G67 | 0.799971 | -12.5454 |
| G37 | 0.923459 | -0.1966 | G68 | 0.795905 | -12.952 |
| G38 | 0.925225 | -0.02 |
Table 5 Analysis of attack disruption measured against 66.0851%
| Attack Path | Type | P(t 3650) | %Diff |
| A1 | Logical | 0.60039 | -6.0461 |
| A2 | Logical | 0.604657 | -5.6194 |
| A3 | Logical | 0.604023 | -5.6828 |
| A4 | Logical | 0.59809 | -6.2761 |
| A5 | Physical | 0.680882 | 2.0031 |
| A6 | Logical | 0.661484 | 0.0633 |
| A7 | Logical | 0.661218 | 0.0367 |
4.4 Attacker Profile Analysis
AFT is used to define attacker profiles and identify effective attack strategies. Three profiles are created to assess the impact of added security measures:
• Nate: Budget 1000, 90% success rate for all attacks.
• Mallory: Budget 500, 80% success for logical, 60% for physical attacks.
• Chuck: Budget 300, 80% success for physical, 60% for logical attacks.
Tables 6 and 7 compare AS-IS and WHAT-IF scenarios over 10 years for three attacker profiles. In AS-IS, Nate had the highest success rate (62.8%), followed by Mallory (52.4%) and Chuck (42.6%). Despite similar average costs, Nate and Mallory caused more damage, indicating logical attacks were more impactful than physical ones.
Table 6 AS-IS Attack Profiles over 10 years
| Nate | Mallory | Chuck | |
| P(t 3650) | 0.62817 | 0.524484 | 0.425927 |
| Mean E(t) in days | 2240 | 1933 | 1562 |
| Mean E(costs) in US$ | 125.964 | 120.931 | 113.574 |
| Mean E(damage) in US$ | 534.097 | 422.138 | 258.374 |
| Attacks Successful | 243 | 214 | 172 |
| Runs | 396 | 404 | 402 |
Chuck’s physical attacks succeeded more often but caused less damage, with an average cost of $113.57 and damage of $258.37 – suggesting logical attacks are more efficient under constraints. Nate’s attacks took the longest (2240 days), reflecting higher resource investment, followed by Mallory (1933 days) and Chuck (1562 days).
In the WHAT-IF scenario, adjusting detection parameters w1 and w2 significantly reduced attack effectiveness. As shown in Table 7, success rates dropped by 31.6% for Nate, 25.4% for Mallory, and 22.5% for Chuck. Average attack times decreased by 49.5% for Nate and Mallory (22% for Chuck), with successful rounds reduced by 129, 121, and 111, respectively. Damage was also reduced by $364.16 (Nate), $259.09 (Mallory), and $133.17 (Chuck). These results suggest detection is especially effective against logical attackers.
Table 7 WHAT-IF Attack Profiles over 10 years
| Nate | Mallory | Chuck | |
| P(t 3650) | 0.311329 | 0.270016 | 0.205638 |
| Mean E(t) in days | 1130 | 978 | 740 |
| Mean E(costs) in US$ | 104.896 | 105.804 | 103.229 |
| Mean E(damage) in US$ | 169.938 | 163.046 | 125.202 |
| Attacks Successful | 114 | 93 | 61 |
| Runs | 368 | 347 | 301 |
5 Conclusions
In this paper, we presents a framework for generating attack trees by combining deep reinforcement learning and Bayesian probability. Using a Deep Q-Learning Network and cumulative probability, our method identifies feasible attack paths in power systems. To integrate security and safety, we model an Attack-Fault Tree (AFT) with Uppaal SMC’s statistical timed automata, enabling probabilistic analysis of disruption scenarios over time. We evaluate metrics such as attack cost, time, and damage across adversary types. Comparing AS-IS and WHAT-IF scenarios helps pinpoint critical protections, supporting more targeted strategies to strengthen system resilience.
Funding Statement
This work was supported in part by the Northeast Branch of State Grid Corporation of China under Contract SGDB0000DKJS2400122.
References
[1] Eurelectric, “Cybersecurity in the power sector,” Oct. 2023. [Online]. Available: https://www.eurelectric.org/in-detail/cybersecurity-in-the-power-sector/.
[2] Eurelectric, A Snapshot of Cybersecurity in the EU, Nov. 2024. [Online]. Available: https://www.eurelectric.org/wp-content/uploads/2024/11/A-Eurelectric-snapshot-of-Cybersecurity-2024-11-18-FINAL.pdf.
[3] X. Ou, W.F. Boyer, M.A. McQueen, “A scalable approach to attack graph generation,” Proc. of the 13th ACM Conf. on Computer and Communications Security, pp. 336–345, 2006.
[4] R. Ahmari, V. Hemmati, A. Mohammadi, P. Kebria, M. N. Mahmoud, and A. Homaifar, “A data-driven approach for UAV-UGV integration,” Automation, Robotics & Communications for Industry 4.0/5.0, vol. 77, 2025.
[5] R. Ahmari, V. Hemmati, A. Mohammadi, M. Mynuddin, P. Kebria, M. N. Mahmoud, and A. Homaifar, “Evaluating Trojan attack vulnerabilities in autonomous landing systems for urban air mobility,” Automation, Robotics & Communications for Industry 4.0/5.0, vol. 80, 2025.
[6] B. Wang, X. Kestelyn, E. Kharazian, and A. Grolet, “Application of normal form theory to power systems: A proof of concept of a novel structure-preserving approach,” Proc. IEEE Power & Energy Society General Meeting (PESGM), pp. 1–5, July 2024.
[7] F. S. Banitaba, S. Aygun, and M. H. Najafi, “Late breaking results: Fortifying neural networks: Safeguarding against adversarial attacks with stochastic computing,” arXiv preprint, arXiv:2407.04861, 2024.
[8] K. Sheida, M. Seyedi, M. A. Afridi, F. Ferdowsi, and M. J. Khattak, “Resilient control for islanded hybrid DC microgrid integrating piezoelectric, solar and battery,” in 2024 56th North American Power Symposium (NAPS), Oct. 2024, pp. 1–6.
[9] M. Elsayed, M. Erol-Kantarci, B. Kantarci, L. Wu, and J. Li, “Low-latency communications for community resilience microgrids: A reinforcement learning approach,” IEEE Trans. Smart Grid, vol. 11, no. 2, pp. 1091–1099, 2020.
[10] M. Zhang, Z. Wu, J. Yan, R. Lu, and X. Guan, “Attack-resilient optimal PMU placement via reinforcement learning guided tree search in smart grids,” IEEE Trans. Inf. Forensics Security, vol. 17, pp. 1919–1929, 2022.
[11] F. Wei, Z. Wan, and H. He, “Cyber-attack recovery strategy for smart grid based on deep reinforcement learning,” IEEE Trans. Smart Grid, vol. 11, no. 3, pp. 2476–2486, 2020.
[12] H. Zhang et al., “Resilient optimal defensive strategy of TSK fuzzy-model-based microgrids’ system via a novel reinforcement learning approach,” IEEE Trans. Neural Netw. Learn. Syst., vol. 34, no. 4, pp. 1921–1931, 2023.
[13] H. Zhang, D. Yue, C. Dou, and G. P. Hancke, “Resilient optimal defensive strategy of micro-grids system via distributed deep reinforcement learning approach against FDI attack,” IEEE Trans. Neural Netw. Learn. Syst., vol. 35, no. 1, pp. 598–608, 2024.
[14] M. Etezadifar, H. Karimi, A. G. Aghdam, and J. Mahseredjian, “Resilient event detection algorithm for non-intrusive load monitoring under non-ideal conditions using reinforcement learning,” IEEE Trans. Ind. Appl., vol. 60, no. 2, pp. 2085–2094, 2024.
[15] A. Sahu, V. Venkatraman, and R. Macwan, “Reinforcement learning environment for cyber-resilient power distribution system,” IEEE Access, vol. 11, pp. 127216–127228, 2023.
[16] L. Zeng, D. Qiu, and M. Sun, “Resilience enhancement of multi-agent reinforcement learning-based demand response against adversarial attacks,” Appl. Energy, vol. 324, p. 119688, 2022.
[17] N. E. Fard and R. R. Selmic, “Data transmission resilience to cyber-attacks on heterogeneous multi-agent deep reinforcement learning systems,” in Proc. 17th Int. Conf. Control, Autom., Robot. Vis. (ICARCV), 2022, pp. 758–764.
[18] P. Chen, S. Liu, B. Chen, and L. Yu, “Multi-agent reinforcement learning for decentralized resilient secondary control of energy storage systems against DoS attacks,” IEEE Trans. Smart Grid, vol. 13, no. 3, pp. 1739–1750, 2022.
[19] Y. Guo, L. Wang, Z. Liu, and Y. Shen, “Reinforcement-learning-based dynamic defense strategy of multistage game against dynamic load altering attack,” Int. J. Electr. Power Energy Syst., vol. 131, p. 107113, 2021.
[20] Y. Huang, L. Huang, and Q. Zhu, “Reinforcement learning for feedback-enabled cyber resilience,” Annu. Rev. Control, vol. 53, pp. 273–295, 2022.
[21] R. Kumar and M. Stoelinga, “Quantitative security and safety analysis with attack-fault trees,” in Proc. 18th IEEE Int. Symp. High Assurance Syst. Eng. (HASE), 2017, pp. 25–32.
[22] X. Liu et al., “Cyber security risk management for connected railroads,” Tech. Rep., U.S. Dept. Transp., Fed. Railroad Admin., 2020.
[23] R. Kumar, B. Narra, R. Kela, and S. Singh, “AFMT: Maintaining the safety-security of industrial control systems,” Comput. Ind., vol. 136, p. 103584, 2022.
[24] É. André, D. Lime, M. Ramparison, and M. Stoelinga, “Parametric analyses of attack-fault trees,” Fundam. Inform., vol. 182, no. 1, pp. 69–94, 2021.
[25] R. Groner et al., “Model-based generation of attack-fault trees,” in Proc. Int. Conf. Comput. Safety, Reliab. Secur., 2023, pp. 107–120.
[26] S. M. Nicoletti, M. Lopuhaä-Zwakenberg, E. M. Hahn, and M. Stoelinga, “Querying fault and attack trees: Property specification on a water network,” in Proc. Annu. Rel. Maintain. Symp. (RAMS), 2024, pp. 1–6.
[27] M. Lopuhaä-Zwakenberg, “Quantitative analysis of attack-fault trees via Markov decision processes,” arXiv preprint arXiv:2408.06914, 2024.
[28] A. Volkanovski, M. Èepin, and B. Mavko, “Application of the fault tree analysis for assessment of power system reliability,” Reliab. Eng. Syst. Saf., vol. 94, no. 6, pp. 1116–1127, 2009.
[29] G. Song, H. Chen, and B. Guo, “A layered fault tree model for reliability evaluation of smart grids,” Energies, vol. 7, no. 8, pp. 4835–4857, 2014.
[30] R. Meyur, “A Bayesian attack tree based approach to assess cyber-physical security of power system,” in Proc. IEEE Texas Power Energy Conf. (TPEC), 2020, pp. 1–6.
[31] Z. Tian et al., “A security model of SCADA system based on attack tree,” in Proc. IEEE 3rd Conf. Energy Internet Energy Syst. Integr. (EI2), 2019, pp. 2653–2658.
Biographies

Chengzhe Liu received the B.S. degree in electrical engineering from Tsinghua University in 2008 and the M.S. degree in electrical engineering from Tsinghua University in 2010. He is currently the deputy director in the Dispatch & Control centre of the Northeast Branch of State Grid Corporation of China, and his research interests include the control of scheduling and operation of new electric power systems, and the cyber security of electric power monitoring systems.

Xiaochen Yang received the B.S. degree in electrical engineering from Xi’an Jiaotong University in 2019 and the M.S. degree in electrical engineering from Xi’an Jiaotong University in 2023. He is currently working as a specialist in the Dispatch & Control centre of the Northeast Branch of State Grid Corporation of China. His research interests include new power system dispatch operation control, and network security of power monitoring systems.

Manpo Li received his B.S. degree in electrical engineering from Tsinghua University in 1994 and his M.S. degree from Shenyang Institute of Automation Chinese Academy of Sciences in 1997. He is currently the deputy director in the Dispatch & Control centre of the Northeast Branch of State Grid Corporation of China, and his research areas include network security of electric power monitoring systems.

Tianqu Tong received the B.S. degree in electrical engineering from South China University of Technology in 2017, and the M.S. degree in electrical engineering from Zhejiang University, China, in 2021. He is currently working as a specialist in the Dispatch & Control centre of the Northeast Branch of State Grid Corporation of China. His research interests include the control of dispatching operation of new power systems.

Long Yin received the master’s degree in software engineering from JiLin University in 2016, and studying for the Ph.D. degree at Northeastern University. His research areas include cryptography and network security.

Yating Jiang received the bachelor’s degree in sofware engineering from Northeastern University in 2023, and studying for the master degree in software engineering from Northeastern University. Her research areas include software security and network security.
Journal of Cyber Security and Mobility, Vol. 14_3, 531–552.
doi: 10.13052/jcsm2245-1439.1431
© 2025 River Publishers