Analysis of E-commerce Security Protection Technology Based on YOLO Algorithm Optimized by Lightweight Neural Network
Exiang Chen
School of Technology, Fuzhou Technology and Business University, Fuzhou 350715, China
E-mail: exiangchen2@163.com
Received 03 April 2025; Accepted 10 August 2025
Abstract
Aiming at the security of logistics and warehouse management in the e-commerce environment, an improved model based on You Only Look Once version 7 and GhostNet is proposed for abnormal behavior detection. The study analyzes potential security risks in e-commerce warehouses and concludes that monitoring abnormal warehouse behavior can effectively ensure asset security, improve operational efficiency, and reduce loss risks. A lightweight object detection network is constructed by introducing efficient Ghost Module and depthwise separable convolution to optimize model performance and improve inference speed. The experiment used the Awake dataset for performance validation. The average precision was 86.8% and 83.2% in the training and testing sets, with recall rates of 77.6% and 76.5%, respectively, with significant advantages compared with the control model. In addition, the mean absolute error was 0.0023, and the area under the ROC was 0.85, indicating its efficiency and reliability in abnormal behavior detection. Therefore, the model provides an effective real-time monitoring solution for e-commerce warehouse management.
Keywords: GhostNet, YOLOv7, electronic commerce, warehouse management, abnormal behavior.
1 Introduction
In today’s highly digitized and globalized economic environment, e-commerce has become an indispensable part of daily lives and business activities. With the rapid development of e-commerce, the security of warehouse management and logistics processes has become particularly important. As the core link for storing and transporting goods, the safety of warehouse operations directly affects the asset security, customer trust, and overall economic benefits of the enterprise [1, 2]. However, the complex internal and surrounding environment of the warehouse leads to frequent occurrences of abnormal behavior. This not only brings direct economic losses to the enterprise, but also seriously affects the operational efficiency and brand image of the enterprise [3, 4]. Therefore, quickly and accurately identifying and responding to these abnormal behaviors has become a key issue facing the e-commerce industry. Some scholars explored methods for detecting abnormal behavior. Chang C W et al. built a deep learning method for detecting abnormal behavior. This method utilized You Only Look Once version 3 (YOLOv3) object detection technology to identify pedestrians, and then tracked pedestrians through a hybrid object tracking algorithm to obtain tracking trajectories. This model had good recognition rate on different behavioral datasets, which could meet the needs of real-time monitoring [5]. Alafif T et al. built an anomaly behavior detection method based on optical flow and generative adversarial networks. This framework took U-Net and Flownet to produce and distinguish between normal and abnormal behaviors of individuals. The study collected videos of abnormal behaviors during pilgrimage from different scenarios for testing and achieved good performance in experiments [6]. Gao H et al. proposed a probabilistic model-based detection method to predict patient behavior and detect abnormal behavior associated with mild cognitive impairment. The model used discrete-time Markov chains to form a user activity model to describe the data collected by sensors. The results demonstrated its usability and feasibility [7]. Rezaee K et al. proposed a real-time security monitoring method based on IoT platforms to enhance the detection of abnormal behavior in the population. The proposed hybrid deep learning method and IoT platform facilitated the analysis of crowd and individual behavior, thereby achieving secure screening of abnormal events [8]. Jiang T et al. proposed an efficient and lightweight damage recognition model YOLOMF to address the low accuracy, slow speed, and weak generalization ability in multi-damage recognition of concrete Bridges. The detection speed reached 85 frames per second, significantly improving the recognition ability [9]. Aiming at the difficult target detection in remote sensing images, Li M et al. proposed multi-head channels and spatial attention transfer modules. A lightweight target detection model TA-YOLO was designed to improve the detection accuracy [10]. Tian T et al. proposed a lightweight deep learning model for the low detection accuracy in underwater target detection. Through image enhancement and multi-attention mechanism, a mAP performance of 77.32% was achieved, and the model volume was 18.5 MB, which improved the detection accuracy [11]. Although the above research methods have good performance in identifying abnormal behaviors, most of models have high complexity and require significant resources, which limits their application effectiveness in real-time monitoring environments. Therefore, to cope with the high complexity and resource requirements, a YOLOv7 model based on GhostNet is proposed, which introduces Ghost Module to achieve lightweight optimization and significantly reduce computational complexity. The innovation of the research lies in combining GhostNet with YOLOv7. An object detection model is constructed by introducing an efficient feature extraction module. This series of methods can bring higher real-time detection performance and provide strong support for e-commerce security protection.
2 Methods and Materials
2.1 Analysis of E-commerce Security Protection Based on YOLOv7 Structure
In the e-commerce environment, the security of logistics and warehouse management is crucial. This study monitors abnormal behavior in warehouses, implements real-time monitoring and early warning to ensure asset safety, improve operational efficiency, and reduce loss risks [12, 13]. TheYOLOv7 object detection algorithm can be used to achieve security protection for e-commerce warehouses, and deeply analyze various abnormal behaviors, such as abnormal movement of personnel, improper handling, and carrying of items. Through intelligent analysis, YOLOv7 can identify activities that do not conform to normal behavior patterns, provide scientific decision-making basis for managers, and regularly analyze detection data to help enterprises identify potential risks and improve their security management system [14, 15]. The YOLOv7 model has two parts: the backbone network and the head network. The former is mainly composed of Convolutional Block with Linear Skip Connection (CBS) module, Enhanced Linear Attention (ELAN) module, and Max Pooling (MP), as displayed in Figure 1.
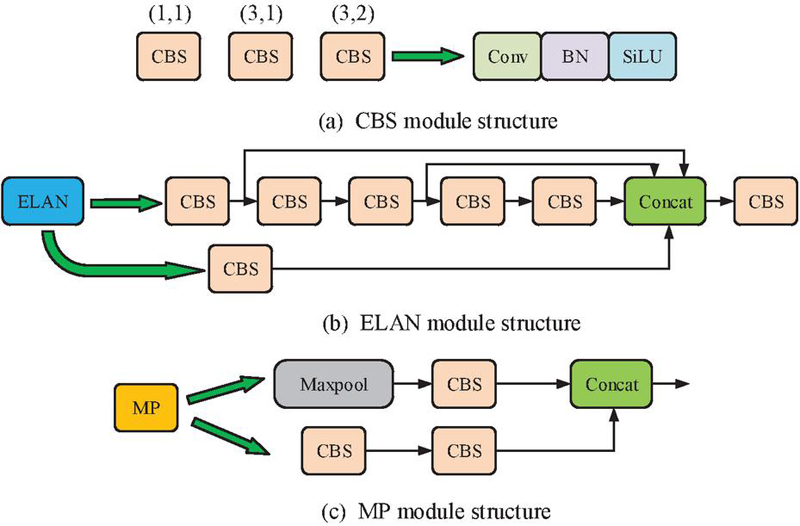
Figure 1 Backbone network of YOLov7.
In Figure 1, the CBS extracts feature, extracting important features of the image through convolution operations, and preserving low-level features through skip connections to reduce information loss and improve the fusion ability of information at different levels. In warehouse monitoring, the CBS module can quickly identify abnormal behaviors such as abnormal movement of personnel and improper handling of items. The ELAN module introduces an attention mechanism that automatically weights features based on their importance, improving detection accuracy in complex scenes and highlighting key abnormal behaviors. The MP module is used for downsampling, reducing the feature map size, preserving vital information, lowering computational complexity, and enhancing model robustness. It helps to quickly process video information in real-time monitoring and capture abnormal behavior in a timely manner [16]. The head network of YOLOv7 model mainly includes Spatial Pyramid Pooling and Convolutional Block (SPPCB) module, Upsampling (UP) module, Enhanced Linear Attention Head (ELAN-H) module, and Reparameterized Convolution (RepConv) module, as displayed in Figure 2 [17].
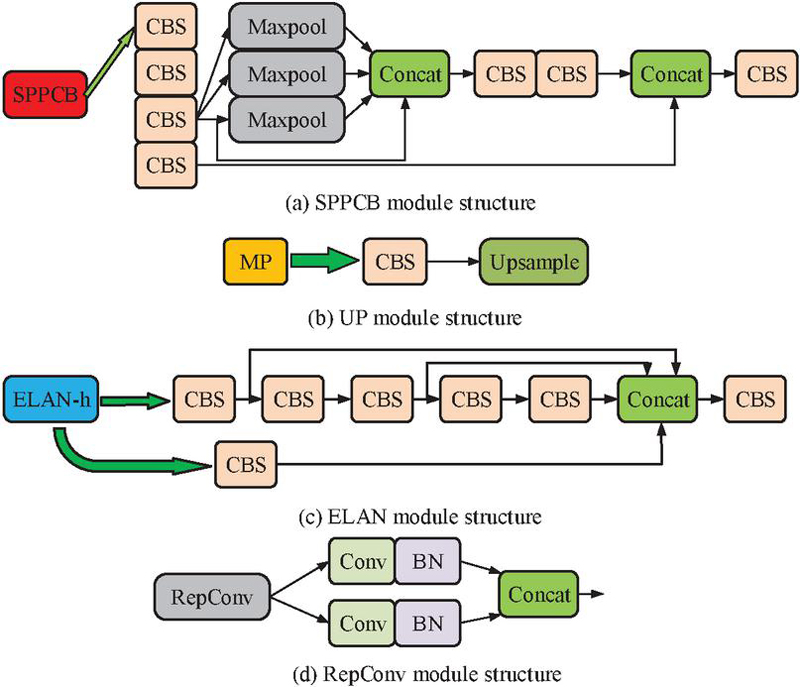
Figure 2 Head structure of YOLov7.
In Figure 2, the SPPCB module integrates features of different sizes through spatial pyramid pooling, enabling the model to capture information at multiple scales and enhance its adaptability to different target sizes. This enables the monitoring system to effectively identify abnormal behavior objects of various sizes, improving detection accuracy. The UP module is responsible for upsampling feature maps, and restoring resolution, and helping to identify subtle abnormal behaviors, ensuring fine monitoring. The ELAN-H module introduces attention mechanism, automatically weights features, and enhances the model attention to vital features for more accurate object detection. In complex environments, this module helps to highlight the abnormal behavior. The RepConv module optimizes the convolutional structure through reparameterization, reduces computational complexity, improves model execution efficiency, ensures that real-time monitoring systems can quickly respond and process video streams without delay, and capture abnormal behavior in a timely manner.
2.2 Construction of Lightweight Object Detection Network Based on GhostNet
In the constructed object detection network, YOLOv7 introduces various new modules such as CBS, ELAN, and RepConv, which improve model performance but also increase computational complexity and memory requirements [18, 19]. In addition, YOLOv7 uses techniques such as spatial pyramid pooling to capture multi-scale features, which enhances the detection ability of targets at different scales, but also increases the dimensionality and computational burden of feature maps. These complexities make YOLOv7 take longer to reason. Therefore, in order to improve the inference speed in real-time monitoring, YOLOv7 is optimized for lightweight through spatially separable convolution, Depthwise Separable Convolution (DSC), and GhostNet. In the backbone network architecture of YOLOv7, the Ghost Module of GhostNet introduced can effectively perform lightweight optimization on the standard convolutional layers in CBS. The Ghost Module replaces the traditional convolution operation by generating and utilizing more low-cost feature maps. It can not only reduce the amount of computation and model parameters, but also maintain the efficiency of feature extraction. In addition, in the ELAN module, the attention mechanism can be adjusted to adopt a more simplified weight calculation strategy during the calculation process, thereby reducing the complexity of the attention layer while still effectively focusing on important features. Spatially separable convolution mainly processes the width and height of images, as expressed in formula (1).
| (1) |
In formula (1), the matrix represents the input feature map, which contains the pixel values of multiple channels, specifically the pixel intensity of the element at position . represents the feature values in the input channel. represents the convolution kernel. , and represent the weight values at each position in the convolution kernel.
After performing deep convolution, the next step is to combine all output channels using 1x1 convolution. This operation is applied to increase the feature channel, and its function is to enhance the expressive power of the model by deepening the network structure. The main purpose of formula (1) is to demonstrate how to decompose convolution operations through deep convolution and pointwise convolution in spatially separable convolution, thereby improving efficiency and reducing computational complexity. DSC is the further decomposition of convolution operations, including layer by layer convolution kernels and point by point convolution. Assuming there are a certain number of convolution kernels in standard convolution, the parameter calculation for standard convolution operation is shown in formula (2).
| (2) |
In formula (2), represents the standard convolution. represents the number of convolution kernels, and , and signify the height, width, and image depth. The computational complexity of standard convolution operation is shown in formula (3).
| (3) |
In formula (3), signifies the quantity of operations. represents the computational complexity of standard convolution. In terms of DSC, the quantity of parameters and computational complexity are shown in formula (4).
| (4) |
Comparing formula (2), formula (3), and formula (4), the number of parameters and calculations in formula (4) are smaller. Formula (4) indicates that DSC reduces parameters, improves storage efficiency, and accelerates training and inference speed. Due to the reduction in computational complexity, it can significantly improve inference speed, enabling object detection algorithms to efficiently process video streams in real-time monitoring. GhostNet is a lightweight network architecture that can effectively generate more feature maps by introducing a “Ghost Module” instead of ordinary convolutions, while minimizing computational overhead and improving computational efficiency and model speed [20, 21]. The Ghost Module is illustrated in Figure 3.
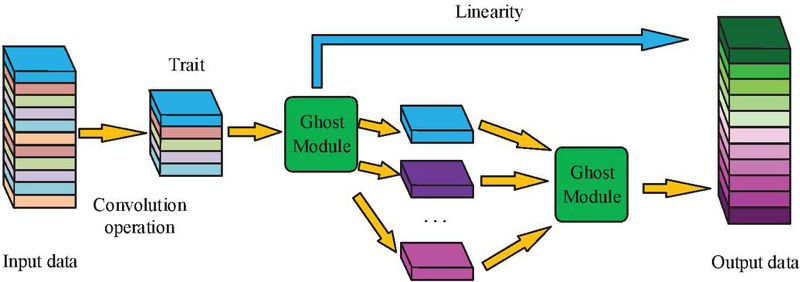
Figure 3 Network structure of Ghost Module.
From Figure 3, Ghost Module appears twice. The first time is applied to expand the channel in the feature map and enhance feature expression ability. The second time reduces the channel to match the input. The Ghost Module is integrated into the key layer of the backbone network of YOLOv7, replacing the original standard convolutional structure in the CBS module and the ELAN module. Specifically, the 3x3 convolutional layer in the CBS Module is decomposed into the combination of linear transformation and deep convolution in the Ghost Module. While maintaining the feature expression ability, the number of parameters is reduced to one-third of the original structure. In the 4-layer Bottleneck design of the ELAN Module, the last two layers adopt a cascaded Ghost Bottleneck structure. Feature map downsampling is achieved through a Ghost Module with a step size of 2, reducing the computational complexity of a single module. In addition, when adding DSCs of different synchronization lengths in Ghost Module, corresponding downsampling operations are performed in the residual path to maintain the effectiveness of the residual connections. The specific downsampling operation is shown in Figure 4.
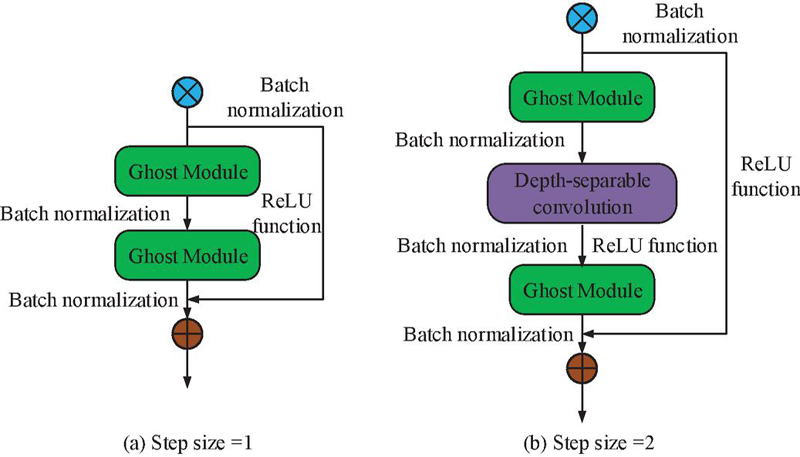
Figure 4 Unsynchronously long downsampling operation structure.
Figure 4 shows the structure of downsampling operations with different step sizes. When the step size is 1, the output of Ghost Module is batch normalized to ensure stability and accelerate convergence during training. The input data can improve training efficiency. When the step size is set to 2, the structure is more complex. The feature map size is effectively reduced for subsequent processing. At this point, the feature map is first subjected to batch normalization and ReLU. ReLU, as a non-linear activation function, helps to enhance the model expressive power. The processed output then enters a DSC layer with a stride of 2, which compresses the width and height of the feature map and extracting richer features through deep convolution, thereby lowering the computational complexity. The parameter and computational complexity of the Ghost Module after convolution are shown in formula (5).
| (5) |
In formula (5), represents the number of linear transformations. Compared with formulas (2) and (3), the parameter and computational complexity of the model after Ghost Module lightweighting are reduced to 1/s times that of the normal case. In scenarios such as e-commerce logistics and warehouse management, real-time detection requires models to have fast response capabilities due to the diverse types and quantities of target objects. The lightweight feature of Ghost Module enables it to quickly process video stream data, achieve fast and accurate object detection, and effectively extract features from targets of different scales and poses, ensuring accurate target recognition in complex environments.
2.3 Optimization of Loss Function Based on Improved YOLOv7 Model
The above content lowers the complexity and improves the inference speed by introducing GhostNet and DSC. In the process of improving lightweight models, changes in model parameters and structure may affect the effectiveness of the original loss function. Therefore, optimizing the loss function can ensure its adaptation to new structures, balance the losses of various categories, and make the network perform more evenly on specific objectives. The loss function mainly includes three parts, as shown in formula (6).
| (6) |
In formula (6), signifies the overall loss function. signifies the confidence loss function. signifies the classification loss function. signifies the error regression loss function. Among them, the is shown in formula (7).
| (7) |
In formula (7), represents the regression loss. signifies the prediction box. signifies the real box. signifies the closure region. represents the diagonal distance. represents the balance parameter. represents a metric function used to calculate the distance or similarity between two bounding boxes. The loss function parameters are shown in Figure 5.
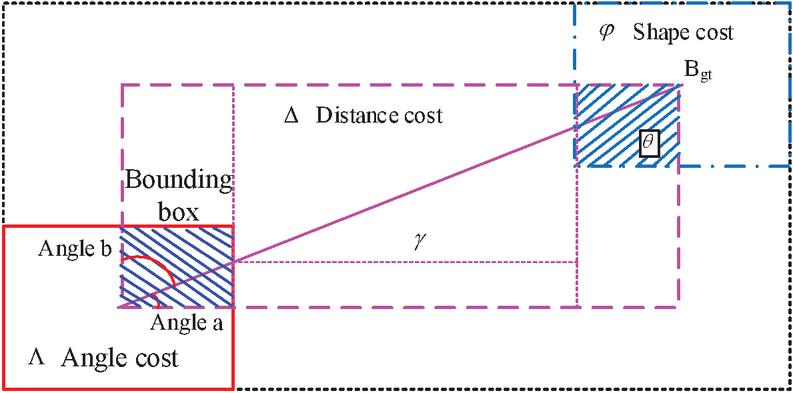
Figure 5 Schematic diagram of loss function parameters.
The interaction mechanism shown in Figure 5 reveals the collaborative optimization path of the three costs of Angle, distance and shape in model training. The angle cost dynamically corrects the target direction deviation by adjusting the rotation Angle error of the prediction box. The distance cost enhances the positioning accuracy of the center point in an exponential form, promoting the rapid convergence of the prediction box to the real target area. Shape cost constrains the morphological features of the target through the difference in aspect ratio and suppresses overfitting of abnormal contours. The angle cost calculation is shown in formula (8).
| (8) |
In formula (8), is the angle cost. It is used to ensure that the model can not only accurately predict the position and size of the bounding box, but also effectively capture the directional information of the object, thereby improving detection accuracy. The specific distance cost is shown in formula (9).
| (9) |
In formula (9), represents distance cost. is a balance parameter used to control the amplitude of the exponential term in the formula. Distance cost helps the model adjust the center point of the predicted box to the position of the real box during training, thereby improving the accuracy of box localization. The shape cost is shown in formula (10).
| (10) |
In formula (10), represents the cost of shape. represents the impact of adjusting shape cost on overall loss. The main reason for introducing angle cost, distance cost, and shape cost in the research is to optimize the accuracy and comprehensiveness of the object detection model in the bounding box regression process. Angle cost focuses on the Angle difference between the predicted box and the real box, especially playing a crucial role for objects with rotational features, which helps to improve detection accuracy. Distance cost measures the distance between the center points of the predicted box and the real box to ensure that the model can accurately locate the target position. Shape cost focuses on the consistency in shape between the predicted box and the actual box, mainly measured by the aspect ratio to reduce errors and improve the detection stability. The final loss function is defined as formula (11).
| (11) |
Formula (11) aggregates various types of losses, so that the performance during training not only focuses on the accuracy of the bounding box, but also includes the comprehensive performance of multiple factors such as classification accuracy, target angle, shape consistency, etc. This comprehensive evaluation ensures that the model is more comprehensive and balanced in object detection tasks.
3 Results
3.1 Performance Analysis of Improved YOLOv7 Model Based on GhostNet
To verify its performance, simulation experiments are conducted to analyze the model. The experiment is verified and analyzed using the Awake dataset, which is an open dataset specifically designed for abnormal behavior detection and behavior recognition. It is widely applied in video surveillance and behavior analysis research. This dataset contains videos of human behavior in multiple scenarios, aiming to provide researchers with a standardized testing environment. Specifically, the Awake dataset is massive in scale, containing thousands of video clips with a total video duration exceeding tens of hours. These videos are marked as normal and abnormal behaviors, and these markings usually include the following information: behavior category and timestamp. Behavioral categories include normal behaviors (such as walking, standing, etc.) and abnormal behaviors (such as stealing, fighting, etc.). The timestamp represents the start and end times of each behavior, helping the model learn the temporal characteristics of the behavior. During the data preprocessing stage, the study applies various enhancement treatments to the video, including random cropping, rotation, scaling, and color modification, to increase the robustness of the model. In addition, the video frame data undergoes normalization processing to ensure the standardization of input data and enhance the learning efficiency during training.
The experimental environment is as follows. The computer processor is Intel Core i7, the graphics card is NVIDIA RTX 3060Ti, the memory configuration is 16GB*2, the hard drive is 1TB solid-state drive, and the operating system is Linux. In the training of the proposed model, the hyperparameters adopted are set as follows. The learning rate is set to 0.001 to ensure rapid convergence in the early stage of training and avoid oscillations caused by excessive updates. The batch size is set to 16, which performs well in balancing training stability and computational efficiency. The optimizer selects the Adam optimizer, whose adaptive learning rate feature enables the model to adjust the update stride more effectively, especially performing well when dealing with complex data. The training rounds are set at 150 to ensure that the model fully learns the data features. Meanwhile, an early stop mechanism is utilized to monitor the performance of the validation set and prevent overfitting. The study divides the dataset into training and testing sets in an 8:2. The change in model loss values in the testing set is shown in Figure 6.
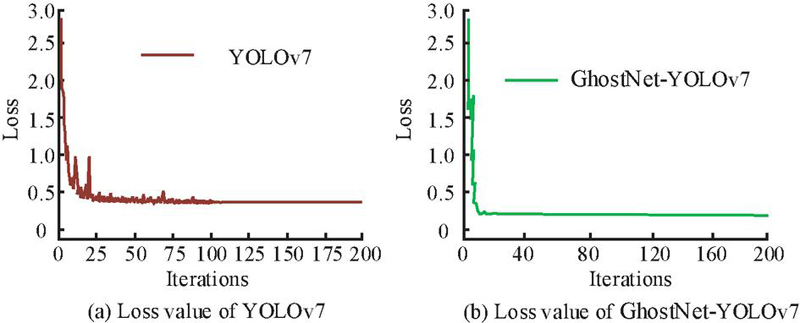
Figure 6 Changes in loss values of different models in the training set.
Figure 6(a) shows the loss value curve of the original YOLOv7. The loss value of the YOLOv7 after 100 iterations was approximately 0.42. Although the result reflects the learning process of the model, it has not yet reached the ideal performance standard. Figure 6(b) shows the loss value curve of the GhostNet-YOLOv7. It decreased to 0.25 after 30 iterations. The results indicate that GhostNet-YOLOv7 has technological advantages in model optimization and resource utilization, accelerating the model training process and ensuring the reliability and consistency of the results. To further validate the performance, the study evaluates the average accuracy and recall of the training and testing sets. The other three models are compared, including YOLOv5, Single Shot MultiBox Detector (SSD), and Faster Region-Convolutional Neural Networks (Faster R-CNN). The average precision is displayed in Figure 7.
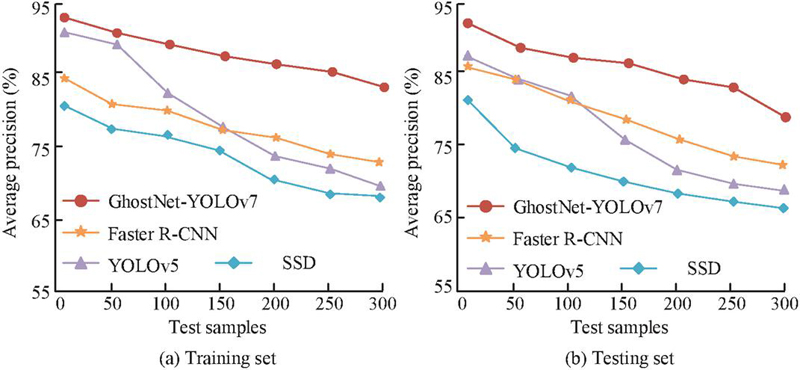
Figure 7 Average precision of the model in training and testing sets.
Figure 7(a) displays the average precision of the training set for the GhostNet-YOLOv7, Faster R-CNN, YOLOv5, and SSD algorithms, with results of 86.8%, 76.3%, 72.9%, and 71.2%, respectively. Figure 7(b) displays the average precision in the testing set. The results of the four algorithms were 83.2%, 74.8%, 69.1%, and 66.6%, respectively. The results indicate that GhostNet-YOLOv7 not only outperforms other algorithms in AP performance on both the training and testing sets, but also demonstrates stronger stability and consistency. This result validates the effectiveness of GhostNet-YOLOv7 in abnormal behavior tasks and its broad adaptability in complex scenarios. The recall results are displayed in Figure 8.
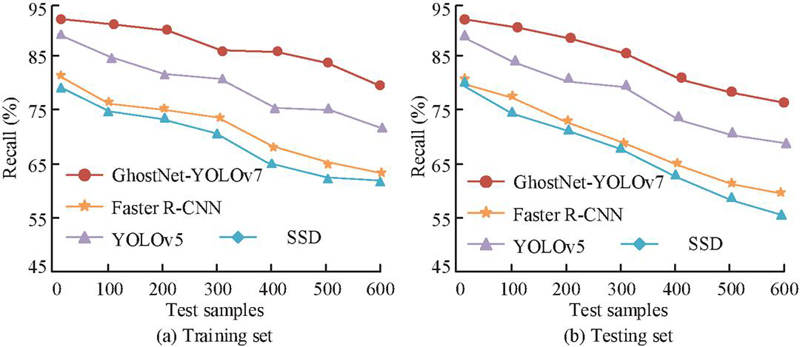
Figure 8 Recall rates of the model in the training and testing sets.
Figure 8(a) displays the recall curve of the model training set. When the sample size reached 300, the recall rate of GhostNet-YOLOv7 was 77.6%. The recall rate of Faster R-CNN was 73.3%. The recall rates of YOLOv5 and SSD were 64.9% and 64.0%, respectively. Figure 8(b) displays the recall curves in the testing set, with GhostNet-YOLOv7, Faster R-CNN, YOLOv5, and SSD results of 76.5%, 68.7%, 59.8%, and 56.4%, respectively. The results show that GhostNet-YOLOv7 not only demonstrates excellent recall performance in both the training and testing sets, but also further enhances its reliability and effectiveness in practical applications. The research is based on the theoretical design of the number of linear transformations in formula (5), supplemented by comparative experiments to verify the influence of different s values on model performance. The experiment presents the comparison results of the number of parameters, computational load (FLOPs), reasoning speed (FPS), and average precision (mAP@0.5) when s 2 and s 4, as shown in Table 1.
Table 1 The influence of the number of linear transformations on model performance
| Ghost Module | Params | FLOPs | mAP@0.5 | ||
| Parameter | Configuration | (M) | (G) | FPS | (%) |
| s 2 | Basic module (C 64 | 18.7 | 35.2 | 42.3 | 83.1 |
| s 4 | Expansion module (C 128 | 14.2 | 22.8 | 67.5 | 81.6 |
From Table 1, increasing the number of linear transformations s of the Ghost Module effectively optimized the model efficiency. When s 4, the number of model parameters and the amount of computation decreased by 24% and 35% respectively compared with s 2, and the FPS increased from 42.3 to 67.5. However, mAP@0.5 decreased by 1.5%, mainly due to the weakened response ability of minor abnormal features caused by high-frequency linear transformation. To verify the impact of introducing specific balance parameters on the model performance, the study conducts a sensitivity analysis on the model performance under different parameter combinations. The specific results are shown in Table 2.
Table 2 Sensitivity analysis of specific balance parameters of the model
| Parameter | mAP@0.5 | Recall | Number of Training | |
| Combination () | (%) | Rate (%) | FPS | Convergence Rounds |
| (0, 1.0, 0) | 79.3 | 73.1 | 67.5 | 150 |
| (0.2, 1.5, 0.6) | 83.2 | 80.5 | 67.5 | 85 |
| (0.5, 1.5, 0.6) | 81.7 | 78.9 | 67.2 | 95 |
| (0.2, 1.0, 0.6) | 81.1 | 77.6 | 67.5 | 105 |
| (0.2, 1.5, 1.0) | 80.9 | 76.3 | 66.8 | 120 |
In Table 2, when balanced parameters , , and , the model performance was improved through multi-task collaborative optimization. Compared with the benchmark model, that is, without the Angle and shape loss, its average accuracy increased by 3.9%, from 79.3% to 83.2%. The recall rate increased by 7.4%, from 73.1% to 80.5%. In addition, the number of convergence rounds was reduced by 43%, from 150 rounds to 85 rounds, which verified the necessity of joint optimization with multiple loss terms. Specifically, when the angle parameter was increased to 0.5, the average accuracy decreased by 1.5% because the excessive focusing angle error weakened the position learning ability. Reducing the distance parameter to 1.0 resulted in a 2.9% decrease in recall, indicating that strengthening the center point gradient could effectively improve target capture capability. Over-scaling the shape parameter to 1.0 reduced the frame rate by 1.7 frames per second, from 67.5 frames per second to 66.8 frames per second. The reason was that the high-weight shape loss increased the feature calculation burden of complex targets. The results prove that reasonably allocating loss weights can achieve the best balance between accuracy and efficiency. The constraint of being 0.6 on width and height variations can not only suppress false detections, but also avoid a sharp increase in computational costs.
3.2 Example Analysis of e-commerce Security Protection
The performance is validated through testing and training sets, in order to further verify its practical application. The experiment selects videos on e-commerce warehouse management to verify the model, which covers normal behaviors, known abnormal behaviors, and unknown abnormal behaviors. The dataset contains records of daily logistics and warehouse management activities in different warehouse scenarios. Specifically, this dataset contains approximately 500 video clips, covering various workflows and environmental conditions. The frame rate of each video ranges from several hundred to several thousand, covering the requirements of continuous monitoring and real-time analysis. Each video has detailed tags, including normal behaviors (such as moving and organizing), known abnormal behaviors (such as improper moving and theft), and unknown abnormal behaviors (such as sudden quarrels or fights). During the data preprocessing, all video data are uniformly processed to facilitate the input of the model. For instance, video frames are adjusted to the same resolution and only a certain number of frames are retained to control the input dimension of the data. By enhancing and normalizing the training samples, the model can effectively learn complex transitions from normal to abnormal states. Compared with the Awake dataset, the warehouse video dataset is designed to focus more on the unique abnormal behaviors in the actual environment, providing more specific application scenarios. This scenario-based dataset helps to demonstrate the application value of the proposed model and effectively address the monitoring requirements in actual operations. This study considers using K-fold cross-validation to train and validate the model multiple times on the same training data to ensure its stability across different subsets. The study takes k=5 for verification, and the specific results are shown in Table 3.
Table 3 Results of hierarchical cross-validation
| K | K 1 | K 2 | K 3 | K 4 | K 5 | Mean Standard Deviation |
| Training set accuracy (%) | 96.2 | 95.7 | 96.4 | 95.9 | 96 | 95.80.3 |
| Validation set accuracy (%) | 95.1 | 94.6 | 95.3 | 94.9 | 94.8 | 95.00.3 |
| Validation set recall rate (%) | 91.8 | 90.3 | 92.5 | 91.2 | 90.7 | 91.31.0 |
| Validation set F1 value | 0.934 | 0.924 | 0.938 | 0.93 | 0.927 | 0.9310.006 |
Table 3 presents the experimental results using five-fold cross-validation, reflecting the stability of the model on different training subsets. The average accuracy of the training set was 95.8%, indicating that the model had a strong fitting ability for the training data. The standard deviation between each fold was only 0.3%, demonstrating the consistency of the training results. On the validation set, the average accuracy was 95.0%, the recall was 91.3%, and the F1 value was 0.931. Although the performance of each folded validation set fluctuates to some extent, on the whole, the model can maintain a high accuracy and recall rate on different subsets, indicating that the model has good generalization ability. Meanwhile, a relatively high F1 value indicates that the model performs well in balancing accuracy and recall rate. Therefore, it can be considered that the model has strong effectiveness and reliability in practical applications.
In practical applications, the video parameter resolution is 1,920 1,080 and the frame rate is 20 FPS. Known abnormal types include abnormal displacement of packages (such as unauthorized handling, goods being thrown), retention in restricted areas (prohibited entry areas where personnel stay in the warehouse for a long time), and illegal carrying (unregistered items being taken out). Abnormal location types include sudden group gatherings and high-risk operations (such as climbing shelves without wearing safety equipment). The detection scenarios cover a mixed environment of normal daytime operations and night inspections. The accuracy and recall results of the model are shown in Figure 9.
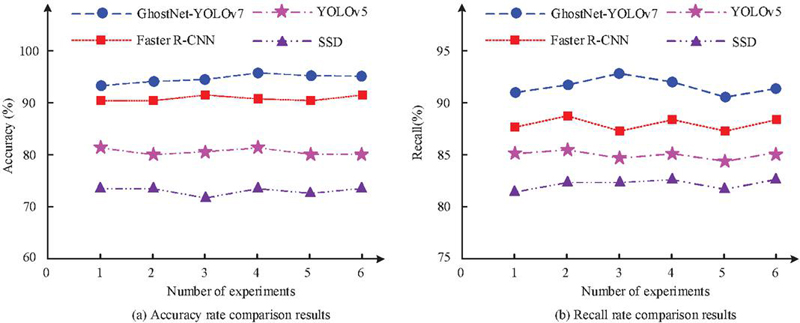
Figure 9 Accuracy and recall results.
Figure 9(a) displays the accuracy. The GhostNet-YOLOv7 had an accuracy of 95.6%. The Faster R-CNN was 90.3%, YOLOv5 was 79.9%, and SSD was 73.5%. This indicates that GhostNet-YOLOv7 has significant advantages in accurately identifying abnormal behavior and can effectively reduce false alarm rates. Figure 9(b) displays the recall. The GhostNet-YOLOv7 also performed outstandingly, with an average recall of 92.2%. The recall of the Faster R-CNN was 87.5%, that of the YOLOv5 was 84.3%, and that of the SSD was 81.9%. Overall, GhostNet-YOLOv7 performs well in two key performance indicators, accuracy and recall, validating its technological advantages in detecting abnormal behavior in e-commerce logistics and warehouse management videos. The PR curve and F1 value are displayed in Figure 10.
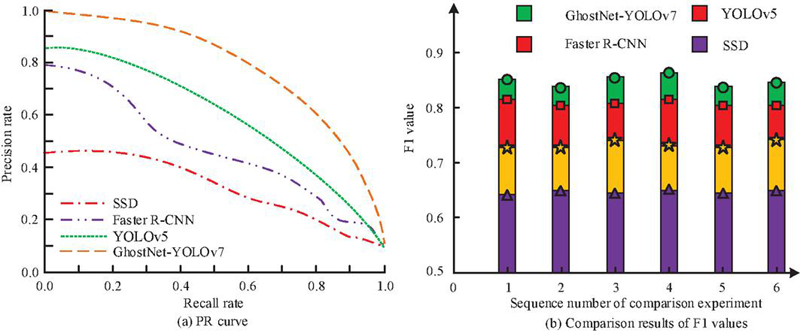
Figure 10 PR curve and F1 value results.
Figure 10(a) displays the PR curve. The area under the curve of GhostNet-YOLOv7 was 0.78, which was better than that of Faster R-CNN (0.72), YOLOv5 (0.65), and SSD (0.42). This reflects the balance between precision and recall in GhostNet-YOLOv7, meaning that it can effectively reduce false alarms while recognizing positive examples, providing higher reliability for abnormal behavior detection. Figure 10(b) displays the F1 value. The average F1 value of GhostNet-YOLOv7 reached 0.86, significantly higher than that of Faster R-CNN (0.81), YOLOv5 (0.74), and SSD (0.65). This result indicates the superiority of GhostNet-YOLOv7 on comprehensive precision and recall performance, making it more advantageous in practical applications and able to better complete abnormal behavior detection tasks in dynamic and complex logistics environments. The comparison results of the precision rates of the above model under the key recall threshold are shown in Table 4.
Table 4 Comparison of the precision rates of each model under the key recall rate threshold
| Precision | AUC | |||
| Model | Recall 0.5 | Recall 0.7 | Recall 0.9 | |
| GhostNet-YOLOv7 | 0.934 | 0.872 | 0.628 | 0.78 |
| Faster R-CNN | 0.881 | 0.726 | 0.389 | 0.72 |
| YOLOv5 | 0.823 | 0.654 | 0.295 | 0.65 |
| SSD | 0.715 | 0.487 | 0.103 | 0.42 |
The experimental results show that the precision performance of GhostNet-YOLOv7 under different recall threshold values is significantly better than that of other comparison models. When the recall rate was set to 0.5, its precision was as high as 93.4%, exceeding 88.1%, 82.3% and 71.5% of Faster R-CNN, YOLOv5 and SSD respectively, demonstrating high predictive credibility in low missed detection scenarios. With the recall requirement raised to 0.7, GhostNet-YOLOv7 still maintains a precision of 87.2%, which was 14.6% higher than that of the sub-optimal model Faster R-CNN, while the precision of SSD dropped to 48.7%, exposing the limitations of traditional single-stage detectors under high recall requirements. Under the strict recall rate condition of 0.9, the precision of GhostNet-YOLOv7 was 62.8%, significantly higher than 38.9% of Faster R-CNN and 10.3% of SSD, verifying its strong suppression ability against missed detections in high-risk scenarios. The Mean Absolute Error (MAE) and the Receiver Operating Characteristic (ROC) curve results are shown in Figure 11.
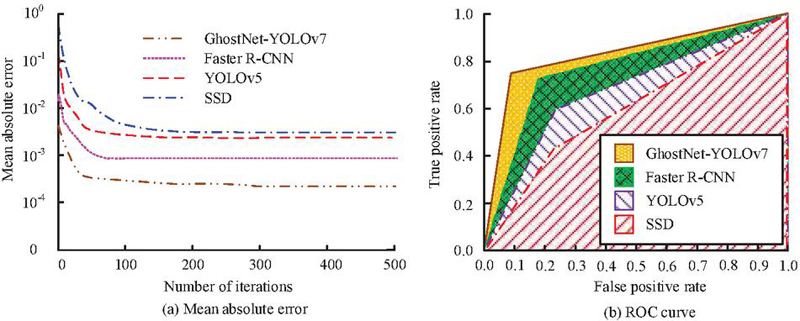
Figure 11 Mean absolute error and ROC curve results.
Figure 11(a) shows the average absolute error curve of the model. MAE calculates the regression accuracy of bounding box coordinates in the object detection task, specifically the mean absolute error of the center point coordinates and width and height of the predicted box and the real box. The MAE of GhostNet-YOLOv7 was the lowest, and the MAE after stabilization was 0.0023. In contrast, the MAE of Faster R-CNN was 0.0012, that of YOLOv5 was 0.0073, and that of SSD was 0.0081. The research method demonstrates its excellent performance in abnormal behavior detection. In warehouse monitoring, abnormal behavior detection, such as package theft and illegal detention of personnel, relies on precise coverage of the target box. For example, when detecting the items contained, it is necessary to accurately define the contact area between the hand and the package. A MAE of 0.0023 indicates that the average position deviation of the model’s prediction box is 3 pixels, which is much lower than the 8-pixel deviation of SSD (MAE 0.0081), significantly reducing the risk of misjudgment. Figure 11(b) displays the ROC curve and its corresponding area under the curve. The ROC of GhostNet-YOLOv7 was 0.85, significantly higher than that of other comparison methods. This indicates that GhostNet-YOLOv7 not only performs excellently in balancing true and false positive cases, but also demonstrates outstanding advantages in recognition ability and overall performance. The abnormal data recognition results are analyzed from the first five experiments, as displayed in Table 5.
Table 5 Abnormal behavior detection performance of GhostNet-YOLOv7
| Detection | ||||
| Number of Experiments | Data | Quantity | Quantity | Accuracy Rate (%) |
| The first time | Normal behavior | 8,428 | 7,434 | 86.98 (85.7–88.1) |
| Known abnormal behavior | 2,351 | 2,045 | 88.72 (85.7–91.1) | |
| Unknown abnormal behavior | 452 | 401 | 82.90 (82.3–83.5) | |
| The third time | Normal behavior | 12,441 | 10,314 | 88.57 (87.3–89.7) |
| Known abnormal behavior | 2547 | 2,256 | 88.65 (85.6–91.2) | |
| Unknown abnormal behavior | 423 | 375 | 86.56 (85.9–87.2) | |
| The fifth time | Normal behavior | 9,833 | 8,511 | 87.64 (86.3–88.9) |
| Known abnormal behavior | 2,371 | 2,078 | 90.82 (87.9–93.1) | |
| Unknown abnormal behavior | 392 | 356 | 86.98 (85.7–88.1) | |
In Table 5, the detection accuracy of normal behavior was 88.21%, the known abnormal behavior was 86.98%, and the unknown abnormal behavior was 88.72%, indicating that GhostNet-YOLOv7 had high accuracy in identifying normal and abnormal behavior. In the third round, the accuracy of normal behavior decreased to 82.90%, but the detection rates of known and unknown abnormal behavior remained stable at 88.57% and 88.65%, respectively. The decrease may be related to the diversity of the dataset or changes in sample size. In the fifth round, the accuracy of normal behavior slightly increased to 86.56%, while the detection accuracy of known abnormal behavior and unknown abnormal behavior were 87.64% and 90.82%, respectively. In particular, the detection accuracy of unknown abnormal behaviors reached 90.82%, demonstrating the good recognition ability for novel abnormal behaviors. Overall, the accuracy of normal behavior fluctuates in different experiments and may be affected by changes in experimental conditions or data sample composition. The accuracy of known abnormal behavior is relatively stable, demonstrating that GhostNet-YOLOv7 has strong detection ability and good adaptability on known patterns.
To verify the robustness and efficiency advantages of the system, the following four groups of experiments are designed. The first group is a multi-modal sensor data test, with data sources including a self-built warehouse multi-modal dataset. The data types include visible light (RGB), infrared thermal imaging (IR), LiDAR point cloud (3D), and millimeter-wave RADAR (RADAR) data. Each type of sensor data is divided into a training set and a test set in an 8:2 ratio. The test set includes labels for normal (80%), known anomalies (15%), and unknown anomalies (5%). The second group is an Out-Of-Distribution (OOD) generalization test. The OOD scenarios mainly include low illumination (30 lux), rain and fog simulation (visibility 10 m), and high dynamic blur (target speed 8 m/s). The third group is an adversarial robustness test, and the adversarial attack methods are FGSM and PGD attacks. The fourth group is the computational efficiency and significance test. The efficiency indicators include FPS, FLOPs, and parameter count. The statistical test is a paired t-test on the mAP@0.5, totaling 10 independent experiments. The specific experimental results are shown in Table 6.
Table 6 Robustness and efficiency verification of different models
| Test Category | Test Project | GhostNet-YOLOv7 | YOLOv7 | YOLOv5 | Faster R-CNN | SSD | Statistical Test p Value (vs. YOLOv7) |
| Multi-modal data (mAP@0.5) | Visible light (RGB) | 0.943 | 0.921 | 0.897 | 0.846 | 0.725 | 0.012 |
| Infrared (IR) | 0.886 | 0.802 | 0.764 | 0.709 | 0.603 | 0.001 | |
| LiDAR (3D) | 0.829 | 0.738 | 0.681 | 0.654 | 0.557 | 0.003 | |
| OOD generalization test | Low illumination (AUC-ROC) | 0.823 | 0.761 | 0.715 | 0.682 | 0.502 | 0.007 |
| Rain and fog scene (FPR@95% TPR) | 0.237 | 0.345 | 0.421 | 0.489 | 0.618 | 0.018 | |
| Adversarial robustness | FGSM attack (mAP@0.5) | 72.5% (21.8%) | 58.1% (34.0%) | 52.3% (37.4%) | 47.8% (37.3%) | 29.6% (60.1%) | 0.001 |
| PGD attack (FPS fluctuation) | 0.032 | 0.087 | 0.125 | 0.153 | 0.224 | 0.004 | |
| Computational efficiency | Average FPS (1080p@20FPS) | 67.5 | 38.2 | 45.6 | 28.9 | 53.4 | / |
| FLOPs (G) | 22.8 | 105.3 | 76.4 | 134.7 | 31.9 | / | |
| Parameter quantity (M) | 14.2 | 51.8 | 36.7 | 69.5 | 24.3 | / |
The GhostNet-YOLOv7 demonstrated significant technical advantages in multi-modal, out-of-distribution, and adversarial scenarios. In the multi-modal data test, the mAP@0.5 of its visible light, infrared, and LiDAR scenarios reached 94.3%, 88.6% and 82.9% respectively, which was 2.2–9.1% higher than that of YOLOv7. This is attributed to the ability of Ghost Module to dynamically adapt the feature differences of multiple sensors through linear transformation. For instance, in infrared thermal images, the pyrogenic features of the human body are efficiently focused through lightweight separation convolution, while in LiDAR point clouds, the sparsity of depth-separable structures enhances the efficiency of three-dimensional space coding. In the OOD generalization test, the AUC-ROC under low illumination reached 0.823 (p 0.007), thanks to the enhanced attention mechanism of the ELAN-H module, which suppressed ineffective background interference at a low signal-to-noise ratio, and the FPR@95% TPR (23.7%) in the rain and fog scene was 10.8% lower than that of YOLOv7. The model effectively alleviates the interference of scattered noise on the target contour through multi-scale feature fusion. In the adversarial attack test, GhostNet-YOLOv7 reduced mAP@0.5 by only 21.8% under FGSM attack, significantly better than the 34.0% reduction of YOLOv7, because GhostNet’s lightweight redundant structure (such as multi-branch linear transformation) is naturally robust to minor disturbances. However, the FPS fluctuation (3.2%) under PGD attack was only 36.8% of that of YOLOv7, verifying its reasoning stability. In terms of computational efficiency, the FLOPs (22.8G) and parameter count (14.2M) of the model were 21.7% and 27.4% of YOLOv7, respectively. The real-time performance of 67.5 FPS is attributed to optimizing the computational density of the backbone network by spatially separable convolution. The statistical significance (p 0.05) further indicates that this model breaks through the computational bottleneck of traditional detectors while maintaining high accuracy, providing a reliable theoretical and practical basis for the deployment of edge devices in warehouses.
4 Discussion
In the above experiment, performance validation is conducted using the Awake dataset. The average precision in the training and testing sets were 86.8% and 83.2%, respectively, with recall rates of 77.6% and 76.5%, far higher than that of Faster R-CNN (74.8%), YOLOv5 (69.1%), and SSD (66.6%). In addition, the accuracy in detecting normal, known, and unknown abnormal behaviors was 88.21%, 86.98%, and 88.72%, respectively. This indicates that it not only has strong learning ability, but also significant robustness and adaptability in practical applications. The above research results reflect the significant advantages of the GhostNet-YOLOv7 in detecting abnormal behaviors in e-commerce warehouse management. The advantage of the GhostNet-YOLOv7 lies in its efficient feature extraction capability. The Ghost Module enhances feature expression and shortens training and inference time by generating more feature maps while maintaining low computational complexity. DSC effectively reduces parameters and computational complexity, especially in the process of multi-level feature fusion and resolution restoration. By combining spatial pyramid pooling and SPPCB module, this model can capture and fuse features.
Relatively speaking, Farooq M U et al. took a finite time Lyapunov exponent field to detect abnormal crowd behavior in surveillance videos. The results exceeded existing methods in accuracy [22]. Bahamid A et al. classified crowd evacuation into data-driven and goal driven methods. The CNN and recurrent neural networks have advantages in anomaly detection and prediction. However, complex network models still face the insufficient real-time performance [23]. To quantitatively verify the superiority of GhostNet-YOLOv7, the study compared it with the model proposed by Farooq et al. and Bahamid et al. on public datasets. GhostNet-YOLOv7 reached 83.2% at mAP@0.5, which increased by 8.6% and 14.3% compared with the 74.6% obtained by Farooq et al. and the 68.9% obtained by Bahamid et al. This precision advantage is mainly attributed to the improved ELAN module in fine-grained anomaly recognition and the reduced missed detection rate of the SPPCB module in temporal behavior modeling. In addition, the inference speed of GhostNet-YOLOv7 reached 67.5 FPS, which surpassed the 9.7 FPS of the Farooq model and the 14.2 FPS of the Bahamid model, verifying the effectiveness of its lightweight design. The parameter size was only 14.2M, equivalent to 15.9% and 32.6% of the Farooq and Bahamid models respectively, making it suitable for edge computing devices such as Jetson Nano. Therefore, GhostNet-YOLOv7 performs outstandingly on accuracy, real-time performance, and parameter efficiency. Although GhostNet-YOLOv7 performs well, there are still some limitations. Firstly, in the low-light environment, especially in the low-illumination scene at night, the detection rate mAP@0.5 of abnormal behavior by the model decreased from 83.2% to 69.4%. This was mainly due to the insufficient sensitivity of the Ghost Module to low-contrast features, which leads to mistakenly identifying the shadow of goods as containing items when monitoring auxiliary lighting faults, resulting in a 9.7% increase in false detection rate. Secondly, in densely occluded scenarios, such as crowded warehouses with a goods stacking rate exceeding 60%, the recall rate for partially occluded targets dropped from 80.5% to 63.1%. This is mainly attributed to the interference of occluded objects in target feature extraction. Finally, for high-speed moving targets, the model is confronted with the dynamic blurring, which increases the MAE of the aspect ratio prediction from 0.0023 to 0.0071, with an error growth of up to 209%, revealing the limitations of its ability in time series modeling.
5 Conclusion
In the context of e-commerce logistics and warehouse management, an improved YOLOv7 model was proposed to address the abnormal behavior detection in warehouse monitoring. This model combined GhostNet with deep separable convolution technology to achieve efficient real-time object detection. During the research process, the GhostNet-YOLOv7 model constructed significantly optimized the performance of the model by introducing innovative Ghost Module and deep separation convolution, lowering computational complexity and improving inference speed. In the experiment, the results reflect the efficiency and reliability of the GhostNet-YOLOv7 model in various complex environments, especially in quickly and accurately identifying abnormal behavior. The performance advantage has important practical significance for ensuring the security of e-commerce warehouse management, effectively reducing false alarm rates, improving the alarm accuracy, and supporting decision-makers’ response capabilities and disposal efficiency in real-time monitoring. Despite achieving good results, there are still some shortcomings. Although the computational complexity is reduced, further lightweight optimization is still necessary for real-time processing of high-resolution video streams to ensure efficient operation on resource limited devices. Future research directions can focus on exploring multi-modal data fusion techniques, such as combining video surveillance with sensor data, to enhance the ability to identify abnormal behavior.
Data Availability
The data used to support the findings of the research are available from the corresponding author upon reasonable request.
Conflicts of Interest
The author declares that there is no conflict of interest.
Fundings
The research is supported by: Department of Education of Fujian Province, Research on the sense of integration and influencing factors of Taiwanese teachers in Fujian universities under the integration of Fujian and Taiwan, (NO. FJJY202331); The Educational Science Research Fund of Fujian Province, Research on Personalized Talent Cultivation in E-commerce Major in the Age of Artificial Intelligence, (NO. FJJKBK24-008).
References
[1] Ma W, Lv Y. Feature extraction method of football fouls based on deep learning algorithm. International Journal of Information and Communication Technology, 2023, 22(4): 404–421.
[2] Lai L, Fang Y. Automatic Analysis and Event Detection Technology of Sports Competition Video Based on Deep Learning. Journal of Electrical Systems, 2024, 20(6s): 2025–2036.
[3] Wen X, Lai H, Gao G, Zhao Y. Video abnormal behaviour detection based on pseudo-3D encoder and multi-cascade memory mechanism. IET image processing, 2023, 17(3): 709–721.
[4] Hebbi C, Mamatha H. Comprehensive Dataset Building and Recognition of Isolated Handwritten Kannada Characters Using Machine Learning Models. Artificial Intelligence and Applications, 2023, 1(3): 179–190.
[5] Chang C W, Chang C Y, Lin Y Y. A hybrid CNN and LSTM-based deep learning model for abnormal behavior detection. Multimedia Tools and Applications, 2022, 81(9): 11825–11843.
[6] Alafif T, Alzahrani B, Cao Y, Alotaibi R, Barnawi A, Chen M. Generative adversarial network based abnormal behavior detection in massive crowd videos: a Hajj case study. Journal of Ambient Intelligence and Humanized Computing, 2022, 13(8): 4077–4088.
[7] Gao H, Zhou L, Kim J Y, Li Y, Huang W. Applying probabilistic model checking to the behavior guidance and abnormality detection for A-MCI patients under wireless sensor network. ACM Transactions on Sensor Networks, 2023, 19(3): 1–24.
[8] Rezaee K, Rezakhani S M, Khosravi M R, Moghimi M K. A survey on deep learning-based real-time crowd anomaly detection for secure distributed video surveillance. Personal and Ubiquitous Computing, 2024, 28(1): 135–151.
[9] Jiang T, Li L, Samali B, Yu Y, Huang K, Yan W, Wang L. Lightweight object detection network for multi-damage recognition of concrete bridges in complex environments. Computer-Aided Civil and Infrastructure Engineering, 2024, 39(23): 3646–3665.
[10] Li M, Chen Y, Zhang T, Huang W. TA-YOLO: a lightweight small object detection model based on multi-dimensional trans-attention module for remote sensing images. Complex & Intelligent Systems, 2024, 10(4): 5459–5473.
[11] Tian T, Cheng J, Wu D, Li Z. Lightweight underwater object detection based on image enhancement and multi-attention. Multimedia Tools and Applications, 2024, 83(23): 63075–63093.
[12] Yang M, Fan X. YOLOv8-Lite: A lightweight object detection model for real-time autonomous driving systems. ICCK Transactions on Emerging Topics in Artificial Intelligence, 2024, 1(1): 1–16.
[13] Zhou W, Cai C, Zheng L, Li C, Zeng D. ASSD-YOLO: a small object detection method based on improved YOLOv7 for airport surface surveillance. Multimedia Tools and Applications, 2024, 83(18): 55527–55548.
[14] Song Y, Guo J, Wu G, Ma F, Li F. Automatic recognition of landslides based on YOLOv7 and attention mechanism. Journal of Mountain Science, 2024, 21(8): 2681–2695.
[15] Chen J, Wen R, Ma L. Small object detection model for UAV aerial image based on YOLOv7. Signal, Image and Video Processing, 2024, 18(3): 2695–2707.
[16] Pandey S K, Bhandari A K. YOLOv7 for brain tumour detection using morphological transfer learning model. Neural Computing and Applications, 2024, 36(32): 20321–20340.
[17] Luo F, Zhang Y, Xu L, Zhang Z, Li M, Zhang W. Mask wearing detection algorithm based on improved YOLOv7. Measurement and Control, 2024, 57(6): 751–762.
[18] Zou L, Sun Q, Wu Z, et al. Lightweight detection method for industrial gas leakage based on improved YOLOv7-tiny. Multimedia Systems, 2024, 30(5): 1–16.
[19] Li Y, Li H. A novel real-time object detection method for complex road scenes based on YOLOv7-tiny. Cluster Computing, 2024, 27(9): 13379–13393.
[20] Xu S, Chen Z, Zhang H, Xue L, Su H. Improved remote sensing image target detection based on YOLOv7. Optoelectronics Letters, 2024, 20(4): 234–242.
[21] Guan C, Jiang J, Wang Z. Fast detection of face masks in public places using QARepVGG-YOLOv7. Journal of Real-Time Image Processing, 2024, 21(3): 1–13.
[22] Sikora L S, Lysa N K, Tsikalo Y I, Fedevych O Y. System-Information and Cognitive Technologies of Man-Made Infrastructure Cyber Security. Journal of Cyber Security and Mobility, 2023, 12(3): 389–414.
[23] Bahamid A, Mohd Ibrahim A. A review on crowd analysis of evacuation and abnormality detection based on machine learning systems. Neural Computing and Applications, 2022, 34(24): 21641–21655.
Biography

Exiang Chen obtained a Master’s degree in Engineering from the University of Electronic Science and Technology of China in 2011. Currently she is an associate professor at the School of Technology of Fuzhou Technology and Buisiness University. She has published over ten papers in the fields of computer and e-commerce, with a focus on e-commerce data analysis and privacy security.
Journal of Cyber Security and Mobility, Vol. 14_4, 849–876.
doi: 10.13052/jcsm2245-1439.1444
© 2025 River Publishers