Implementing RGCN Model in Network Security Big Data Analysis
Lei Zhang
Zaozhuang Municipal Government Service Center, Zaozhuang 277000,
China
E-mail: LeiZhanglll@outlook.com
Received 09 April 2025; Accepted 25 April 2025
In the context of the big data era, traditional network security protection technologies face the problem of insufficient response capabilities in detecting advanced persistent threats. The study aims to design a big data analysis method using deep learning algorithms to improve the ability to detect advanced persistent threats. The study uses ensemble learning, subgraph sampling, and thresholding to improve and optimize graph convolutional networks, in order to enhance their ability to detect traceability graphs. A preprocessing method for network logs is proposed to establish an advanced persistent threat detection model based on an improved graph convolutional network. The experimental results show that the improved graph convolutional network in the DARPA TC dataset (containing 153 samples, of which 30% are malicious samples) has an average detection accuracy of 94.9% for traceable graphs and 94% for node level intrusion detection. The average time for the research model to detect attacks is about 19 seconds, and the accuracy of detecting advanced persistent threat intrusions at the node level is 93.2%. The detection efficiency and accuracy are superior to other models. The research results provide a new technology and theoretical support for detecting network intrusions through large-scale network log data analysis, which plays an important role in enhancing network security defense capabilities.
Keywords: RGCN, boosting, APT, network logs, traceability diagram.
The Internet has brought great convenience to human life and economic activities. People use the Internet every day in their daily life and work, which also creates favorable conditions for Advanced Persistent Threat (APT) [1, 2]. APT refers to undetected network attacks aimed at long-term theft of sensitive data, conducting cyber espionage activities, or disrupting critical systems [3]. APT is different from other network threats such as ransomware, as its goal is to expand its presence in the target network without attracting attention. Intrusion detection systems can provide basic network monitoring and access control, and have good defense effects against known attack patterns [4]. However, this method relies on static feature matching and rule setting, which poses a problem of insufficient detection capability when facing APT attacks [5]. Relational Graph Convolutional Network (RGCN) updates node feature representations iteratively, which can effectively handle heterogeneous graph data and is particularly suitable for scenarios such as knowledge graphs, social network analysis, and security detection [6]. RGCN has the characteristics of multi-relationship fusion and strong generalization ability, and can effectively capture complex relationships between nodes, making it very suitable for APT detection [7]. Boosting is a technique in ensemble learning which builds a powerful classifier through the integration of several weaker classifiers, gradually improving the detection accuracy of the model through iterative processes, especially in handling complex data [8]. Many scholars have conducted related research on APT detection, RGCN, and Boosting.
Maryam Panahnejad and Meghdad Mirabi introduced an integrated methodology for intrusion detection, utilizing the Bayesian classification algorithm, in order to tackle the challenge of detecting APT attacks that are often difficult to identify when intertwined with other types of attacks. The results indicated that this method achieved a 1.9% reduction in the false positive rate and a 3.6% reduction in the false negative rate compared to existing methods, respectively. Additionally, it attained an accuracy and detection rate of 98% [9]. To solve the problem of difficult detection of APT attacks in modern warfare, Sharma Amit et al. proposed a network security monitoring model based on multidimensional mixed Bayesian trust. The results indicated that the accuracy of the research model in detecting APT malware was 92.62%, with a false positive rate of 0.0538% [10]. This demonstrates that enhancing the design of machine learning algorithms can effectively facilitate the detection of APT attacks. Ding Yan et al. designed an RGCN-based evaluation model to address the difficulty of assessing the blood-brain barrier permeability of drug molecules in brain drug development. The results indicated that the overall accuracy of the research model was 0.876, with an AUROC of 0.926 and an AUPRC of 0.865 [11]. Shi Si et al. proposed a portfolio management reinforcement learning framework GPM based on RGCN to address the issue of insufficient consideration of rich company relationships in existing intelligent decision models in portfolio trading. The test results on actual datasets from NASDAQ and NYSE showed that GPM was more effective than existing PM methods [12]. This observation revealed that RGCN exhibited significant strengths in managing multi-relationship fusion. Meeran Sheriff and Rajagopal Gayathri proposed a diagnostic model based on Boosting and AlexNet algorithms to address the issue of low accuracy in detecting attention deficit disorders among adolescents. The results indicated that the accuracy, sensitivity, and specificity of the research model for the diagnosis of attention deficit disorder in adolescents were 93.67%, 0.93%, and 0.97%, respectively [13]. To accurately evaluate the default probability in credit risk management, Zou Yao et al. proposed a fusion boosting ensemble learning method. The results indicated that the proposed hybrid ensemble method could validly balance the trade-off of credit score variance bias, and improve the accuracy of default probability prediction by 13.4% [14]. This indicated that integrating the Boosting ensemble learning algorithm with current algorithms and models has the potential to enhance their performance.
The above research indicates that many scholars have conducted relevant studies on APT detection, RGCN, and Boosting, while there is almost no research on combining RGCN and Boosting for APT detection. Consequently, a novel approach for analyzing network security big data has been devised by amalgamating RGCN and Boosting. This method enables precise and efficient detection of APT attacks within intricate networks, thereby establishing an intelligent model for APT detection. The research designs a network security big data analysis method aimed at improving the ability to identify and predict complex network attack behaviors, thereby ensuring network and information security. The innovation of the research mainly lies in two aspects. On the one hand, by integrating RGCN’s capability to capture intricate relationships with Boosting ensemble learning’s detection performance, it enhances the recognition accuracy and generalization capacity for identifying APTs. On the other hand, a network log preprocessing method for APT detection is designed, which converts the original logs into a structured traceable graph and extracts features of nodes and edges, providing high-quality input data for model training.
The study first analyzed the application of traceability graphs in APT detection, as well as the graph representation and learning ability of graph neural networks. A network security big data analysis algorithm was designed using Boosting ensemble learning combined with RGCN neural network. Afterwards, the unstructured computer system log data was preprocessed and vectorized to achieve a new representation of labels and features. Meanwhile, the graph structured data was transformed into matrix form for further analysis. By inputting preprocessed data into network security big data analysis algorithms for computation, APT intrusion behavior could be detected, thus constructing an APT detection model based on improved RGCN.
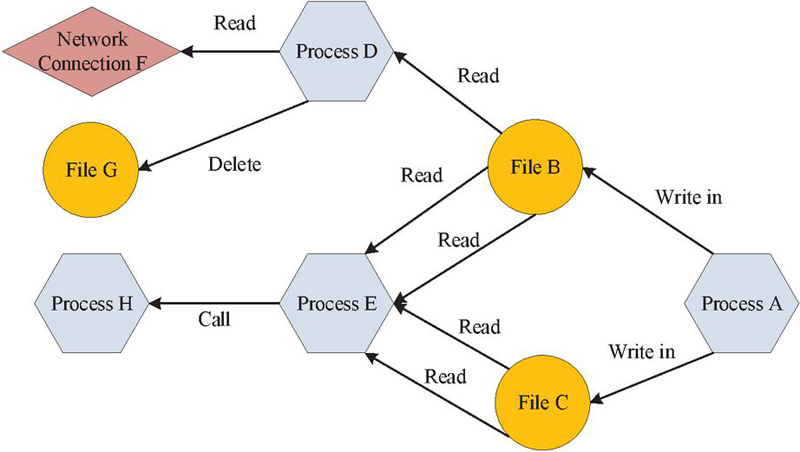
APT has the characteristics of high concealment, long duration, and strong technicality, and traditional network security protection measures are difficult to detect such attack behavior. In computer science, graph structures are divided into three types: isomorphic, heterogeneous, and attribute graphs. Heterogeneous graphs are commonly used to describe complex systems, isomorphic graphs are suitable for single relational scenarios, and attribute graphs contain rich attribute information of nodes and edges. Traceability diagram is a type of heterogeneous diagram, which is a graph structure used to represent the causal relationship between system operation behavior and events. It is commonly used for APT attack traceability and network security event analysis. Nodes in the traceability diagram can represent different entities, such as processes, threads, files, network connections, etc., while edges represent the operational relationships between these entities, such as read, write, open, and other system call events. Therefore, the study uses traceability diagrams to represent the operation history of computers, and obtains the system behavior of computers through graph structure analysis, in order to detect and trace abnormal intrusion behaviors of APT. The basic structure of the traceability diagram is shown in Figure 1.
Figure 1 Basic structural diagram of traceability diagram.
In Figure 1, the traceability diagram clearly traces a series of historical operations such as process A writing to file B, process E reading files B and C multiple times, and process E calling process H, fully demonstrating the powerful semantic expression and historical correlation ability of the traceability diagram, making it an ideal tool for APT detection. Based on the system traceability graph, this study uses Graph Convolution Network (GCN) to deeply mine graph structured data and construct a node level network security big data analysis method. GNN learns node representations by aggregating node neighbor information, including frequency domain graph convolution and spatial domain graph convolution, which can effectively perform node classification and link prediction [15]. The convolution calculation for frequency domain graph in GCN is shown in Equation (1).
| (1) |
In Equation (1), represents the attribute features of the node, is the eigenvector matrix, and is the filter. The calculation for spatial graph convolution in GCN is shown in Equation (2).
| (2) |
In Equation (2), , is the adjacency matrix. is the normalization of the matrix, . is the activation function, is the trainable weight matrix of the th layer, and is the node feature matrix of the th layer. The GCN model integrates the attributes, structure, and neighbor information of nodes into vector representations through convolution operations, providing a new approach for graph data analysis. However, GCN is more suitable for handling homogeneous graphs and has low adaptability to heterogeneous graphs. RGCN, based on GCN, considers various relationships between nodes in heterogeneous graphs and processes different types of edges through different convolution kernels to better adapt to real-world graph data. Therefore, the study adopts RGCN to establish a method for network security big data analysis. The node calculation and update diagram in RGCN is shown in Figure 2.
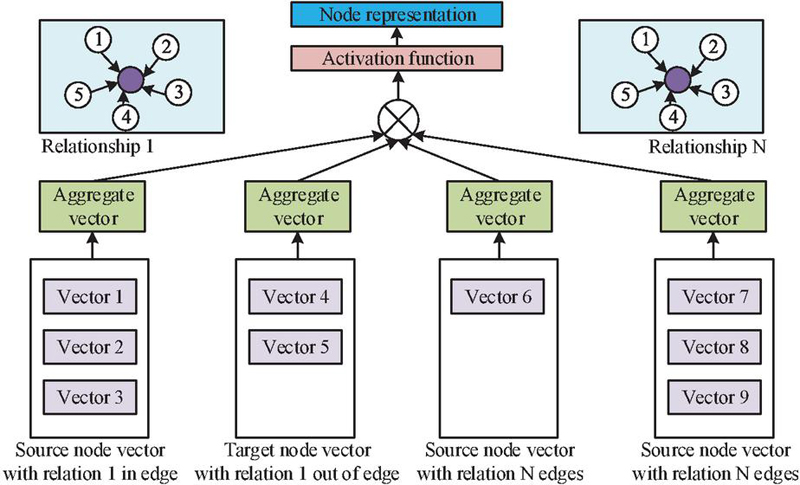
Figure 2 Diagram of node calculation and update in RGCN.
In Figure 2, the RGCN model classifies neighboring nodes based on the type of edges when aggregating neighbors. Unlike GCN, RGCN first aggregates neighbors of the same type of relationship, and then weights and fuses the aggregation results of all types of relationships according to different weight parameters. This approach allows RGCN to consider the neighboring nodes and their relationships when updating nodes, thereby better handling heterogeneous graphs. The expression for this dual aggregation method of RGCN is shown in Equation (3).
| (3) |
In Equation (3), is the weight parameter corresponding to the th layer node, and is the weight parameter corresponding to neighbors with relationships. represents data normalization, and represents node as a vector representation. is the set of neighbors that have an relationship with node , and is the set of all relationships in the graph. Among them, serves as a normalization term to balance the contribution of different types of edges to node feature updates, avoiding certain types of edges dominating the feature update process due to excessive quantity, and can be calculated through . During the process of heterogeneous graph data analysis conducted by RGCN, the presence of large-scale heterogeneous graphs can give rise to problems such as inadequate memory and extended processing durations. The subgraph sampling approach obviates the need to process the entire graph, instead concentrating solely on the subgraph formed by the target node and its K-order neighbors. The introduction of subgraph sampling for the optimization of RGCN can effectively diminish memory consumption and enhance the computational speed of RGCN. Although the improvement of RGCN has resulted in increased efficiency, it remains a challenge to ensure detection accuracy in the face of APT attacks. Boosting ensemble learning, however, continuously trains new base models, progressively focusing on nodes that are difficult to classify, thereby augmenting the model’s classification performance [16, 17]. The computational flowchart of using Boosting ensemble learning to optimize and improve RGCN is shown in Figure 3.
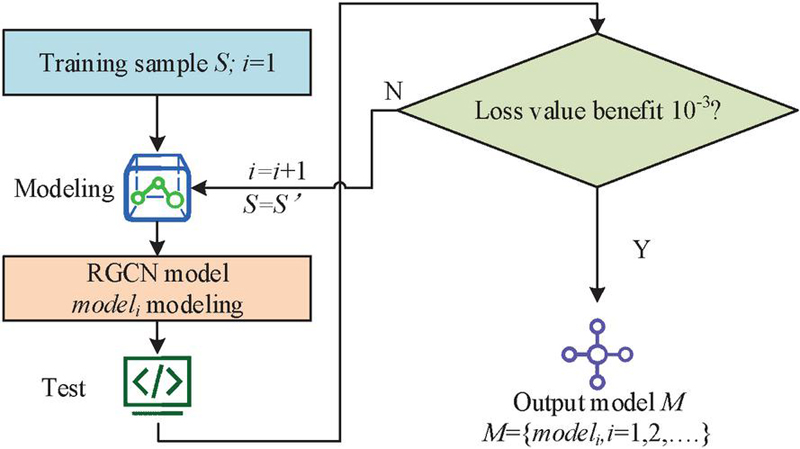
Figure 3 Calculation process of RGCN model based on Boosting integration.
Figure 3 illustrates the process where initially, all training samples are aggregated into a set denoted as S, upon which the first RGCN base model is trained. Subsequently, an evaluation of the current base model is conducted to determine the set of misclassified nodes, referred to as S’. In the event that S’ is non-empty, it is utilized as the novel training set for the subsequent RGCN base model. The above process will be repeated until the loss value is less than the set threshold of 10, at which point it can be stopped. Ultimately, a set M of multiple RGCN base models will be obtained. Through continuous iterative training, the model set M can learn the potential feature distributions of different types of nodes. Through ensemble learning, the classification ability of node types has been gradually improved. The study selects accuracy as one of the evaluation indicators for the network security big data analysis algorithm based on the improved RGCN, and the accuracy calculation is shown in Equation (4).
| (4) |
In Equation (4), and are the number of samples correctly predicted as positive or negative, is the number of samples incorrectly predicted as positive, and is the number of samples incorrectly predicted as negative. The accuracy rate is used to evaluate the proportion of correct classifications among all true classifications. The calculation for the accuracy rate is shown in Equation (5).
| (5) |
In Equation (5), represents the accuracy. The recall rate is used to evaluate the proportion of correctly classified samples among all actual categories that are true. The recall rate calculation is shown in Equation (6).
| (6) |
In Equation (6), represents the accuracy. The F1 Score is used to evaluate the proportion of correctly classified samples in all actual categories, and the recall rate calculation is shown in Equation (7).
| (7) |
This research designs an improved network security big data analysis algorithm for RGCN, which can identify abnormal features from heterogeneous graphs. The raw logs of computer operations are in text form and cannot be directly used by algorithms to identify the characteristics of APT attacks. Therefore, it is necessary to preprocess the raw log data, and the preprocessing method for raw log data is shown in Figure 4.
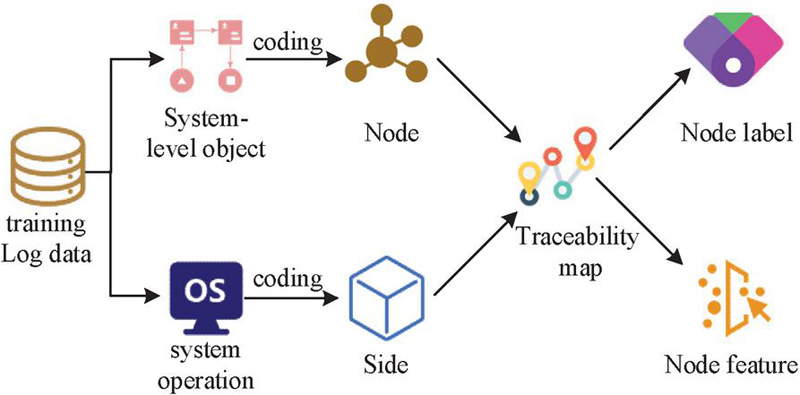
Figure 4 Preprocessing methods for raw log data.
In Figure 4, the main steps of preprocessing raw log data include structured transformation, feature extraction, and label representation. Firstly, structured transformation refers to converting text logs into a traceability graph structure in order to better represent the relationships between systems. Secondly, feature extraction extracts the features of nodes and edges from the graph and converts them into numerical form, which facilitates algorithm processing. Finally, the nodes or edges in the graph are represented by labels to differentiate between regular and irregular behavior. In the process of constructing traceability diagrams, due to the involvement of a large number of system objects and interactions in network logs, the scale of the constructed traceability diagram is relatively large. To enhance computational efficiency, an investigation is carried out into the parsing of logs with the aim of extracting system objects and operational data. Regular expressions are used to process this information and assign unique encodings to different objects and operations. Meanwhile, the types of nodes and edges are recorded. The types and codes of nodes and edges in the traceability graph are shown in Table 1.
Table 1 Types and encodings of nodes and edges in the traceability graph
| Operation (edge) type | Co de | Operation (edge) type | Co de | Operation (edge) type | Co de | System object (node) typet | Co de |
| event_write | 1 | event_fcntl | 10 | event_flows_to | 19 | Subject_Process | 1 |
| event_mmap | 2 | event_rename | 11 | event_signal | 20 | File_Dir | 2 |
| event_read | 3 | event_unlink | 12 | event_sendmsg | 21 | NetFlow | 3 |
| event_execute | 4 | event_recvfrom | 13 | event_recvmsg | 22 | UnnamedPipe | 4 |
| event_open | 5 | event_sendto | 14 | event_link | 23 | Object_File | 5 |
| event_fork | 6 | event_connect | 15 | event_truncate | 24 | Unix_Socket | 6 |
| event_exit | 7 | event_princpal | 16 | event_modify_file_attibutes | 25 | / | / |
| event_create_object | 8 | event_lseek | 17 | event_accept | 26 | / | / |
| event_close | 9 | event_modify_process | 18 | event_other | 27 | / | / |
By encoding the information in Table 1, the original network logs are transformed into a structured traceability graph, providing a foundation for APT detection and analysis. To address the challenges posed by incomplete or noisy log data, the following robustness measures are implemented: Firstly, a default encoding is assigned to undefined operations or missing records, thereby ensuring the construction of the graph structure even in the absence of explicit recordings of certain operations or events. Secondly, during log parsing, if unrecognized formats or missing fields are encountered, these records are skipped, and error logs are recorded instead of disrupting the entire processing workflow. Thirdly, the edge loss rate is meticulously maintained below 5% by calculating the proportion of edges lost due to missing or inaccurate information. This helps evaluate the impact of preprocessing methods on graph structural integrity. To represent the connection relationship between nodes, each log information is encoded into a vector. The elements in the vector include source node ID, source node type, target node ID, target node type, and edge type. The edge type set is represented by , the node type set is represented by , the edge set is represented by , and the node set is represented by . The type of each edge is represented by , the type of each node is represented by , the target node of each edge is represented by , and the source node of each edge is represented by . The edges of the traceability graph are represented by , and the nodes of the traceability graph are represented by . In the label representation stage of raw log data preprocessing, there are two types: node label definition and node feature definition. The definition of node labels will result in substantial alterations to the node characteristics associated with APT attacks, ultimately causing classification errors and impeding the detection of APT intrusions. The label definition expression is shown in Equation (8).
| (8) |
In Equation (8), is the label of the node in the traceability graph , . The definition of node features employs the degree of ingress and egress to denote the number of edges where the node serves as the source and target, respectively. Additionally, it takes into account the impact of diverse edge types, utilizing them to more accurately reflect the node’s role within the graph. The node feature definition utilizes these two methods to better capture the local structural information of nodes, enabling the improved RGCN to accurately identify anomalous features from heterogeneous graphs. The expression for defining node features is shown in Equation (9).
| (9) |
In Equation (9), is the value of in the th dimension. To enhance the accuracy of RGCN detection, cross entropy is used as the loss function, and the expression of cross entropy is shown in Equation (10) [18].
| (10) |
In Equation (10), is a non-real distribution and is a real distribution. To better match the characteristics of the traceability graph, the expression after cross entropy adjustment is shown in Equation (11).
| (11) |
In Equation (11), is the true label of the node, is the number of nodes involved in modeling, and is the possibility of predicting the type of the th node as . The expression for is shown in Equation (12).
| (12) |
According to Equation (12), the expression for the value range of is shown in Equation (13).
| (13) |
By designing an appropriate loss function and feeding the preprocessed network log data into the enhanced RGCN, it becomes possible to discern the anomalous features associated with APT attacks, thereby facilitating the development of an APT detection model based on the improved RGCN. The model structure is shown in Figure 5.
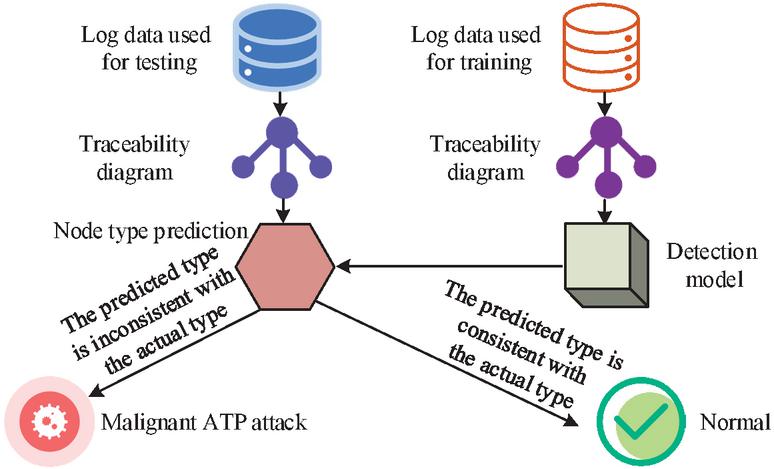
Figure 5 Prediction model for construction fatigue of construction workers.
In Figure 5, the log data is divided into a training set with only benign nodes and a test set containing both benign and malignant nodes. The model preprocesses the log data, constructs a traceability graph, and extracts node features. The specific operations of preprocessing are as follows: Firstly, the call logs are recorded through the log system. Secondly, the subject and object information in the logs is extracted and taken as the nodes of the traceability graph. Then, based on the call relationships recorded in the logs, the edges between the nodes are determined. Finally, the open-source tool UNICORN is used to analyze the relationship between these nodes and edges and generate a traceability graph. The improved RGCN algorithm is used to classify node types and improve detection precision. Finally, the model is validated on the test set, and nodes with inconsistent classifications are considered malignant, thus establishing an APT detection model based on improved RGCN. During the model debugging phase, as the detection target and training target are not the same, it is necessary to explain the outputs of the base model and ensemble model. The expression for the output of the base model is shown in Equation (14).
| (14) |
In Equation (14), represents the value of in the dimension, represents the output of node based on the base model , and represents the classification result of node . The expression for the output of the integrated model is shown in Equation (15).
| (15) |
In Equation (15), represents the classification result of the ensemble model. When detecting the benign or malignant nature of nodes, the base model is used for type prediction. If the prediction is correct, the node is considered benign and is marked as 0. Otherwise, it is considered malignant and marked as 1. This method effectively achieves node level APT attack detection.
To testify the performance of the APT detection model based on the improved RGCN, relevant experiments were conducted. The experiment conducted performance testing on the improved RGCN algorithm, testing the improvement effect of subgraph sampling and ensemble learning on RGCN, as well as verifying the feature recognition ability of the improved RGCN. Afterwards, the APT detection model based on the improved RGCN was compared and tested with other APT detection models to verify the accuracy of the research model for APT intrusion detection.
To evaluate the performance of the algorithm employed in this study, a comparative analysis and testing were conducted between the improved RGCN algorithm and existing APT detection methods, namely Unicorn and Streamspot. This assessment aimed to examine the detection capabilities of the enhanced algorithm on traceability maps. Furthermore, a comparative test was conducted on the accuracy of node level APT detection using Hierarchical Attention Networks (HAN) and NetTalk algorithm. The computer configuration used in the experiment was Intel®CoreTM i9-11900K. The memory was 20GB and the CPU had 12 cores at 2.1GHz. Acquiring computer system logs at the enterprise level with genuine labels poses substantial challenges due to privacy safeguards, confidentiality constraints, and the infrequency of attack behaviors. Therefore, the data used for model training and testing were all sourced from the open source dataset DARPA TC in the field of network security as the testing base data. During the training process, 80% of the benign images were used as the training set, and the remaining data were used as the testing set. The detailed information of the DARPA TC dataset is shown in Table 2.
Table 2 DARPA TC dataset details table
| Number of | Number of | Average | Average | |
| Benign | Malignant | Number of | Number of | |
| Data Sources | Images | Images | Edges Per Graph | Nodes Per Graph |
| THEIA | 2 | 25 | 696855 | 24065 |
| ClearScope | 43 | 51 | 4239292 | 7442 |
| CADETS | 8 | 66 | 117076 | 9728 |
In Table 2, the DARPA TC dataset contained five exercises, of which the records of the 3rd and 5th exercises were publicly available and named DARPA TC3 and TC5, recording the attack and defense logs of THEIA, ClearScope, and CADETS teams against different operating systems, allowing for detailed analysis based on system sources. In addition, the malignant proportion of this dataset was 72.8%, indicating the existence of class imbalance, which could more comprehensively evaluate the model’s generalization ability and detection ability for different categories. The DARPA TC dataset provided compressed logs and attack markers for traceability graph construction and attack analysis, commonly used to validate the accuracy of APT detection methods. The parameter settings for improving the RGCN model are shown in Table 3.
Table 3 Improve the parameter settings of RGCN model
| Parameter Description | Parameter Values | Parameter Description | Parameter values |
| Number of central nodes collected in each batch | 2000 | Weight attenuation coefficient | 3*10 |
| Maximum training epochs for the base model | 100 | Dropout ratio setting | 0.5 |
| The subgraph sampling process collects the order of neighbors from the central node | 3 | Maximum number of base models | 30 |
| Dimension of RGCN’s first hidden layer vector | 32 | Threshold for node type classification | 0.65 |
| Dimension of RGCN second layer hidden layer vector | 16 | Maximum number of failed base model modeling attempts | 3 |
| Learning rate | 0.001 | / | / |
To evaluate the robustness of log preprocessing using the aforementioned dataset, the focus was initially placed on the edge loss rate. Following the manual and random deletion of 10% of the event write records, the reconstructed graph attained an edge integrity of 96.7%. Then, in terms of noise tolerance, when injecting random field errors (5% of log lines), the accuracy of node type recognition remained at 93.4%. Finally, the verification was conducted in the financial system of Enterprise M, which included 30% non-standard events, and the success rate of graph construction was 91.2%. In addition, the study also reported the delay test results of the improved RGCN model under real-time flow logs in the financial system of Enterprise M. The results showed that when the log flow rate was 100 records per second, the average processing delay of the model was 50ms. When the log flow rate increased to 500 records per second, the average processing delay increased to 150ms, but still within an acceptable range.
The training samples were input into the improved RGCN algorithm for training, and the visualization of the feature data for the first and last iterations is shown in Figure 6.
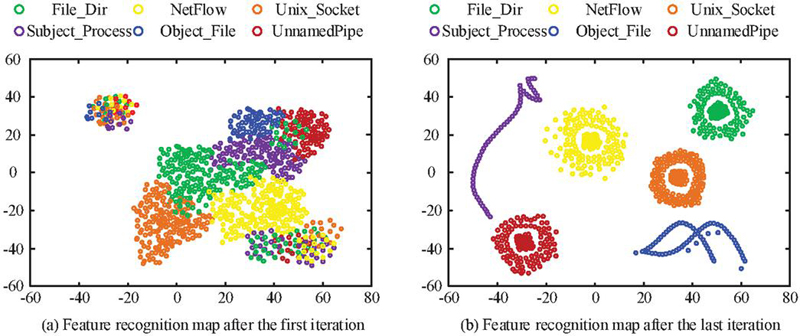
Figure 6 Visualization results of identifying traceability map features before and after iteration.
The different colored dots in Figure 6 represent different traceability map features. As shown in Figure 6(a), the recognition results of the six features were closely connected and intersect with each other, and the initial iteration could not recognize and classify the fault features. As shown in Figure 6(b), after completing the last iteration, the recognition results of the six features were clustered and discretized from each other. From a quantitative perspective, the contour coefficients before and after iteration were 0.35 and 0.82, respectively, while contour coefficients exceeding 0.7 were considered strong clustering. The inter class distance ranged from 1.2*10 to 3.7*10, and the average inter class distance increased by three times, indicating that the research method could effectively separate APT attack features. The results indicated that the improved RGCN algorithm could recognize traceability map features and achieve accurate classification. The research compared the improved RGCN algorithm with Unicorn and Streamspot to test the accuracy of each algorithm in detecting traceability maps. The comparison results are shown in Figure 7.
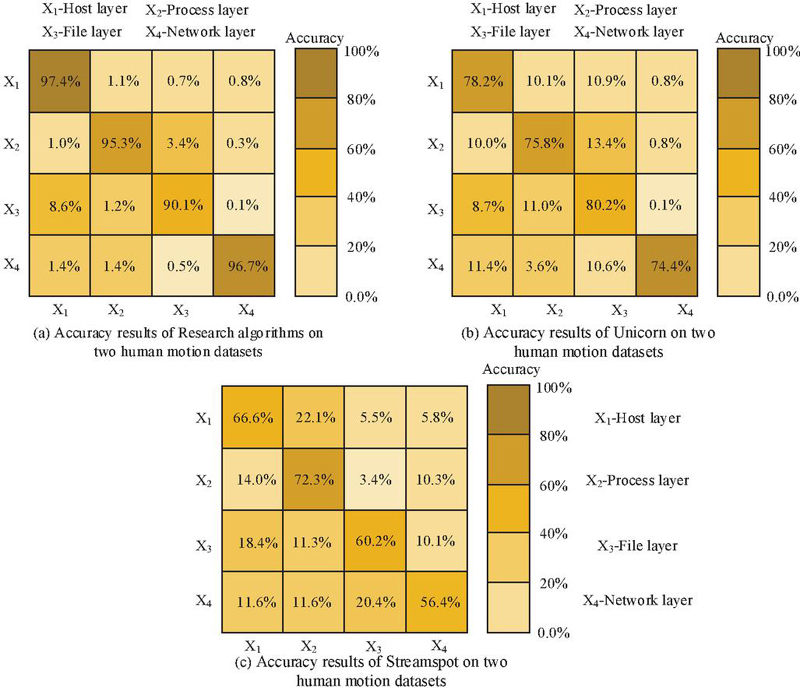
Figure 7 Test results of four algorithms on two human motion datasets.
In Figure 7(a), in terms of detection accuracy at the traceability level, the improved RGCN algorithm achieved accuracies of 97.4%, 95.3%, 90.1%, and 96.7% for the detection of four traceability levels, respectively. In Figure 7(b), Unicorn achieved accuracies of 78.2%, 75.8%, 80.2%, and 74.4% for detecting the four types of traceability maps, respectively. In Figure 7(c), Streamspot achieved accuracies of 66.6%, 72.3%, 60.2%, and 56.4% for detecting four types of traceability maps, respectively. The results showed that the improved RGCN algorithm had better detection accuracy at the traceability level than Unicorn and Streamspot detection methods. To conduct a more comprehensive assessment of the algorithm’s performance, an investigation and evaluation of the accuracy and recall rates of each algorithm in relation to node-level intrusion detection were carried out. The experimental results are shown in Figure 8.
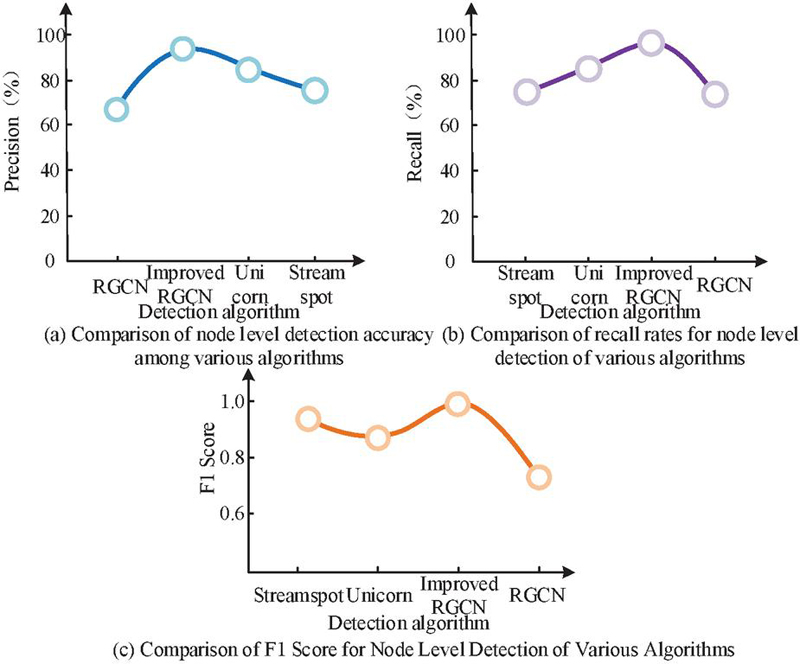
Figure 8 Comparative experimental results of RF-PSO-PCA and RF-PCA.
In Figure 8(a), the precision rates of RGCN, Unicorn, Streamspot, and improved RGCN algorithms for node level intrusion detection were 66%, 73%, 85%, and 94%, respectively. In Figure 8(b), the recall rates of RGCN, Unicorn, Streamspot, and improved RGCN algorithms for node level intrusion detection were 71%, 74%, 82%, and 94%, respectively. In Figure 8(c), the F1 Scores of RGCN, Unicorn, Streamspot, and improved RGCN algorithms for node level intrusion detection were 0.72, 0.93, 0.87, and 0.98, respectively. The results showed that the improved RGCN algorithm had better precision in node level intrusion detection than Unicorn and Streamspot intrusion detection methods. This demonstrated that employing Boosting Ensemble Learning and subgraph sampling to enhance and refine the RGCN has led to a substantial improvement in the accuracy of intrusion detection.
The above experiment showed that the improved RGCN used in the study had high node intrusion and traceability graph detection capabilities. To verify the performance of the APT detection model based on the improved RGCN, a comparative experiment was conducted between the APT detection model based on NetTalk, Hybrid Attention Network (HAN), Streamspot, Unicom, and the research model. Firstly, the computational efficiency of three models was tested, and a detection time without sampling was introduced to verify the improvement effect of subgraph sampling on efficiency. The subgraph size was set to K 2 neighbors, and the test results are shown in Figure 9.
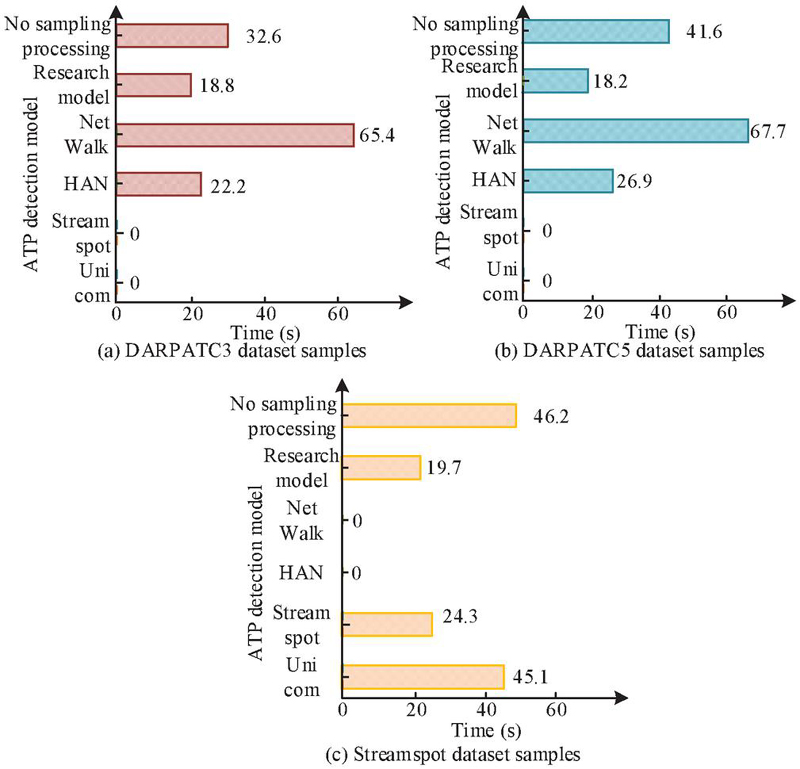
Figure 9 Comparison of calculation time among various APT detection models.
In Figure 9, the HAN model detected APT attacks in the DARPATC3 dataset in 22.2 seconds and in the DARPATC5 dataset in 26.9 seconds. The NetTalk model detected APT attacks in the DARPATC3 dataset in 65.4 seconds and in the Streamspot dataset in 67.7 seconds. The research model detected APT attacks in the DARPATC3 dataset at a time of 18.8 seconds, in the DARPATC5 dataset at a time of 18.2 seconds, and in the Streamspot dataset at a time of 19.7 seconds. The Unicom model detected APT attacks at a time of 45.1 seconds, while Streamspot detected APT attacks at a time of 24.3 seconds. The detection time of the no sampling processing method in the DARPATC3 dataset, DARPATC5 dataset, and Streamspot dataset was 32.6 s, 41.6 s, and 46.2 s, respectively. However, the computational efficiency of the improved RGCN model was significantly improved, increasing by 42.33%–57.36%. The above results were due to the use of subgraph sampling strategy in the research method, which only focused on subgraphs composed of nodes and their K-order neighbors, rather than processing the entire large star graph. This significantly reduced the amount of data that needed to be processed, thereby reducing computational complexity and time. This strategy allowed the model to ignore irrelevant data while maintaining key information, thereby improving computational efficiency. The study selected the model with higher computational efficiency from the above experiments for further testing. The experiment results of the three models detecting APT attacks at the node level are shown in Figure 10.
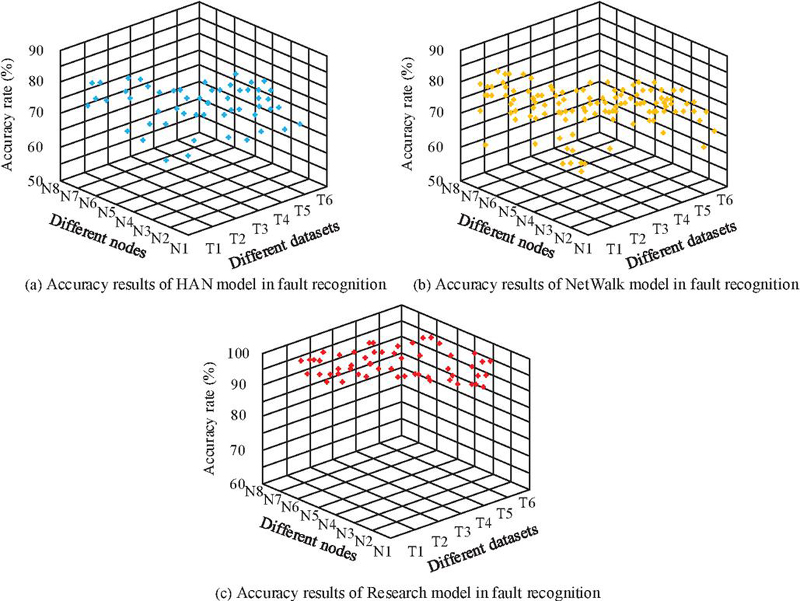
Figure 10 Comparison of four algorithms for fault recognition in three parts.
In Figure 10(a), the average accuracy of the HAN model in detecting APT attacks at the node level was 75.8%. In Figure 10(b), the NetWalk model had an average accuracy of 76.9% in detecting APT attacks at the node level. In Figure 10(c), the average accuracy of the research model in detecting APT attacks at the node level was 93.2%. The results indicated that the research model ensured the accuracy of node level APT attack detection while quickly detecting APT attacks. To further evaluate the above results, paired t-test and independent t-test were introduced for statistical analysis. Firstly, independent sample size testing was used to compare different models, and THEIS was used for testing. To assess the generalization capacity of the research model, it was postulated that DARPATC3 and DARPATC35 constitute paired samples intended for testing purposes. The results are shown in Table 4.
Table 4 Statistical test results
| Accuracy or | Standard | 95% | ||||
| Mean | Deviation/ | Confidence | ||||
| Project | Method | Deviation | % | t | p | Interval |
| Different methods | Research model vs HAN model | 17.4 | 4.7 | 12.1 | 0.001 | [15.2,19.6] |
| Different datasets | DARPATC3 vs DARPATC35 | 1.5 | 1.8 | 4.31 | 0.001 | [0.8,2.2] |
According to Table 4, there was a significant difference in accuracy between the research model on DARPATC3 and TC5 (), and the confidence interval did not include 0, indicating stable generalization performance. The value difference of 1.5% in the research model was significantly better than HAN (), and the confidence interval was much higher than 0, verifying its advantage. In practical applications, it may be negligible, but statistically significant, supporting model robustness. Even with a small sample size (n 27), the effect size (Cohen’s d 3.7) was extremely large, reducing the risk of false positives. To verify the generalization ability of the model, experiments were conducted using six different types of dataset samples, and the experimental results are shown in Figure 11.
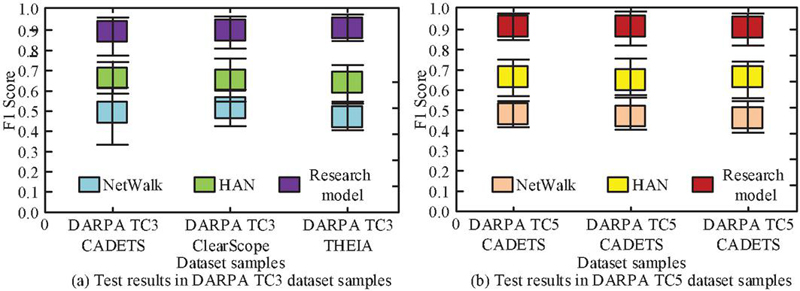
Figure 11 Experimental results of fatigue prediction for various models.
In Figure 11, the research model tested APT intrusion detection on six datasets with an average F1 Score of 0.91, a minimum of 0.77, and a maximum of 0.99. The average F1 Score of the HAN model for APT intrusion detection tested on six datasets was 0.66, with a minimum value of 0.52 and a maximum value of 0.73. The average F1 Score of NetWalk tested on 6 datasets was 0.49, with a minimum of 0.32 and a maximum of 0.60. The results indicated that the research model outperformed other models in multiple datasets and had high generalization ability.
The results of testing the improved RGCN algorithm showed that its average detection accuracy for traceability graph was 94.9%, and its detection accuracy for node level intrusion was 94%, significantly better than other algorithms. This result was similar to the research conducted by Wen et al. using an improved RGCN to detect multi-intent information in discourse [19]. The results indicated that the improved feature detection capability of RGCN was effectively enhanced. The research model detected APT attacks in the DARPATC3, DARPATC5, and DARPATC5 datasets at times of 18.8 seconds, 18.2 seconds, and 19.7 seconds, respectively. Duan et al. transformed APT intrusion into a link prediction task on heterogeneous graphs and proposed a meta path context-based APT detection model with similar conclusions [20]. The results indicated that using RGCN to detect APT intrusion from heterogeneous graphs was extremely efficient. The accuracy of the research model in detecting APT attacks at the node level was 93.2%, and the average F1 Score tested on six datasets was 0.91, which was better than other models. This result was similar to the conclusion proposed by Jing et al. to use APTMalKG knowledge graph for detecting APT intrusion [21]. The results indicated that the method of using traceability graph to detect APT intrusion not only had high computational efficiency, but also had a better ability to detect APT intrusion than other models.
With the rapid development of the Internet, APTs have become an important issue threatening network security. The research proposed an intelligent APT detection model aimed at improving the detection capability of APT intrusion. The research reformed the RGCN to capture complex relationships in the network big data traceability graph, and optimized it with the predictive performance of Boosting ensemble learning to construct an APT detection model based on improved RGCN. The research results indicated that the research model could quickly and accurately identify APT attacks, which was more advantageous than other methods. Given the challenges associated with gathering APT intrusion datasets and the perpetual advancement of network attack methodologies, current experimental datasets frequently fail to keep pace with the most recent attack strategies. Consequently, an essential focus for future research lies in the ongoing renewal of datasets and refinement of model algorithms to guarantee their efficacy in ensuring security and practicality.
The author declares that there is no conflict of interest.
[1] Lagraa S, Husak M, Seba H, Vuppala S, State R, Ouedraogo M. A review on graph-based approaches for network security monitoring and botnet detection. International Journal of Information Security, 2024, 23(1):119–140.
[2] Smiliotopoulos C, Kambourakis G, Barbatsalou K. On the detection of lateral movement through supervised machine learning and an open-source tool to create turnkey datasets from Sysmon logs. International Journal of Information Security, 2023, 22(6):1893–1919.
[3] Kumar R, Kela R, Singh S, Trujillo-Rasua R. APT attacks on industrial control systems: A tale of three incidents. International Journal of Critical Infrastructure Protection, 2022, 37(1):1–11.
[4] Abu Al-Haija Q, Al Badawi A. High-performance intrusion detection system for networked UAVs via deep learning. Neural Computing and Applications, 2022, 34(13):10885–10900.
[5] Amir B, Mehdi F M. APAE: an IoT intrusion detection system using asymmetric parallel auto-encoder. Neural computing & applications, 2023, 35(7):4813–4833.
[6] Yang Y, Qi Y, Qi S. Relation-consistency graph convolutional network for image super-resolution. The visual computer, 2024, 40(2):619–635.
[7] Mao C, Yao L, Luo Y. ImageGCN: Multi-Relational Image Graph Convolutional Networks for Disease Identification With Chest X-Rays. IEEE transactions on medical imaging, 2022, 41(8):1990–2003.
[8] Aydin H E, Iban M C, Glade T. Predicting and analyzing flood susceptibility using boosting-based ensemble machine learning algorithms with SHapley Additive exPlanations. Natural Hazards, 2023, 116(3):2957–2991.
[9] Panahnejad M, Mirabi M. APT-Dt-KC: advanced persistent threat detection based on kill-chain model. The Journal of Supercomputing, 2022, 78(6):8644–8677.
[10] Sharma A, Gupta B B, Singh A K, Saraswat V K. A novel approach for detection of APT malware using multi-dimensional hybrid Bayesian belief network. International Journal of Information Security, 2023, 22(1):119–135.
[11] Yan D, Xiaoqian J, Yejin K. Relational graph convolutional networks for predicting blood–brain barrier penetration of drug molecules. Bioinformatics, 2022, 38(10):2826–2831.
[12] Shi S, Li J, Li G, Pan P, Chen Q, Sun Q. GPM: A graph convolutional network based reinforcement learning framework for portfolio management. Neurocomputing, 2022, 498(7):14–27.
[13] Sheriff M, Rajagopal G. An enhanced ensemble machine learning classification method to detect attention deficit hyperactivity for various artificial intelligence and telecommunication applications. Computational Intelligence, 2022, 38:1327–1337.
[14] Zou Y, Gao C, Xia M, Pang C. Credit scoring based on a Bagging-cascading boosted decision tree. Intell. Data Anal. 2022, 26(6):1557–1578.
[15] Chen L, Zhang Q .DDGCN: graph convolution network based on direction and distance for point cloud learning. The visual computer, 2023, 39(3):863–873.
[16] Zhu Z, Ma X, Wang W, Dong S, Wang K, Wu L, Luo G, Wang G, Li S. Boosting knowledge diversity, accuracy, and stability via tri-enhanced distillation for domain continual medical image segmentation. Medical image analysis, 2024, 94(1):103112–103112.
[17] Dawson, J.K., Twum, F., Acquah, J.B.H. and Missah, Y.M. 2024. Cryptographic Solutions for Data Security in Cloud Computing: A Run Time Trend-based Comparison of NCS, ERSA, and EHS. Journal of Cyber Security and Mobility. 13, 02 (Feb. 2024), 265–282. https://doi.org/10.13052/jcsm2245-1439.1324.
[18] Jiao J, Chen Z, Zhou T. Minimal Kapur cross-entropy-based image segmentation for distribution grid inspection using improved INFO optimization algorithm. Journal of supercomputing, 2024, 80(3):4309–4352.
[19] Lehmoud, A.A.M., Slman, F.M., Mohamed, M.Q., Joda, F.A. and Aldulaimi, M.H. 2024. Addressing The Concern of Malicious Drone in The Internet of Drone Sixth Generation Mobile System Powered by WSNs Using Three Security Levels. Journal of Cyber Security and Mobility. 13, 6 (Nov. 2024), 1449–1466. https://doi.org/10.13052/jcsm2245-1439.13610.
[20] Duan J, Luo Y, Zhang Z, Peng J. A heterogeneous graph-based approach for cyber threat attribution using threat intelligence. Proceedings of the 2024 16th International Conference on Machine Learning and Computing. 2024, 2(1):87–93.
[21] Jing R, Jiang Z, Wang Q, Wang S, Hao L, Chen X. From Fine-Grained to Refined: APT Malware Knowledge Graph Construction and Attribution Analysis Driven by Multi-stage Graph Computation. International Conference on Computational Science. Cham: Springer Nature Switzerland, 2024, 1(14832):78–93.

Lei Zhang, male, from Zaozhuang, Shandong, is an independent person with a postgraduate degree in Computer Science and Technology from Shandong University. Senior Information System Project Manager, Chief Data Representative of Zaozhuang City, Information Technology Expert of Administrative Approval Expert Database, and Director of Zaozhuang Non Party Intellectuals Association. Awarded the title of Excellent Window Service Model of Zaozhuang Citizen Center, first prize in the 2nd Shandong Province Big Data Technology and Application Vocational Skills Competition (Blockchain Technology and Innovation Application Competition), and third prize in the city and county group of the first Shandong Province Digital Agency “Data Empowerment Business” Competition for digital skills.
Journal of Cyber Security and Mobility, Vol. 14_2, 505–530.
doi: 10.13052/jcsm2245-1439.14210
© 2025 River Publishers