Intelligent Grid Load Anomaly Detection and Interval Forecasting via GESD-LOF and an Improved Transformer
Jingkun Yao, Jie Yang* and Yonghao Wang
School of Electrical Engineering and Automation, Henan Institute of Technology, Xinxiang 453003, China
E-mail: hngxyyjk@126.com
*Corresponding Author
Received 10 July 2025; Accepted 16 August 2025
Abstract
As information technology continues to evolve, the intelligence level of the power system is also constantly increasing. However, there are problems such as insufficient timeliness and low accuracy in the abnormal detection and interval prediction of power load data. Therefore, the research proposes an anomaly detection algorithm that combines generalized range testing with local anomaly factors, as well as an interval prediction model that improves the Transformer model. This method uses a sliding window to improve the generalized range test, optimizes local anomaly factors using reachable distance, and then combines it with the generalized range test for detection. The research uses time series generative adversarial networks to enhance load data and sparse self attention to reduce the complexity of Transformer models. Experiments indicate that the maximum anomaly detection accuracy of the fusion algorithm is 0.981, which is 0.081 higher than the second best local anomaly factor. The detection accuracy and detection time are 0.982 and 13.02 ms, respectively. The prediction accuracy, precision, root mean square error, and mean absolute error of the improved Transformer model are 0.972, 0.975, 0.305, and 0.152, respectively. Predicting the power load curve results in a greater level of alignment with actual power load data. From this, it can be inferred that the proposed approach has the capacity to substantially enhance the accuracy of anomaly detection and interval prediction of power loads, ensuring the reliable operation of the power system.
Keywords: Smart grid, power load data, anomaly detection, interval prediction, transformer.
1 Introduction
With the success of the Second Industrial Revolution, electricity has made significant technological breakthroughs and is extensively utilized across numerous domains [1]. Electricity is the foundation of modern economic activities. By February 2025, the total electricity consumption across society reached 743.4 billion kilowatt-hours, reflecting an 8.6% increase from the same period in the previous year [2]. Additionally, it is also the lifeline of industrial production, capable of realizing industrial process mechanization, improving production efficiency and productivity [3]. It also provides necessary energy for daily life, including residential life, commercial activities, and tourism, all of which are highly dependent on electricity [4]. With the continuous development of society, the demand for electricity is also increasing. Power interruptions caused by overload conditions frequently result in significant financial losses [5]. Therefore, it is important to detect the load data of the power system (PS) and predict future power loads. Anomaly detection and interval prediction can promptly address system issues and effectively reduce losses [6].
The existing methods cannot balance the timeliness and accuracy of power load detection. To improve the detection capability of abnormal data in the PS, Takidin A et al. proposed a novel detection approach. This method used Long Short-Term Memory (LSTM) sequences to perform deep auto-encoder on the sequence structure, which can effectively capture the complex patterns of data and utilize the time series characteristics of data. Experiments showed that the detection performance of sequences on sequence structures was better than that using fully connected structures, with detection rates and false alarm rates increased by 4–21% and 4–13%, respectively [7]. Khan I U et al. proposed a novel power theft identification framework to tackle the challenge of existing electricity theft detection systems being unable to handle large amounts of data. The framework processed abnormal power consumption data in the first module, used a combined class equilibration method to handle severely skewed data distributions in the second module, and utilized an enhanced ANN-based categorization engine for detection in the third module. Experiments showed that this framework was capable of handling more complex tasks and had higher advantages compared to existing deep learning (DL) methods [8]. Mestav K R et al. proposed a novel DL method for anomaly detection of load data in PSs. This method used high-definition continuous wave points or vector measurements to detect data and system anomalies. Assuming that the data had unidentified temporal relationships and probability patterns, a generative adversarial network was employed to transform the anomaly free observation data into a uniform, independent, and identically distributed sequence. The experiments revealed that this approach achieved a high level of detection precision in different datasets [9]. Baker et al. proposed a new model predictive control and LSTM network fusion detection method for instantaneous detection and classification of anomalies in the power grid (PG). The LSTM network of this method utilized the same time-series input data as the model predictive control, and had the characteristics of internal fault detection and corrective measures in the PG, thereby ensuring the elastic operation of the PG. Experiments showed that this approach could effectively improve the precision of detecting PG anomalies [10].
Yong et al. proposed a new interval prediction framework for power load uncertainty in the PG system. This framework considered a differentiable trust domain layer in reinforcement learning for temporally dynamic scenarios with intermittent new energy generation and different loads, improving the sturdiness of the policy update process and quantifying prediction errors through interval prediction. Experiments showed that this framework could effectively improve the precision of power load forecasting (PLF) [11]. Dong X et al. proposed a new short period support vector machine (SVM) PLF method to examine how temperature and holidays affect seasonal loads. The approach employed K-means clustering (KMC) to categorize seasonal load data into two groups, utilizing temperature features as input. Additionally, it leveraged calendar-based regulations to ascertain the effect of holidays on seasonal load. The experiment showed that the prediction accuracy of this method increased by 39.75% compared to traditional methods, and the running time increased by 128.89% compared to traditional methods [12]. Veeramsetty V et al. proposed a new machine learning model to improve the maintenance efficiency and reliability of the PG. This model used a random forest to decrease the dimensionality of the model’s input, reduced the input size of the gated loop unit, and achieved a lightweight model. Then, the gated loop unit was used for PLF. Experiments showed that this model could effectively achieve short period PLF and improve the precision [13]. Zeng W et al. proposed a new ultra short period PLF approach based on similar day clustering and ensemble empirical mode decomposition to address the issue of low accuracy in PS load forecasting. This method utilized the KMC algorithm to partition historical data, decomposing the load data of each cluster into sub-sequences of various time scales. The load forecasting model used long and short period time series networks as sub sequences. Experiments showed that this method had higher prediction accuracy [14].
In summary, existing research methods have explored issues such as anomaly detection of PS load data and prediction of power load intervals from multiple perspectives, and have achieved certain results. However, existing methods cannot balance detection timeliness and accuracy. Therefore, the study proposed an anomaly detection algorithm that integrates Generalized Extreme Student Deviate Test (GESD) and Local Outlier Factor (LOF), as well as an interval prediction model that improves the Transformer model. The study innovatively uses sliding windows to improve the generalized range test, optimizes local anomaly factors using reachable distance, and then integrates it with the generalized range test for detection. The study employs Time Series Generative Adversarial Network (TimeGAN) to enhance load data, and then employs sparse self attention to reduce the complexity of Transformer models. This study aims to improve the accuracy of anomaly detection and interval prediction for power load, thereby enhancing the operational stability of the PS.
2 Methods and Materials
2.1 Integration of GESD and LOF for Power Load Anomaly Detection
Various abnormal situations may occur throughout the functioning of the PS, such as equipment failures, overloads, and low voltages, which can lead to abnormal power load data [15]. Conducting abnormal power load detection can guarantee the secure and dependable functioning of the PS, improve power supply reliability, optimize system operation, and enhance user service quality [16]. Current research typically uses the GESD method for anomaly detection, which can detect multiple anomalies simultaneously, but requires the dataset to adhere to a normal probability distribution. However, the load data of the PS is influenced by a range of elements including time, weather, and equipment, resulting in the data not being completely normally distributed [17]. Therefore, this study proposes a method for detecting abnormal power loads that combines improved GESD and improved LOF, which can detect data with different trends. The improved method first selects an initial segment from the load time series data, uses sliding window technology to divide it into multiple sub-sequences, and then calculates the rate of change characteristics and residual characteristics based on linear regression for each window. The calculation of the rate of change is presented in Equation (1).
| (1) |
In Equation (1), represents the rate of change of TSD, represents the th sliding window, represents the th sliding window, represents the duration of the th sliding window, represents the duration of the th sliding window, and forms a trend vector of change rates for multiple TSD. By using linear regression predictions of TSD in different sliding windows, residual values within each window are obtained and combined into corresponding residual vectors. The specific structure of improving the GESD approach is presented in Figure 1.
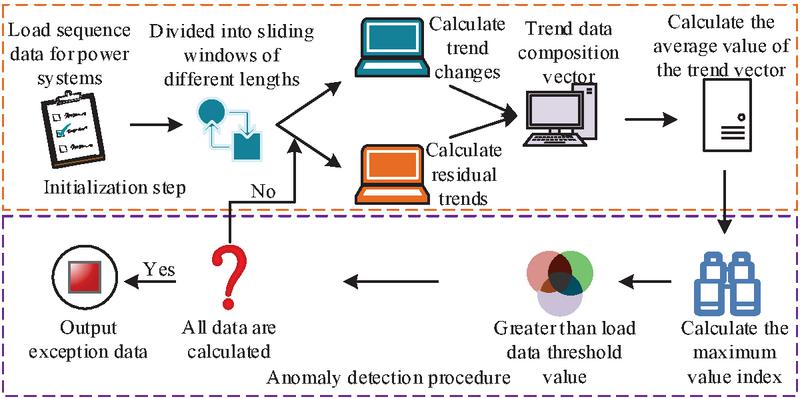
Figure 1 Specific structure of the improved GESD method.
In Figure 1, the load TSD of the PS is first obtained, and the TSD is divided into sliding windows of different lengths. The change trend and residual trend of the data in the windows are calculated, and the trend data are combined into a vector. Then, the average of the change rate trend vector and residual trend vector is calculated. After initialization is completed, the process calculates the maximum value index of the change rate trend vector. If the index value is larger than the critical value of the load data, the data are considered abnormal. This process is repeated until all temporal data calculations are completed. Using the same calculation method in the residual trend vector, anomalous data are identified. In normal circumstances, the load data of the same user in different data collection cycles has a relatively small change amplitude, so it is possible to compare the data at the same time point in different cycles. If there is a significant change, it can be determined as abnormal data. The LOF method is an anomaly detection method that uses LOFs, but it cannot recognize domain data, resulting in lower detection accuracy. The study redefines the reachable distance of different data points. When two data points belong to the same category, their reachable distance is calculated as presented in Equation (2).
| (2) |
In Equation (2), represents the reachable range between the data point and the data point , represents the range from the data point to its nearest neighbor , and represents the actual range between the data point and the data point . When two data are of different categories, their reachable distance is calculated as presented in Equation (3).
| (3) |
In Equation (3), represents the reachable range when the data category is different, and represents the range from the data point to the center of the nearest neighbor . The calculation of local reachable density is derived from the reachable range of the dataset, and finally the improved local anomaly factor is calculated. The smaller the local anomaly factor in the improved LOF method, the lower the probability of the data being abnormal. When the local anomaly factor of the data is greater than 1, the higher the probability of the data being abnormal. The specific process of the power load anomaly detection method integrating GESD and LOF is presented in Figure 2.
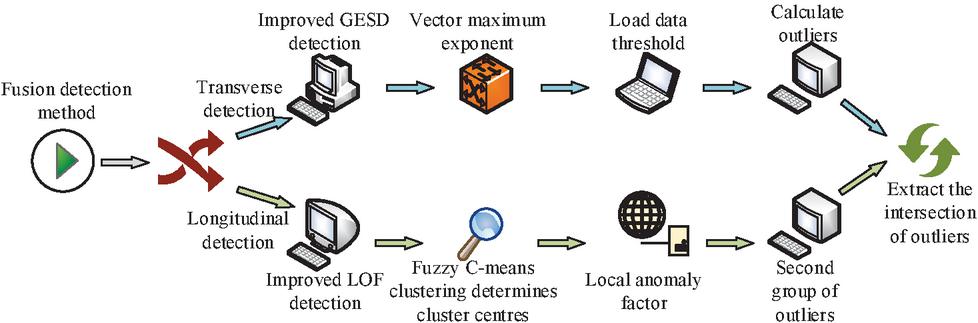
Figure 2 Power load anomaly detection method based on GESD and LOF.
In Figure 2, the improved GESD method is used for horizontal detection of abnormal data, and the corresponding change rate trend vector and residual trend vector are calculated. The maximum value index of the two vectors is compared with the critical value of the load data to obtain the first group of abnormal values in the TSD. By employing an enhanced LOF method for vertical anomaly detection, utilizing the fuzzy C-means clustering algorithm to identify clustering centers in TSD, and calculating local anomaly factors through an improved reachable distance metric, the second set of outliers is determined. The final load anomaly data for the PS is obtained by comparing the two outlier sets and extracting their intersection.
2.2 Short Period Power Load Interval Prediction Based on Transformer
In the PS, in addition to detecting abnormal load data, DL can also be used for PLF, further improving the dependability of the PS and providing high-quality services to users [18]. Therefore, this study proposes a short-term electricity load interval prediction method based on an improved Transformer architecture. First, historical load data and an improved Transformer model are used to perform short-term electricity load interval predictions. The specific structure of the improved Transformer PLF model is presented in Figure 3.
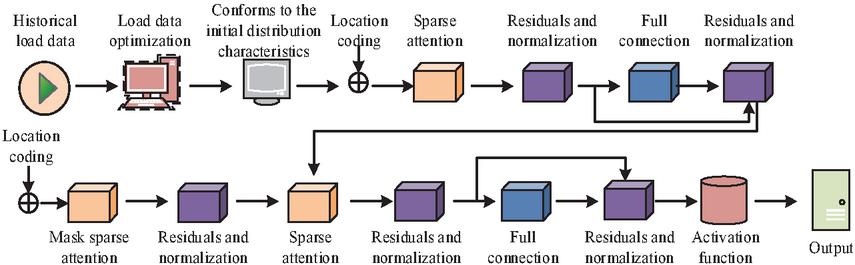
Figure 3 Improved PLF model of transformer.
In Figure 3, the study uses TimeGAN for power load data optimization, which can generate synthetic TSD with high fidelity and preserve the time-dependent structure of the original data. When the optimized data conforms to the initial distribution characteristics, it is input into the Transformer model. The model encodes the input data using positional encoding and uses sparse attention mechanism (AM) to calculate only some important attention weights, thereby reducing the complexity of the model. The sparse AM only calculates a few important elements in the sequence, thereby significantly reducing computational and memory overhead and improving computational efficiency. After multiple rounds of residual and normalization, as well as fully connected layers (FCLs), it outputs the interval prediction results of power load data. TSD has two different features, namely static features that do not change over time, and dynamic features that constantly change over time. TimeGAN generates new data distributions that are infinitely close to the true distribution by learning the distribution of real data. The specific operation process is presented in Figure 4.
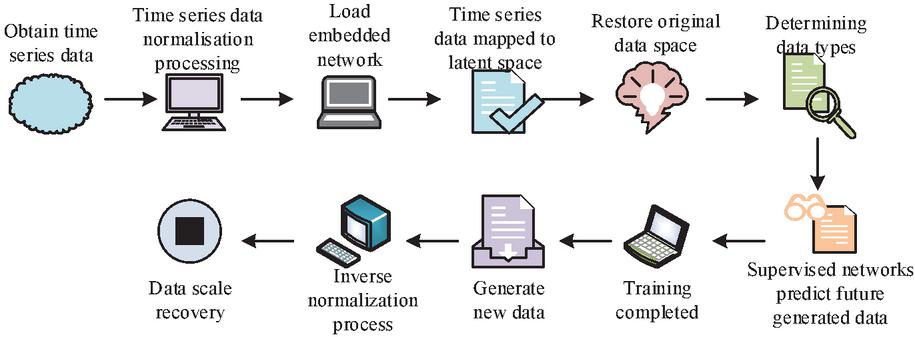
Figure 4 TimeGAN specific operation flow.
In Figure 4, the obtained TSD is first normalized, and an embedding network is employed to map the original TSD to the latent space, generating new TSD through a generator. The operation restores the data generated by the generator to the original data space in the recovery network, uses a discriminator to determine whether the input data are real data or generated data, and uses a supervised network to forecast the future value of the generated data. After the training of the generator and discriminator is completed, the generator is used to generate new TSD, and the generated data are subjected to inverse normalization to restore the scale of the original data. The computation of the embedded network is presented in Equation (4) [19].
| (4) |
In Equation (4), represents latent space, represents embedded network, and represents initial temporal data. The reconstruction loss function of TimeGAN is calculated as presented in Equation (5).
| (5) |
In Equation (5), is the reconstruction loss and is the recovery network. The loss function of the generator is calculated as presented in Equation (6).
| (6) |
In Equation (6), represents the loss of the generator, represents the discriminator, represents the output of the generator, represents the random noise vector, and represents the probability distribution of the random noise vector. The loss function calculation of the discriminator is presented in Equation (7) [20].
| (7) |
In Equation (7), is the loss of the discriminator and is the probability distribution of the true data distribution. The Transformer structure of the PLF model is presented in Figure 5.
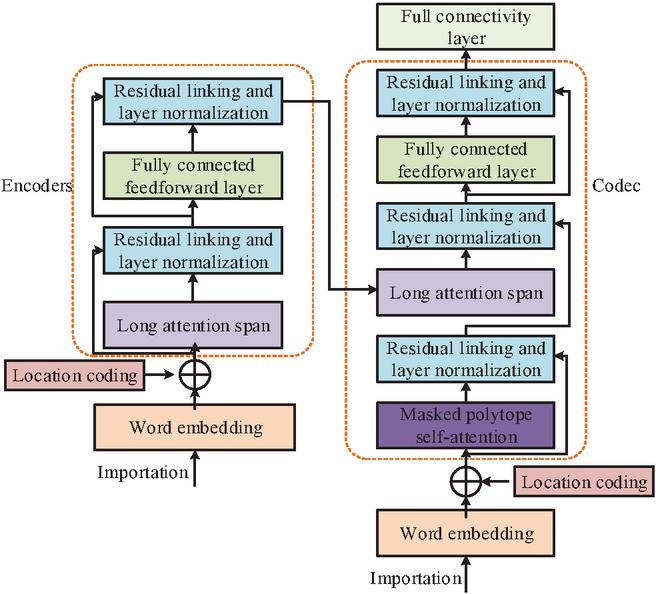
Figure 5 Transformer structure of PLF model.
In Figure 5, Transformer primarily comprises two parts: encoding module and decoding module. The encoder module includes multi-head self attention layer (MSAL), FCL, and residual connection (RC), and layer normalization (LA) [21–23]. The decoder module includes a masked MSAL, a MSAL, an FCL, and RCs and LA. The position encoding calculation of the input data is presented in Equation (8).
| (8) |
In Equation (8), is position encoding, is word position, is dimension index, and is model dimension. The calculation of the multi-head attention (MHA) function is presented in Equation (9).
| (9) |
In Equation (9), represents the MHA function, and is the activation function. , , and denotes the query, key, and value matrices. is the dimension of the key, and is the sequence length. The MHA mechanism is composed of multiple single head attention combinations, where the attention calculation of each head is presented in Equation (10).
| (10) |
In Equation (10), represents the attention of each head, represents the query weight matrix (WM) of the th head, represents the key WM of the th head, and represents the value WM of the th head. The nonlinear transformation calculation after word embedding is presented in Equation (11).
| (11) |
In Equation (11), is the nonlinear transformation after word embedding, is the input word, and both represent the WM, and both are bias terms. To address the complex issues of Transformer models, sparse AM is adopted instead of the AM in the network to lower its time complexity. In the self AM, the th dimensional matrix of the query vector needs to be matched sequentially with all dimensional matrices of the key vector, which greatly increases the computational complexity. The normalized weight calculation is presented in Equation (12).
| (12) |
In Equation (12), represents the probability of selecting key when determining query vector , represents the similarity score between query and key , represents the sum of similarity scores between query and all keys, represents the joint probability between query and key , and represents the marginal probability. The study uses Kullback-Leibler divergence to gauge the disparity between two probability distributions, calculated as presented in Equation (13).
| (13) |
In Equation (13), represents the KL divergence between probabilities and , is the total number of keys, and is the vector dimension. The dependence between random variables is evaluated using mutual information, as calculated in Equation (14).
| (14) |
In Equation (14), represents the mutual information between query vector and all keys. When the th query vector can obtain greater mutual information, it belongs to the most frequently clicked candidate content. Therefore, the improved Transformer model only needs to select multiple high-frequency query vectors and key vectors for dot product calculation, as presented in Equation (15).
| (15) |
In Equation (15), represents the improved sparse attention output and represents the sparse attention matrix. The dot product of frequently occurring query vectors and key vectors is normalized using constraint factors, where the number is equal to the natural logarithm of the constraint factor multiplied by the total number of query vectors.
3 Results
3.1 Experimental Analysis of Power Load Detection
The study obtained PS load data from a city level power company from June 2022 to August 2022, with a sampling period of 60 days, recording the electricity consumption of more than 6000 households and over 200 small and medium-sized production enterprises. The data collection interval for each user was 30 minutes, with a total of 48 data collected per day. All data was arbitrarily partitioned into training and testing sets in an 8:2 ratio. The experimental running hardware environment was Intel Core i5-12600 @ 1.80 GHz, GPU was NVIDIA GeForce RTX 3080, memory was 16GB, and operating system was Windows 11. The experiment used ordinary LOF algorithm, Histogram-based Outlier Score (HBOS), AutoEncoder, and Angle-based Outlier Detection (ABOD) for comparative analysis. When the probability of abnormal power data was different, the accuracy comparison of abnormal detection of power load data using various approaches is presented in Figure 6.
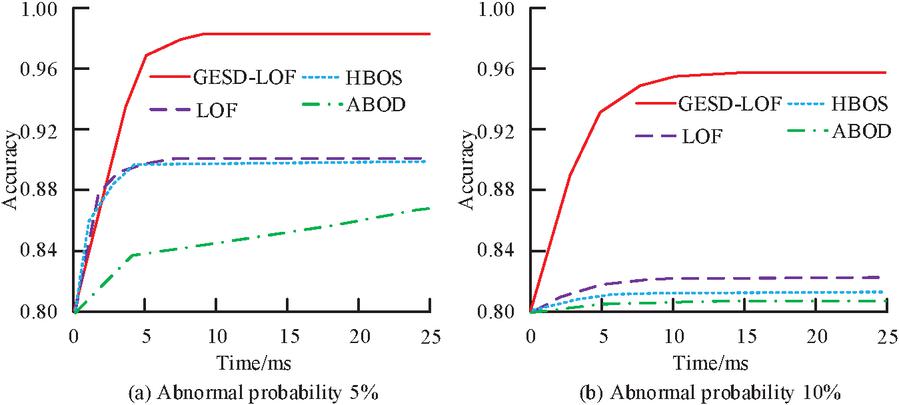
Figure 6 Comparison of anomaly detection accuracy of power load data by various approaches.
In Figure 6(a), when the data anomaly probability was 5%, the maximum anomaly detection accuracy of the GESD-LOF algorithm was 0.981, and the convergence speed was the fastest between 0–5 ms, gradually approaching convergence in the 5–10 ms interval. The maximum detection accuracy of GESD-LOF algorithm was 0.081, 0.083, and 0.125 higher than LOF, HBOS, and ABOD, respectively. ABOD algorithm did not reach the convergence value within the limited running time. In Figure 6(b), when the probability of data anomaly was 10%, the detection accuracy of each algorithm decreased. The detection accuracy of GESD-LOF algorithm decreased by 0.015, which was 0.142, 0.146, and 0.148 higher than the other three algorithms. When the probability of abnormal power data varied, the performance comparison of various approaches for anomaly detection is presented in Table 1.
Table 1 Comparison of anomaly detection performance of various approaches
| Detection | Abnormal Probability 5% | Abnormal Probability 10% | ||||||
| Method | Precision | Recall | AUC | Time/ms | Precision | Recall | AUC | Time/ms |
| GESD-LOF | 0.982 | 0.987 | 0.902 | 13.02 | 0.976 | 0.981 | 0.894 | 13.14 |
| LOF | 0.945 | 0.952 | 0.531 | 8.94 | 0.872 | 0.904 | 0.513 | 9.27 |
| HBOS | 0.942 | 0.948 | 0.480 | 4.39 | 0.892 | 0.894 | 0.483 | 5.32 |
| AutoEncoder | 0.937 | 0.942 | 0.493 | 14538.21 | 0.876 | 0.893 | 0.485 | 14623.15 |
| ABOD | 0.935 | 0.928 | 0.490 | 175.42 | 0.875 | 0.863 | 0.472 | 184.25 |
In Table 1, when the probability of data anomalies was 5%, the GESD-LOF algorithm had the best anomaly detection capability, with a detection precision of 0.982, which was 0.037, 0.040, 0.045, and 0.047 higher than LOF, HBOS, AutoEncoder, and ABOD, respectively. The running time for each detection was only 13.02 ms, and the recall rate and AUC value of the GESD-LOF algorithm were 0.987 and 0.902, respectively. When the probability of data anomalies was 10%, the detection performance of all algorithms decreased. The detection precision of GESD-LOF algorithm was 0.981, which was 0.077, 0.087, 0.088, and 0.118 higher than LOF, HBOS, AutoEncoder, and ABOD, respectively, with the smallest decrease in detection accuracy. Meanwhile, the detection time of the GESD-LOF algorithm only increased by 0.12 ms. The visualization results of the GESD-LOF algorithm for detecting abnormal power load data are shown in Figure 7.
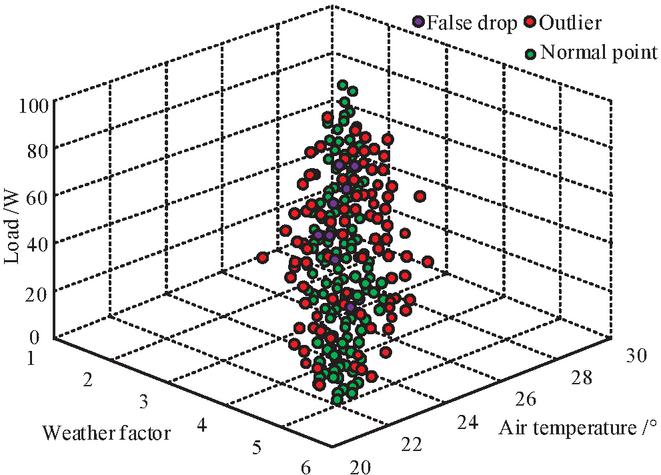
Figure 7 Visual results of power load abnormal data detection by GESD-LOF algorithm.
In Figure 7, green represents normal load data and red represents abnormal load data. From the graph, most of the green data was concentrated in a certain area, while a small portion of the abnormal data was in the same area as the green data, and most of it was scattered on both sides. When the temperature was high, the PS was prone to abnormal data, which was due to the increase in temperature and system load, resulting in an increased probability of electrical equipment failure. There were a total of 8 data points with false positives in the graph, with a false positive probability of 1.62%.
3.2 Experimental Analysis of Short Period Interval PLF
The hardware parameters of the experiment were the same as in Section 2.1, with a TimeGAN time step of 24 and a learning rate of 0.0005. The study used Transformer, Autoregressive Moving Average (ARMA), Autoregressive Integrated Moving Average (ARIMA), SVM, and LSTM networks for comparative analysis. The experiment used Principal Component Analysis (PCA) and t-distributed Stochastic Neighbor Embedding (t-SNE) to perform data augmentation visualization evaluation of TimeGAN. The evaluation results are shown in Figure 8.
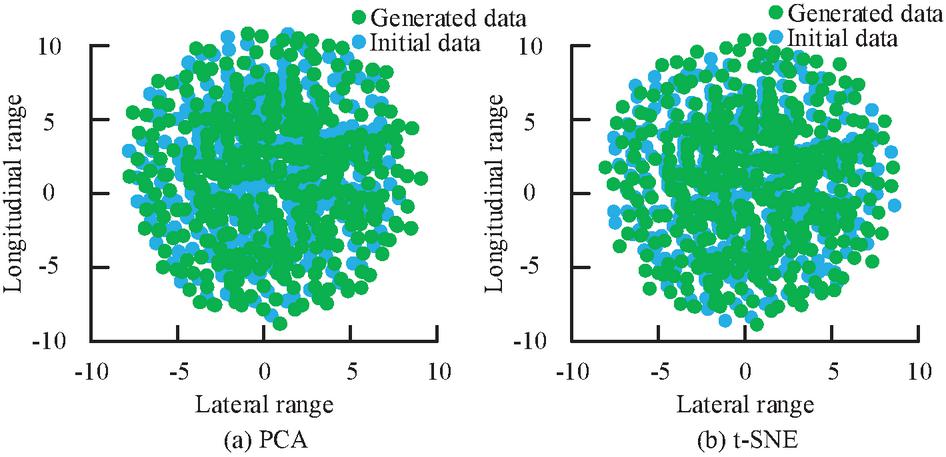
Figure 8 Data enhancement visual evaluation results of TimeGAN.
In Figure 8(a), after enhancing the power load data using TimeGAN, blue represents the initial data and green represents the generated power load data. The green dots were closer to the blue dots and had similar distribution characteristics, indicating a strong resemblance between the generated and the initial data. In Figure 8(b), the visualization image generated using the t-SNE method also showed a high degree of overlap between the generated and the initial data, indicating that TimeGAN could effectively enhance the initial power load data without changing its distribution characteristics. The performance comparison of power load interval prediction using various approaches is presented in Table 2.
Table 2 Comparison of interval PLF performance of various approaches
| Forecasting Method | Accuracy | Precision | RMSE | MAE | Time/ms |
| Improved Transformer | 0.972 | 0.975 | 0.305 | 0.152 | 21.4 |
| Transformer | 0.924 | 0.936 | 0.553 | 0.271 | 18.5 |
| ARMA | 0.903 | 0.914 | 0.625 | 0.548 | 37.2 |
| ARIMA | 0.937 | 0.940 | 0.504 | 0.502 | 95.8 |
| SVM | 0.894 | 0.903 | 0.612 | 0.693 | 32.6 |
| LSTM | 0.912 | 0.922 | 0.572 | 0.652 | 145.9 |
In Table 2, the improved Transformer model achieved the best predictive performance, with prediction accuracy, precision, root mean square error (RMSE), and mean absolute error (MAE) of 0.972, 0.975, 0.305, and 0.152, all of which were superior to other approaches. The running time of the improved Transformer model was 21.4ms, which is 2.9 ms, 15.8 ms, 74.4 ms, 11.2 ms, and 124.5 ms lower than Transformer, ARMA, ARIMA, SVM, and LSTM, respectively. The comparison of fitting curves for PLF using various approaches is presented in Figure 9.
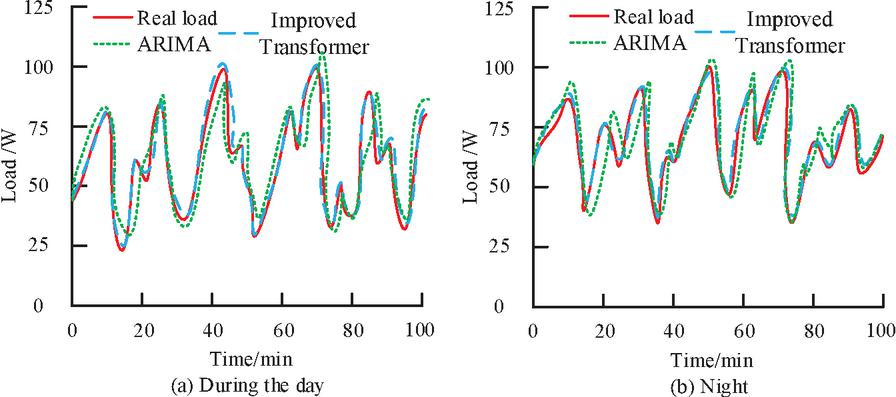
Figure 9 Comparison of PLF fitting curves of various approaches.
In Figure 9(a), the improved Transformer model’s predicted power load curve had a greater level of alignment with actual power load data, and its trend was basically consistent with the real data curve. At various load inflection points, the load could be predicted in advance, but the fitting degree between ARIMA’s predicted curve and real data was low, making it difficult to respond to load changes in a timely manner. In Figure 9(b), when the power load increased, the improved Transformer model could adjust in a timely manner, and the ARIMA prediction curve had a certain delay. Ablation experiments were carried out on the improved Transformer model in the study, with the outcomes of these experiments presented in Figure 10.
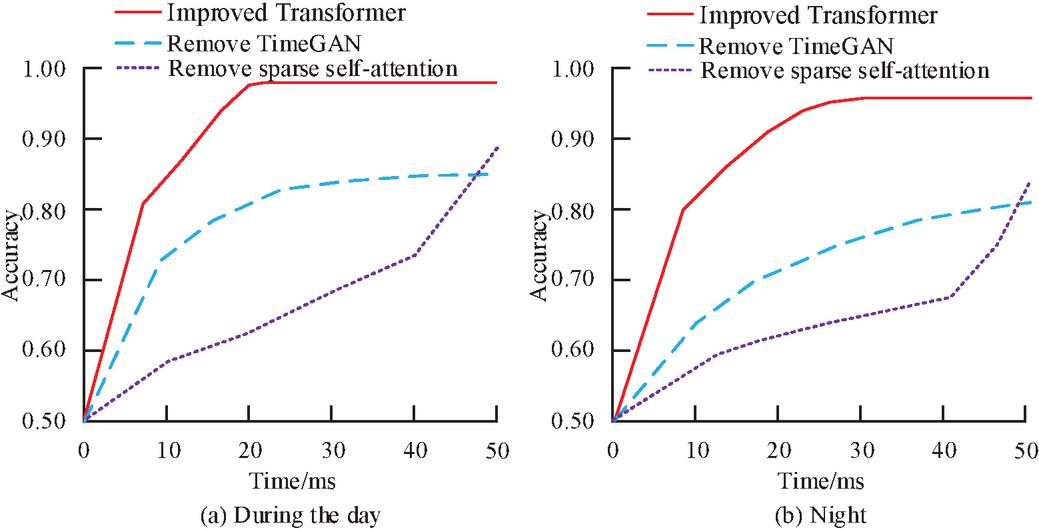
Figure 10 Ablation experiment results of the improved Transformer model.
In Figure 10(a), the improved Transformer model tended to converge after running for 20 ms, with a maximum prediction accuracy of 0.971, which was 0.135 and 0.082 higher than removing TimeGAN and sparse self attention modules, respectively. In Figure 10(b), when the power load data was nighttime data, the prediction accuracy of all methods decreased due to the increase in data complexity. The maximum prediction accuracy of the improved Transformer model decreased to 0.958. The TimeGAN module greatly affected the prediction accuracy of the Transformer model, while the sparse self attention module greatly affected the computational speed of the model.
4 Conclusion
A power load anomaly detection and prediction method based on GESD-LOF fusion algorithm and improved Transformer model was proposed to tackle the challenge of insufficient accuracy and timeliness in existing power load anomaly detection and prediction. The experiment showed that when the probability of data anomaly was 5%, the maximum accuracy of anomaly detection of GESD-LOF algorithm was 0.981, and the convergence speed was the fastest between 0–5 ms, gradually approaching convergence in the 5–10 ms interval. The maximum detection accuracy of GESD-LOF algorithm was 0.081, 0.083, and 0.125 higher than LOF, HBOS, and ABOD, respectively. When the probability of data anomalies was 10%, the detection accuracy of each algorithm decreased. The GESD-LOF algorithm had the best anomaly detection capability, with a detection accuracy of 0.982 and a detection time of 13.02 ms. As the temperature rose and the system load increased, abnormal data was prone to occur, with a false detection probability of 1.62%. The data enhanced by the TimeGAN method was closer to the initial data and had similar distribution characteristics. Improved Transformer model, with prediction accuracy, precision, RMSE, and MAE of 0.972, 0.975, 0.305, and 0.152, respectively, which were better than other methods. The running time was 21.4 ms, which was 2.9 ms, 15.8 ms, 74.4 ms, 11.2 ms, and 124.5 ms lower than Transformer, ARMA, ARIMA, SVM, and LSTM, respectively. The improved Transformer model’s predicted power load curve had a greater level of alignment with actual power load data, and its trend was basically consistent with the real data curve. In the ablation experiment, the TimeGAN module greatly affected the prediction accuracy of the model, while the sparse self-attention module greatly affected the computational speed of the model. There were still some issues with this study, such as insufficient consideration of the impact of weather, season, and holidays on power load. In the future, multi-feature power load TSD may be incorporated to enhance the generalizability of the prediction model.
Fundings
The research is supported by: Key Scientific Research Project of Higher Education Institutions in Henan Province: Research on Key Energy Management Technologies of Integrated Photovoltaic, Storage and Charging System under the Dual Carbon Goals (No. 24B470002); Henan Provincial Science and Technology Research and Development Program:Research on Key Technologies of Multi-time Scale Coordinated Optimization Scheduling of Source-grid-load-storage Based on DTW Algorithm (No. 252102241020).
References
[1] Wang X, Wang H, Bhandari B, Cheng L. AI-empowered methods for smart energy consumption: A review of load forecasting, anomaly detection and demand response. International Journal of Precision Engineering and Manufacturing-Green Technology. 2024, 11(3): 963–993.
[2] Lee S, Nengroo SH, Xi H, Doh Y, Lee C, Heo T, Har D. Anomaly detection of smart metering system for power management with battery storage system/electric vehicle. ETRI Journal. 2023, 45(4):650–665.
[3] Yang Q, Gultekin MA, Seferian V, Pattipati K, Bazzi AM, Palmieri FA, Ukegawa H. Incipient residual-based anomaly detection in power electronic devices. IEEE Transactions on Power Electronics. 2022, 37(6):7315–7332.
[4] Yu J, Cheng H, Zhang J, Li Q, Wu S, Zhong W, Ma P. CONGO: Scalable Online Anomaly Detection and Localization in Power Electronics Networks. IEEE Internet of Things Journal. 2022, 9(15):13862–13875.
[5] Mahi-al-Rashid A, Hossain F, Anwar A, Azam S. False data injection attack detection in smart grid using energy consumption forecasting. Energies. 2022, 15(13):4877-4892.
[6] Takiddin A, Ismail M, Serpedin E. Robust data-driven detection of electricity theft adversarial evasion attacks in smart grids. IEEE Transactions on Smart Grid. 2022, 14(1):663–676.
[7] Takiddin A, Ismail M, Zafar U, Serpedin E. Deep autoencoder-based anomaly detection of electricity theft cyberattacks in smart grids. IEEE Systems Journal. 2022, 16(3):4106–4117.
[8] Khan IU, Javaid N, Taylor CJ, Ma X. Robust data driven analysis for electricity theft attack-resilient power grid. IEEE Transactions on Power Systems. 2022, 38(1):537–548.
[9] Mestav KR, Wang X, Tong L. A deep learning approach to anomaly sequence detection for high-resolution monitoring of power systems. IEEE Transactions on Power Systems. 2022, 38(1):4–13.
[10] Baker M, Fard AY, Althuwaini H, Shadmand MB. Real-time AI-based anomaly detection and classification in power electronics dominated grids. IEEE Journal of Emerging and Selected Topics in Industrial Electronics. 2022, 4(2):549–559.
[11] Yong L, Tang Y, Mao S, Liu H, Meng K, Dong Z, Qian F. A two-level energy management strategy for multi-microgrid systems with interval prediction and reinforcement learning. IEEE Transactions on Circuits and Systems I: Regular Papers. 2022, 69(4):1788–1799.
[12] Dong X, Deng S, Wang D. A short-term power load forecasting method based on k-means and SVM. Journal of Ambient Intelligence and Humanized Computing. 2022, 13(11):5253–5267.
[13] Veeramsetty V, Reddy KR, Santhosh M, Mohnot A, Singal G. Short-term electric power load forecasting using random forest and gated recurrent unit. Electrical Engineering. 2022, 104(1):307–329.
[14] Zeng W, Li J, Sun C, Cao L, Tang X, Shu S, Zheng J. Ultra short-term power load forecasting based on similar day clustering and ensemble empirical mode decomposition. Energies. 2023, 16(4):1989–2011.
[15] Habbak H, Mahmoud M, Metwally K, Fouda MM, Ibrahem MI. Load forecasting techniques and their applications in smart grids. Energies. 2023, 16(3):1480–1495.
[16] Liao W, Wang S, Bak-Jensen B, Pillai JR, Yang Z, Liu K. Ultra-short-term interval prediction of wind power based on graph neural network and improved bootstrap technique. Journal of Modern Power Systems and Clean Energy. 2023, 11(4):1100–1114.
[17] Choudhuri S, Adeniye S, Sen A. Distribution Alignment Using Complement Entropy Objective and Adaptive Consensus-Based Label Refinement For Partial Domain Adaptation. Artificial Intelligence and Applications. 2023, 1(1): 43–51.
[18] Herrera-Casanova R, Conde A, Santos-Pé rez C. Hour-Ahead Photovoltaic Power Prediction Combining BiLSTM and Bayesian Optimization Algorithm, with Bootstrap Resampling for Interval Predictions. Sensors. 2024, 24(3):882–107.
[19] Geng G, He Y, Zhang J, Qin T, Yang B. Short-term power load forecasting based on PSO-optimized VMD-TCN-attention mechanism. Energies. 2023, 16(12):4616–4631.
[20] Veeramsetty V, Chandra DR, Grimaccia F, Mussetta M. Short term electric power load forecasting using principal component analysis and recurrent neural networks. Forecasting. 2022, 4(1):149–164.
[21] Minghui Gao, Zhijun Zhang, Liangliang Cui, Sibo Feng, Jingyi Liu, Yongzhen Jiang, Temporal and Topological Enhanced Graph Neural Networks for Traffic Anomaly Detection. Journal of Cyber Security and Mobility, 2025, 14 (2), 457–474.
[22] Lei Zhang, Implementing RGCN Model in Network Security Big Data Analysis, Journal of Cyber Security and Mobility, 2025, 14 (2), 505–530.
[23] Qiang Wu, Network Security Maintenance and Detection Based on Diversified Features and Knowledge Graph, Journal of Cyber Security and Mobility, 2025, 14 (2), 339–364.
Biographies

Jingkun Yao, born on December 1988, male, from Xinxiang, Henan Province, Han ethnicity. He obtained his Bachelor’s degree in Electrical Engineering and Automation from Nanyang Institute of Technology in June 2013 and his Master’s degree in Electrical Engineering from Liaoning University of Technology in April 2016. His research interests include power system optimization and new energy grid connection scheduling. Work experience: From August 2016 to present, worked as a teaching and research secretary at the School of Electrical Engineering & Automation, Henan Institute of Technology. Published 8 academic papers, including 1 SCI paper, 1 EI paper, 1 core paper, 2 authorized invention patents, and 2 utility model patents.

Jie Yang, born in May 1976, female, from Xinxiang, Henan Province, Han ethnicity. She obtained a bachelor’s degree in Power System and Automation from Zhengzhou University of Technology in July 1998, a master’s degree in Electronic and Communication Engineering from Xi’an Jiaotong University in 2003, and a doctoral degree in Electrical Engineering from Dongxi University in South Korea in 2016. Her research focuses on power system optimization scheduling, microcomputer protection, and power system load forecasting Work experience: July 1998 present, Director of the Research Department at Henan Institute of Technology. Published over 40 academic papers, including 11 EI indexed papers and 22 core Chinese papers. Led and completed 18 provincial-level scientific research project achievement appraisals, won 1 second prize for provincial scientific and technological progress, and 3 second prizes for scientific research achievements from the Education Department; Lead one provincial-level engineering research center; Authorized 5 invention patents, 3 utility models, and 3 software copyrights.

Yonghao Wang, born on December 12, 1997, male, from Xinxiang, Henan Province, Han ethnicity. He obtained his Bachelor’s degree in Electrical Engineering and Automation from Zhengzhou University of Aeronautical Industry Management in July 2019 and his Master’s degree in Electrical Engineering from Shenyang University of Technology in June 2022. His research interests include cable fault monitoring and fault location. Work experience: From August 1, 2023 to present, I have been a full-time teacher at the School of Electrical Engineering and Automation, Henan University of Technology. Published 2 academic papers, 1 EI paper, 1 core paper, and 1 authorized invention patent.
Journal of Cyber Security and Mobility, Vol. 14_5, 1067–1088.
doi: 10.13052/jcsm2245-1439.1452
© 2025 River Publishers