Multi-source Data Fusion for Real-time Cybersecurity Situational Awareness and Visualization
Xiangyang Li1,*, Jianhua Zhang2
1College of Information Engineering, Tarim University, Alaer, Xinjiang 843300, China
2Network & Information Center, Tarim University, Alaer, Xinjiang 843300, China
E-mail: xyanglixy@outlook.com
*Corresponding Author
Received 11 July 2025; Accepted 16 August 2025
Abstract
Building situational awareness systems that can collect and evaluate data from several sources in real time is crucial as cyber threats become more complex. Sensor fusion, probabilistic reasoning, graph theory, and information theory are all brought together in the innovative mathematical model known as Multi-Source Fusion-Based Cybersecurity Situational Awareness (MF-CSSA). This model is designed to give a complete framework for the visualization and awareness of real-time cybersecurity scenarios. Scalability, accuracy, reaction time, false positive rate, and situational awareness score are the five key performance indicators (KPIs) that we used in order to simulate and assess the proposed model’s architecture. Scalability is the level of scalability that the architecture has. A hundred iterations of the simulation were carried out, and the results indicate that MF-CSSA regularly outperforms the baseline techniques. By combining data and using probabilistic reasoning, the model is able to predict hostile activities in a consistent manner, as shown by the fact that it has an average accuracy of 88% when detecting threats. Having the ability to function in real time is very important, as shown by the fact that its average reaction time is 2.1 seconds. By doing so, it stops attacks from happening before they ever happen. By achieving an average score of 0.82 on the situational awareness scale, the model demonstrates that it is capable of recognizing and contextualizing cybersecurity scenarios. Another way of putting it is that it is able to swiftly adjust to new dangers. The model has a low false positive rate of just 8%, which is in addition to considerably decreasing the amount of work that analysts have to put in and alert fatigue. Last but not least, MF-CSSA is able to develop and handle a significant amount of traffic since it can process around 110 events per second. Because of this, it is a good option for huge networks that experience significant levels of information flow. It is clear from these data that the MF-CSSA architecture is a way of real-time cyber threat defense that is not only intelligent but also practical and provides accurate results.
Keywords: Multi-source data fusion, cybersecurity situational awareness, real-time visualization, threat detection, Bayesian inference, adaptive learning.
1 Introduction
An energy-aware hybrid MAC multipoint relay protocol is presented for wireless sensor network system information exchange. It consumes less power than on-demand DMDS, according to simulations. Its transmission latency is less than the typical system data sharing protocol [1]. New data fusion problems arise for surveillance and spatial perception systems that record panoramic pictures. Data capture and computer operation enable multisensor array image fusion. This study examines source data aggregation, health monitoring, and data rate processing system architecture, delay, and control loop [2]. Two multicockpit sensor prototypes were constructed by NRL. Testing shows that the volume sensor prototype outperforms commercial video and point detection systems in fire detection quality indicators [3]. UAV fleet-based specialized surveillance services are investigated and demonstrated. It supports danger detection via data fusion, improves operator situational awareness, and reduces effort. To improve UAV detection, high-level data fusion, and autonomy, a distributed monitoring system is suggested [4]. We offer a novel distraction detection approach in this research. Shanghai Naturalistic Driving Study data and video surveillance were analyzed. By weighting focus qualities, the application software handles complicated interference and offers technique foundation and technological support for driver behavior early warning systems [5, 6]. Analyzing complicated network security situations with situational awareness is beneficial. This study introduces network security situational awareness and a novel paradigm. In network security research, we concentrate on multisource data properties and develop data-fusion-based situational awareness algorithm. Results may indicate network security [7]. Image creation is becoming increasingly vital for multisource data-based situational awareness organizations. This work proposes an image development program that detects things of interest using simply picture information and automatically establishes and stores spatial and temporal associations between images, cameras, and objects [8]. Automatic object recognition uses data fusion extensively. Data aggregation systems have complicated, unintentional, and unclear issues. A technique is provided to calculate each sensor’s fundamental probability. Combining sensor reports using conventional Dempster rules [9]. We offer a novel mobile station location tracking approach for mixed LOS/NLOS circumstances. The algorithm is adaptable. It supports many measurement techniques and asynchronous or synchronous observation data, making it ideal for future interoperable positioning systems [10]. A novel ultrawideband microwave imaging approach for early breast cancer detection is suggested. Next, the location and scattering intensity of key scatterers are determined using TOA data fusion. This approach has superior computational efficiency than others since the scanning process is confined in several candidate sites [11]. A fuzzy theory-based data fusion approach is presented and researched to identify sensor reliability and how to fuse measured data. The measurement example illustrates that this technique is possible, prioritizes stable and trustworthy sensors, has excellent measurement effect, is simple and effective, and is suitable for real-time measurement [12]. Table 1 presents a comparison of existing studies with proposed work.
Table 1 Comparison of existing studies with proposed work
| Study/Reference | Approach/Technique | Model/Algorithm | Key Contributions/Highlights |
| Baseline A [13] | Manual correlation and rule-based system | Rule-based IDS | Uses handcrafted rules for intrusion detection; limited scalability and adaptability. |
| Baseline B [14] | Digital log aggregation with alert scoring | Scoring-based IDS | Aggregates logs and assigns basic threat scores; lacks advanced correlation and fusion. |
| Baseline C [15] | Commercial threat detection with limited fusion | Proprietary system | Provides commercial-level threat detection but lacks high-level data fusion capabilities. |
| [16] | High-dimensional data feature selection | XGBoost | Applies XGBoost for selecting relevant network traffic features; enhances preprocessing and dimensionality reduction. |
| [18] | Network anomaly detection using semantic coding | Vast semantic coding + word order carelessness | Encodes network traffic in semantic space; improves detection of anomalous traffic patterns. |
| [19] | Deep learning-based intrusion detection | ResNet (CNN) + OSS + SMOTE | Combines semantic re-encoding with ResNet for generalizing unknown traffic; handles imbalanced data using OSS and SMOTE. |
| [20] | Ensemble learning for IDS | DT-EnSVM (Decision Tree + SVM) | Builds ensemble learning-based intrusion detection with data transformation; non-mixture technique enhances performance. |
| [22] | Meta-heuristic optimization | Locust Swarm Optimization (LSO) + FNN | Uses LSO to optimize Feedforward Neural Networks for network intrusion detection. |
| [23] | Hierarchical neural network IDS | LeNet-5 (CNN) + LSTM | Combines CNN and LSTM to capture spatial and temporal network traffic patterns. |
| [24] | Hybrid swarm intelligence IDS | Artificial Bee Colony (ABC) + Artificial Fish Swarm (AFS) + FCM + CART | Uses hybrid swarm algorithms; FCM for dataset reduction and CART for classification rules. |
| [25] | Cyber-physical system false alarm detection | Supervised, unsupervised, semi-supervised ML | Compares multiple learning paradigms for minimizing false alarms in CPS environments. |
| [26] | DoS attack detection with data fusion | Basic Probability (BP) NN + Dempster-Shafer (D-S) theory | Uses decision-level data fusion with BP neural networks; enhances DoS attack detection accuracy. |
| Proposed work | Multi-Source Fusion-Based Cybersecurity Situational Awareness (MF-CSSA) | Combination of data fusion, probabilistic reasoning, and graph-based analysis | Ability to function in real-time and provide accurate results and potential to be used in large networks with significant levels of information flow |
Several research suggest computer network intrusion detection systems. Baseline A method is manual correlation and rule-based system [13] that relies on pre-established criteria to identify potential threats. This baseline was chosen due to its simplicity and widespread use in traditional security information and event management (SIEM) systems. Baseline B method is digital log aggregation system with basic alert scoring [14] that facilitates the detection of possible threats. This baseline was selected due to its ability to collect and analyze log data from various sources, making it a common choice for security monitoring. Baseline C method is commercial threat detection system with limited fusion capabilities [15] that aggregates data from multiple sources. This baseline was chosen due to its advanced threat detection capabilities and its use of machine learning algorithms to identify potential threats.
Normalization begins with data preparation and high dimensional data feature selection is done using XGBoost [16, 17]. A methodology for network anomaly detection leveraging vast semantic coding space and word order carelessness [18]. Combining semantic re-encoding with deep learning improves network traffic throughput. This technique uses ResNet, a CNN-based deep learning framework, to generalize invasive unknown network traffic. One-side selection (OSS) and synthetic minority over-sampling method (SMOTE) provide a constructed dataset for model training [19]. In [20], ensemble learning and data transformation are used to create DT-EnSVM, an intrusion detection framework. The non-mixture technique builds an ensemble learning-based model from these classifiers [21]. The meta-heuristic optimization method locust swarm optimization (LSO) trains FNNs in [22]. A hierarchical neural network-based NIDS model using CNN as LeNet-5 and LSTM neural networks is shown in [23]. A hybrid artificial bee colony (ABC) and artificial fish swarm (AFS) intrusion detection technique [24] distinguishes normal and aberrant network activity. FCM (C-mean clustering) creates a tiny dataset subset. Finally, if-then rules differentiate abnormalities from ordinary traffic in classification and regression tree (CART). The authors detect cyber physical system false alarms using supervised, unsupervised, and semi-supervised learning [25]. Authors [26] employ decision-level data fusion for DoS attacks. Basic probability (BP) neural network with D-S evidence theory increase results.
As cyber-attacks become more sophisticated and complex, traditional cybersecurity systems often fail to deliver real-time situational awareness, leading to delayed threat detection, increased false positives, and overworked security analysts. Current cybersecurity solutions often rely on diverse data sources, which limits their ability to effectively predict and mitigate future threats. An urgent requirement exists for a sophisticated, scalable, and intelligent cybersecurity framework capable of real-time integration and analysis of data from diverse sources, ensuring precise threat detection, rapid response, and minimized false positives, while simultaneously improving situational awareness and facilitating informed decision-making in evolving cybersecurity contexts.
The proposed model improves cybersecurity situational awareness by combining data from many sources and utilizing sophisticated analytics to find and deal with complicated cyber threats. The model uses a trust-based weighting system to constantly check how reliable different data sources are based on their anomaly rates. This means that sources with higher anomaly rates get lower weights, which makes them less important in the overall situational awareness calculation. The model can figure out complicated cyber situations by looking at the connections between multiple danger indicators and dependencies using Bayesian reasoning and dynamic graphs.
2 Proposed Model
In the Multi-Source Fusion-Based Cybersecurity Situational Awareness (MF-CSSA) model, the credibility of a data source is determined by the frequency with which it identifies irregularities. This is accomplished via the use of trust-based weighting. By providing sources with higher anomaly rates less weight in situational awareness evaluations, this technique limits the value of such sources in order to improve situational awareness. Through the utilization of dynamic graphs and Bayesian reasoning, the model is able to understand intricate cyber circumstances by analyzing the manner in which threats interact with one another and rely on one another. A numerical representation of cybersecurity is provided to automated systems and analysts via the situational awareness index , which assists in the process of decision-making during cybersecurity incidents. Real-time risk variations on the network architecture are shown in a portion of the model depicting these variations. As an additional feature, the model makes use of reinforcement learning in order to modify its parameters in accordance with the input provided by the analyst. This assures that the system will learn from its failures and gradually enhance its functioning as a result of the acquisition of this information. As a result of this feedback loop, the model may be able to increase its trust ratings, Bayesian network parameters, and situational awareness calculations. This, in turn, improves the overall accuracy and usefulness of the cybersecurity situational awareness system. Figure 1 shows the block diagram for the proposed model.
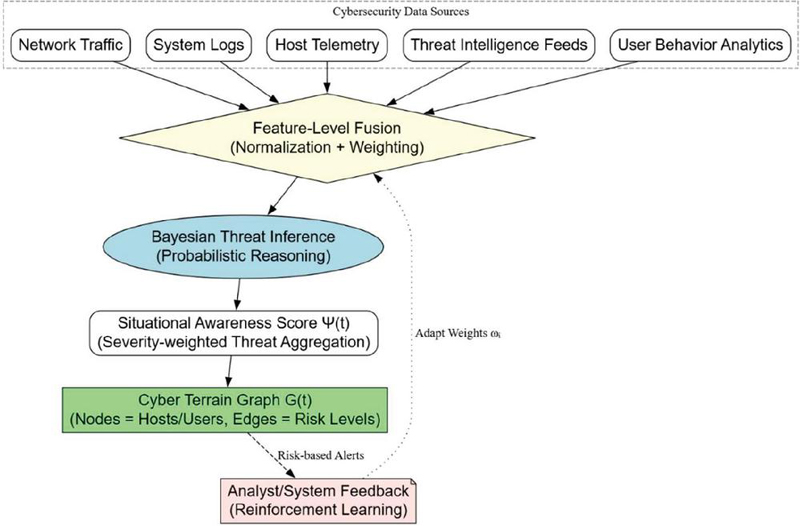
Figure 1 Workflow of proposed model.
Let there be multiple heterogeneous cybersecurity data sources (e.g., logs, network traffic, endpoint telemetry, behavioural analytics), denoted by:
Each source provides a stream of data over time:
where is a feature vector representing a cyber event or measurement.
2.1 Data Preprocessing and Normalization
To ensure that the data from different sources are on the same scale and can be effectively fused, a normalization step is crucial. The data pre-processing involves following steps:
Step 1: Data Cleaning
Multi-Source Data Fusion (MSDF) for Real-Time Cybersecurity Situational Awareness and Visualization requires data cleaning. It involves eliminating data errors, discrepancies, and missing statistics to ensure accuracy and reliability. Cleaning data involves rectifying mistakes, missing values, and validation. MSDF systems can clean data to provide accurate situational awareness. This stops errors and inconsistencies from hindering fusion.
Step 2: Data Transformation
Changing data is crucial to MSDF. Changing data into a fuseable format is necessary because distinct data sources may have different types, structures, or formats. Encode categorical data, integrate data, and format data. MSDF systems may change data format and structure to ensure consistency. The fusion process is quicker and more precise.
Step 3: Data Normalization
MSDF normalizes data to ensure all attributes are on the same scale. To prevent large-range traits from dominating fusion, this phase is crucial. Data may be normalized via min-max scaling, Z-score normalization, and temporal windowing. MSDF systems may normalize data to ensure each attribute contributes evenly to fusion. Situational awareness becomes more accurate and trustworthy.
Step 4: Filter the data
MSDF data pre-processing ends with filtering. It involves removing unnecessary or useless data for situational awareness. Data filtering includes feature selection, data reduction, and anomaly detection. MSDF systems may filter data to simplify and speed up fusion. Situational awareness is faster and more accurate.
Each data stream is normalized using a temporal-windowed function . Each stream is normalized using a temporal-windowed function :
where , are computed over a sliding window . The sliding window is used to compute the mean and standard deviation of the data points over a certain period of time. This allows the normalization function to adapt to changes in the data distribution over time.
Normalization is essential in multi-source data fusion because different data sources may have different scales, units, or distributions. Without normalization, the data fusion process may be biased towards sources with larger values or greater variability. By normalizing the data, we can ensure that each source contributes equally to the fused data, and the resulting situational awareness calculation is more accurate.
2.2 Feature-Level Fusion
The feature-level fusion process involves combining the normalized feature vectors from multiple sources into a single, comprehensive feature vector. This is achieved through weighted concatenation, where each source is assigned, a weight based on its reliability. Let be the fused feature vector at time , constructed using weighted concatenation:
where is the reliability weight of source , dynamically updated based on source trust score :
2.3 Threat Inference Using Probabilistic Graphical Model (Bayesian Network)
Threat inference employs a Bayesian Network, a probabilistic graphical model, to infer complex cyber threat scenarios from combined data. A Bayesian Network is a directed acyclic graph (DAG) that displays chance-based relationships between variables. Let a Bayesian Network be defined where nodes to threat indicators (e.g., port scan, privilege escalation), and is dependencies (e.g., attack chains).
In the Bayesian Network, each node is a danger indicator, and the edges E show how these threat indicators are related to each other. There is a conditional probability table (CPT) for each node that shows how likely the node is to be true given its parents:
If a node represents a port scan, its CPT might specify the probability of a port scan given the presence of a vulnerability in a particular service. The posterior probability of a threat scenario given fused observations is:
is the probability of the threat scenario happening given the fused observations . is the probability of the fused observations happening given the threat scenario . is the probability of the threat scenario happening before the observations. After seeing the fused data , the posterior probability shows the new likelihood of the threat scenario . You may use this probability to figure out how likely various danger situations are and then plan your actions based on that.
2.4 Situation Awareness Score
The situation awareness score is an important part of the system since it gives a measurable way to see how secure the system is right now. We call the situational awareness index and define it as follows:
where is known threat scenario, is severity score of , is the situational awareness index at time is the posterior probability of the threat scenario given the fused observations is the analyst-defined priority weight for the threat scenario and is the number of known threat scenarios.
The situational awareness index is the sum of the severity score and priority weight of each hazard scenario, multiplied by the posterior probability of each scenario.
To determine the weights , the following scheme can be employed:
1. Conduct a thorough threat assessment to identify the most critical threat scenarios and their corresponding severity scores .
2. Engage with security analysts and experts to assign priority weights to each threat scenario based on their experience, knowledge, and organizational priorities.
3. Normalize the weights to ensure that they sum up to 1, allowing for a consistent and comparable situational awareness score .
4. Continuously tune and refine the weights based on feedback from security analysts, incident response outcomes, and changes in the threat landscape.
2.5 Real-time Visualization Mapping
The system’s real-time visualization feature shows the situational awareness score in a way that is both dynamic and interactive. This lets security analysts immediately see the current state of cybersecurity and find possible dangers. A cyber landscape graph maps the situational awareness score to , which are network entities (hosts, users, devices), and , which are links with risk edge weights . A colormap function maps the color and intensity of each node in the graph to its situational awareness score . The colormap function is described as follows: . is the color of node , is the colormap function that translates the situational awareness score into a color, and is the situational awareness score of node at time . The colormap feature makes it easier for security analysts to see nodes with high situational awareness ratings and prospective security hazards.
2.6 Adaptive Learning and Feedback
The agent changes the source weights and the Conditional Probability Table (CPT) tables depending on what security analysts tell it. Figure 2 presents adaptive learning and feedback loop in MF-CSSA model. He gives feedback in the form of a binary signal . If , the analyst agrees with the system’s evaluation; if , the analyst disagrees with the system’s judgment. An analyst gives feedback to a reinforcement learning agent, which changes the source weights and CPT tables over time.
The agent uses feedback to update the source weights so that
is the current weight of source at time , is the learning rate, which controls the speed of adaptation, is the feedback signal at time , is the situational awareness score at time and is the partial derivative of the situational awareness score with respect to the source weight . The agent updates the source weights based on the difference between the feedback signal and the situational awareness score . If the feedback signal is higher than the situational awareness score, the agent increases the weight of the source. Conversely, if the feedback signal is lower than the situational awareness score, the agent decreases the weight of the source.
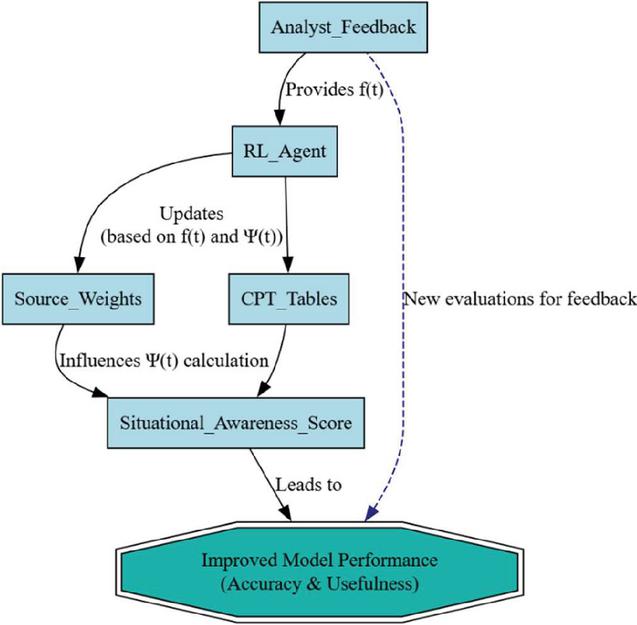
Figure 2 Adaptive learning and feedback loop in MF-CSSA model.
2.7 Limits in Threat Inference
For a threat Bayesian network with binary nodes and maximum parent count , the upper bounds for building and running such a model in cyber threat inference systems is evaluated so that parameter space is , exact inference complexity is , is treewidth and structure learning space is . As the number of threat indicators increases, the space of possible threat scenarios grows exponentially ( for binary). High parent count per node leads to exponential CPT sizes, making real-time evaluation of impractical. Computing exactly across large attack graphs hits the NP-hard boundary due to marginalization over all hidden threat variables. With fused observations , the evidence propagation requires full belief update across the network, which scales with treewidth, limiting real-time intrusion detection.
3 Experimental Set Up
A virtualized environment with several hosts, servers, and network devices was created to resemble a real-world network using VMware. Numerous network traffic and system logs from various sources, including network traffic captures from several subnets, system logs from servers, workstations, and network devices, and threat intelligence feeds, were included in the experiment’s dataset. In order to detect intrusions, CIC-IDS2017 [https://www.kaggle.com/datasets/chethuhn/network-intrusion-dataset] is used, which is a compilation of system logs and network traffic samples. In order to detect intrusions, ISCX 2012 [https://www.kaggle.com/questions-and-answers/44406], a compilation of system logs and network traffic samples, is used.
VMware is one of the virtualization platforms we utilize. Programs, operating systems, and network setup differ for every virtual machine. We gave each virtual machine IP addresses, subnet masks, default gateways, and other network settings to replicate an actual network. By joining virtual machines, a real-world network architecture is created, simulating network activity. Firewalls, switches, and routers are all made virtual. To replicate a network, DNS, DHCP, and Active Directory are set up. To test the virtualized environment, network traffic generators generate fictitious traffic. The virtualized environment is monitored and rated by performance analysis tools and network monitoring software. By following these steps, you may test and evaluate network installations and security solutions in a virtual environment that feels and looks authentic.
The effectiveness of each model’s identification, reaction time, awareness of its surroundings, number of false positives, and evolution were all evaluated. The hyperparameters of the MF-CSSA model include a uniform prior distribution for Bayesian inference, 1000 iterations, 32 batches, and a 0.01 anomaly threshold. A machine with an Intel Xeon E5-2699 v4 CPU, 64 GB of DDR4 RAM, and 1 TB of SSD storage was used to conduct the test. On Ubuntu 20.04 LTS, we used Python 3.8 with TensorFlow, PyTorch, Scikit-learn, Matplotlib, and Seaborn. While MongoDB tracked system logs and network traffic, D3.js or Matplotlib displayed the data in real time. The simulation evaluated each model over various circumstances, including high network traffic, improper human conduct, and system malfunction. Upon analyzing the experimental results, we used statistical tests to discern patterns in the data and assess their significance. The experiment assessed the efficacy of several cybersecurity situational awareness strategies by subjecting each model to a series of tests.
4 Results
A simulation was used to evaluate the efficacy of four distinct models of cybersecurity situational awareness. Each model used a distinct methodology for identifying potential dangers and monitoring ongoing developments. We examined Baseline A, a manual correlation and rule-based system [13] that employs pre-established criteria to identify risks, and Baseline B, a digital log aggregation system [14] with fundamental alert scoring that facilitates the detection of possible threats and Baseline C [15] which is a commercial threat detection system that aggregates data from several sources, although it lacks sophisticated analytical capabilities.
Figure 3 shows a complete overview of the system that is used to find cyber risks and stay informed of what’s going on. Figure 3 shows how feature-level fusion changes over time. This shows how the fused feature vector F(t) changes over time as a weighted blend of normalized data from several sources. This graphic shows how real-time data fusion works and how the system can combine data from many different sources. Figure 4 shows the posterior probability of three different cyber threat scenarios (, and ) over time, based on the aggregate input data used. This picture shows the probabilistic threat inference that can be conducted using Bayesian networks. This lets analysts keep an eye on the likelihood of a number of various threat scenarios. Figure 5 shows a single score that takes into account the severity, priority, and probability of a threat. The situational awareness score is indicated by the symbol (t). This score provides a rapid and easy-to-understand snapshot of the overall threat posture, allowing analysts to determine how much cyber risk the system is now suffering. Figure 6 illustrates an example of adaptive source weights (t). This graph depicts how the dependability weights of data sources vary over time, depending on the information analysts offer and the accuracy of the system. This graphic depicts how reinforcement learning and trust updating function. It demonstrates that the system can learn from experience and adjust how much it trusts certain data sources depending on new information.
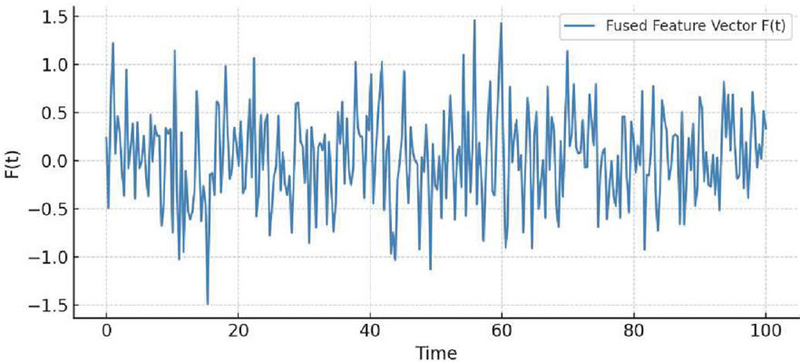
Figure 3 Feature-level fusion over time using proposed method.
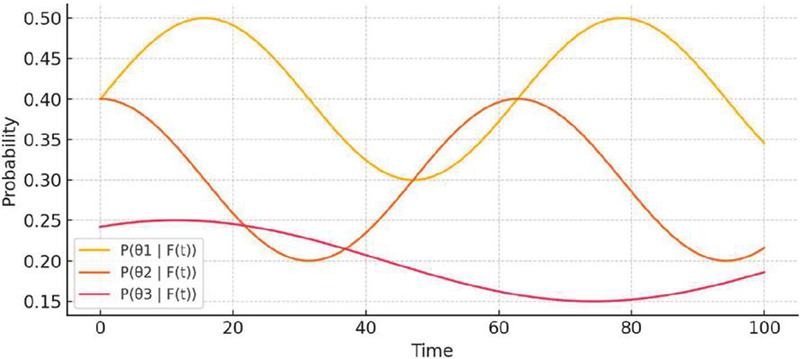
Figure 4 Posterior probabilities of threat scenarios w.r.t time using proposed method.
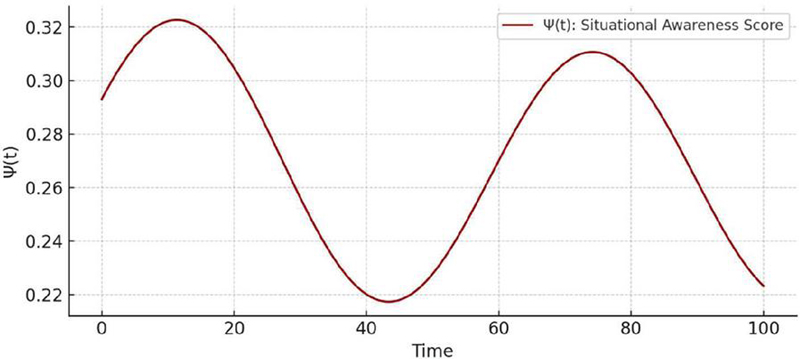
Figure 5 Situational awareness score (t) w.r.t time using proposed method.
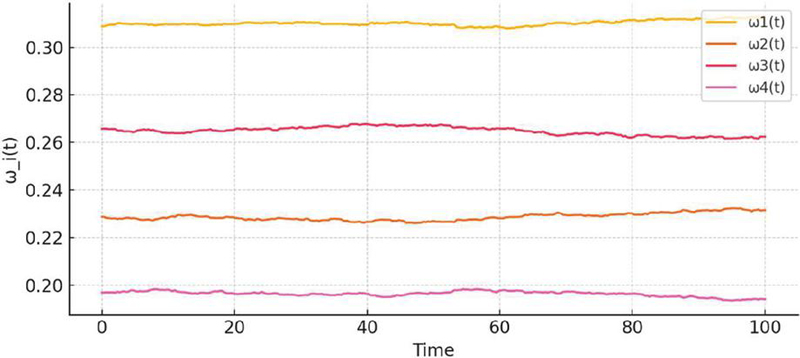
Figure 6 Adaptive source weights (t) w.r.t time using proposed method.
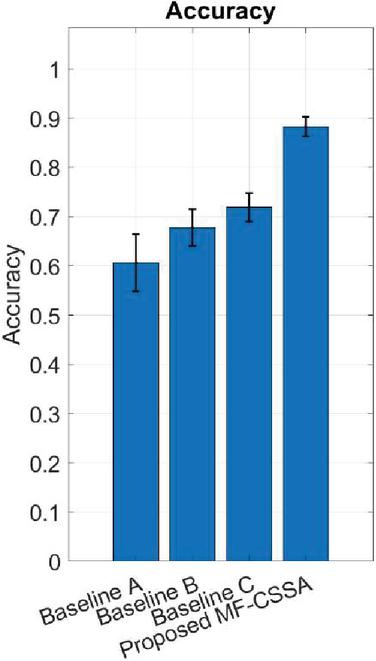
Figure 7 Threat detection accuracy.
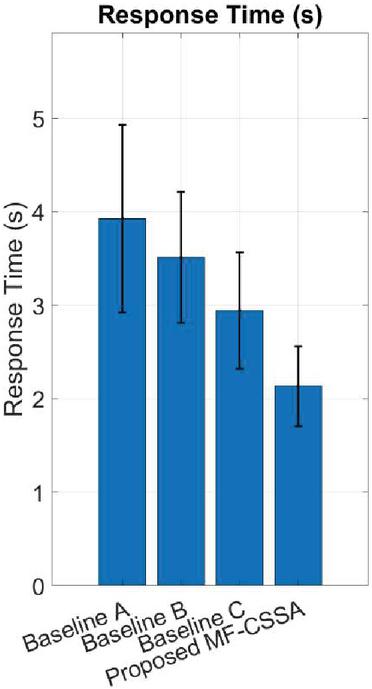
Figure 8 Response time.
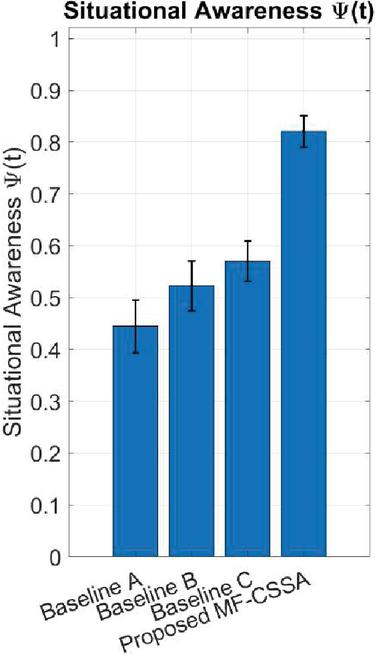
Figure 9 Situational awareness score.
The MF-CSSA model uses multi-source fusion, Bayesian inference, and adaptive visualization to create a comprehensive and ever-changing portrayal of the threat environment. The simulation allowed us to examine the advantages and disadvantages of each model in more detail. The MF-CSSA technique facilitates risk identification and increases situational awareness. We learnt a lot about the usefulness of different methods to cybersecurity situational awareness by comparing a large number of models in the simulation. The suggested MF-CSSA model (Figure 7) exhibits minimal variation among runs. On average, the model’s detection accuracy is around 88%. This outcome demonstrates the model’s strength and ability to consistently identify negative behavior, even in situations when the network’s conditions are unclear and varied. The high level of precision aids in identifying threats that might otherwise go undetected. This reduces the likelihood of false-negative security breaches. To enhance threat detection in complex environments, MF-CSSA use probabilistic Bayesian inference rather than rule-based systems, which are fixed. This is accomplished by judiciously integrating data from many sources.
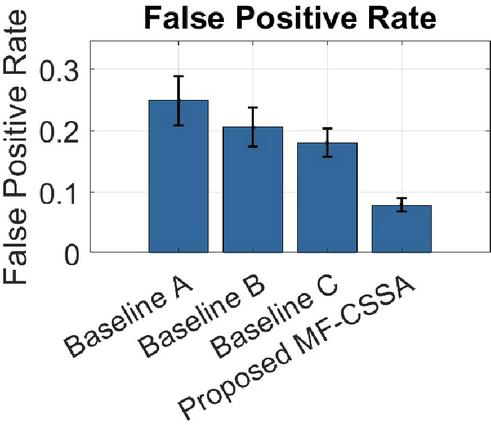
Figure 10 False positive rate.
With an average response time of 2.1 seconds, the MF-CSSA can process data almost as fast as real-time (see Figure 8). No matter how much stress or what conditions the system is under, the model always reacts fast, as seen by the small range of values observed. When it comes to cybersecurity, it is critical to act fast since even little delays may cause major issues. MF-CSSA’s dynamic data fusion architecture and automated inference approach have significantly decreased latency. These two features enable the system to rapidly assess threats and provide a real-time ranking.
The average estimated situational awareness score (t) for MF-CSSA is 0.82, as shown in Figure 9. This indicates that the model is able to contextualize security events appropriately. Numerous factors are combined into a single awareness index in this metric. These factors include the degree of risk, the asset’s significance, the system’s design, and the environmental circumstances. The ability of the model to identify potential dangers and understand how those risks impact the larger picture is indicated by a high (t) score. Because they can comprehend the context, cybersecurity personnel are able to make strategic judgments. This enables them to enhance their response operations and focus on the most critical occurrences.
For identifying anomalies that are not dangerous, the model’s very low false positive rate of 8% is significantly superior than that of conventional techniques (see Figure 10). This high level of accuracy reduces unnecessary questions and keeps cybersecurity professionals from receiving too many notifications. Because MF-CSSA can understand context, it can provide warnings that are more accurate and helpful. It does this via pattern-based anomaly detection and multi-source fusion. This ensures that individuals only notice actual security risks and improves the efficiency of operations.
An average of 110 events per second may be handled by MF-CSSA, demonstrating its ability to expand and function well when dealing with large amounts of data (Figure 11). This graphic illustrates how well the model functions when considering the massive amounts of data produced by cloud-based or enterprise-scale cybersecurity solutions. The system’s resilience and stability are shown by its ability to handle a range of loads without gradually reducing its throughput.
The MF-CSSA model is good for real-time cybersecurity situational awareness since it has excellent detection accuracy and quick reaction times. The model’s situational awareness score gives a complete picture of the danger level, which helps analysts make smart choices. The model’s low false positive rate cuts down on unwanted alerts and makes cybersecurity operations more efficient. Because the model can be scaled up, it can be used for large-scale cybersecurity solutions.
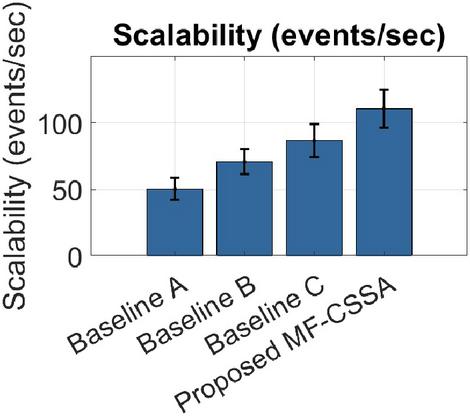
Figure 11 Scalability (events per second).
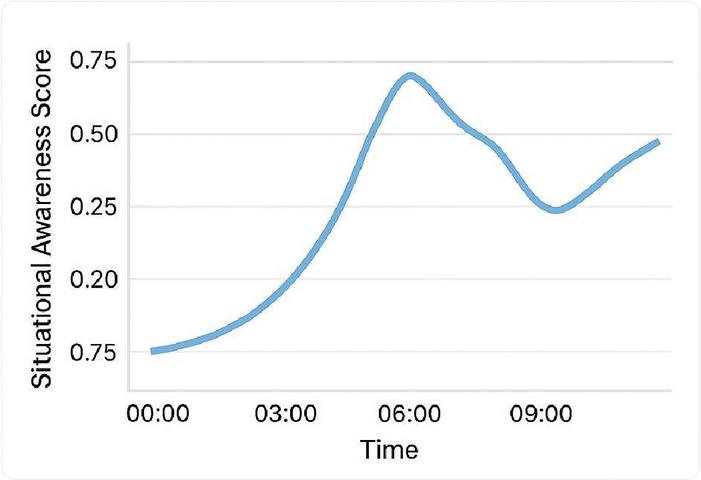
Figure 12 Situational awareness: anomaly time series.
The situational awareness score graph in Figure 12 shows how the adaptive Bayesian network changes over time. It shows how the network can combine input from many sources, change the weights of those sources, and respond to unusual events and feedback from analysts. At first, the system has a low score, perhaps because it doesn’t have enough data or because it was just turned on. But when additional data and input are added, the model quickly picks up on trends, which makes it much more aware of what’s going on. The score is highest when the algorithm is sure that evidence from diverse sources matches up, which means that the threat assessment is quite definite. Still, the score might go down when new or contradicting evidence comes in, which shows that the system is always re-evaluating its danger ideas. The adaptive learning loop lets the system get back on track and stabilize by adjusting source weights and taking analyst comments into account. This non-linear pattern shows that the system can keep up with streaming data and danger indicators, giving it a strong and flexible situational awareness capabilities. The changes in the graph show how important it is to integrate real-time data, get input from analysts, and learn as you go in order to maintain an accurate and up-to-date threat assessment.
5 Conclusion
The proposed MF-CSSA model can get information from a lot of different places and understand complex cyber threat situations thanks to the usage of dynamic graphs, Bayesian inference, and trust-based weighting. We can measure how effectively the current cybersecurity posture is working by utilizing a technique called the situational awareness score. This score shows how successfully this performance is being carried out. After 100 simulation cycles, MF-CSSA consistently beats baseline approaches. Given its 88% threat detection accuracy, the model predicts hostile actions consistently by integrating data and probabilistic reasoning. Its average response time of 2.1 seconds shows how vital real-time functionality is. This preempts assaults. The model can recognize and contextualize cybersecurity incidents with an average situational awareness score of 0.82. It adapts quickly to new threats. The methodology reduces analyst workload and alert fatigue while reducing false positives to 8%. MF-CSSA can process 110 events per second, therefore it can create and manage a lot of traffic. Because of this, it is suitable for large networks with high information flow. These statistics show that the MF-CSSA architecture enables intelligent, practical, and accurate real-time cyber threat protection.
In the future, the proposed model will need to be updated to accommodate new threats including IoT-based assaults, cloud-based threats, and AI-powered attacks. It will also need to be made more scalable and faster for big datasets and fast networks. Also, making the model’s decision-making process more understandable and clearer, looking at ways for humans and machines to work together, and finding ways to spot assaults would make the model even better. Additionally, creating situational awareness procedures that take into account the context and testing and verifying the model with real-world datasets and situations will make sure that it gives accurate and useful situational awareness. By following these steps, the MF-CSSA model may be improved to provide complete and changing situational awareness in complicated cybersecurity settings.
Conflicts of Interest
The authors declare that they have no conflicts of interest.
References
[1] Zhang J., Chen K. T., Jia M., and Baba T., Hybrid MAC-based multipoint relay with energy awareness for system data sharing in wireless sensor network, Journal of Signal Processing. (2012) 16, no. 6, 527–535, https://doi.org/10.2299/jsp.16.527.
[2] Downs R. C., Live panoramic surveillance and spatial awareness achieved through optimized array sensor at source data fusion, Proceedings of SPIE-The International Society for Optical Engineering. (2001) 4363, 198–206.
[3] Minor C. P., Steinhurst D. A., and Johnson K. J., A full-scale prototype multisensor system for damage control and situational awareness, Fire Technology. (2010) 46, no. 2, 437–469, https://doi.org/10.1007/s10694-009-0103-y, 2-s2.0-77952421781.
[4] Bouvry P., Chaumette S., Danoy G., Guerrini G., Jurquet G., Kuwertz A., Muller W., Rosalie M., and Sander J., Using heterogeneous multilevel swarms of UAVs and high-level data fusion to support situation management in surveillance scenarios, IEEE International Conference on Multisensor Fusion & Integration for Intelligent Systems, 2017, Baden-Baden, Germany.
[5] Odumuyiwa, V., and Alabi, R. DDOS Detection on Internet of Things Using Unsupervised Algorithms. Journal of Cyber Security and Mobility, (2021), 10(3), 569–592. https://doi.org/10.13052/jcsm2245-1439.1034.
[6] Guo R., Zhou Y., Zhao J., Yao R., Liu B., and Zhang X., Unsupervised spatial-awareness attention-based and multi-scale domain adaption network for point cloud classification, International Journal of Wavelets Multiresolution and Information Processing. (2021) 19, no. 4, https://doi.org/10.1142/S0219691321500077.
[7] Chen G., Cai J. P., and Yang J., Network security situation awareness based on multi-source data fusion, Advanced Materials Research. (2014) 989–994, 4885–4888, https://doi.org/10.4028/www.scientific.net/AMR.989-994.4885, 2-s2.0-84905842303.
[8] Thomas J. T., Gains D., and Malloy A., Content-based image exploitation for situational awareness, Proceedings of SPIE - The International Society for Optical Engineering. (2008) 6956, article 695604.
[9] Yong D., Su X., and Dong W., Target recognition based on fuzzy Dempster data fusion method, Defence Science Journal. (2010) 60, no. 5, 525–530, https://doi.org/10.14429/dsj.60.576, 2-s2.0-77957592770.
[10] Chen L. and Lenan W. U., Mobile positioning in mixed LOS/NLOS conditions using modified EKF banks and data fusion method, IEICE Transactions on Communications. (2009) 92, no. 4, 1318–1325, https://doi.org/10.1587/transcom.E92.B.1318, 2-s2.0-70350247466.
[11] Chen Y., Gunawan E., and Kim Y., UWB microwave imaging for breast cancer detection: tumor/clutter identification using a time of arrival data fusion method, IEEE Antennas and Propagation Society International Symposium, 2006, Albuquerque, NM, USA.
[12] Han F., Zhu L., and Zhi X., Measurement of multi-sensor data fusion method based on fuzzy theory, Journal of Applied Optics. (2009) 30, no. 6, 988–991.
[13] Asad, H., Adhikari, S. and Gashi, I. A perspective–retrospective analysis of diversity in signature-based open-source network intrusion detection systems. Int. J. Inf. Secur. 23, 1331–1346 (2024). https://doi.org/10.1007/s10207-023-00794-9.
[14] Cai, S., Gallina, B., Nyström, D. et al. Data aggregation processes: a survey, a taxonomy, and design guidelines. Computing 101, 1397–1429 (2019). https://doi.org/10.1007/s00607-018-0679-5.
[15] Talukder, M.A., Islam, M.M., Uddin, M.A. et al. Machine learning-based network intrusion detection for big and imbalanced data using oversampling, stacking feature embedding and feature extraction. J Big Data 11, 33 (2024). https://doi.org/10.1186/s40537-024-00886-w.
[16] Zhao, F., Zhang, H., Peng, J., Zhuang, X., Na, S.G. A semi-self-taught network intrusion detection system. Neural Comput. Appl. 2020, 32, 17169–17179.
[17] Devan, P., Khare, N. An efficient XGBoost–DNN-based classification model for network intrusion detection system. Neural Comput. Appl. 2020, 32, 12499–12514.
[18] Wu, Z., Wang, J., Hu, L., Zhang, Z., Wu, H. A network intrusion detection method based on semantic Re-encoding and deep learning. J. Netw. Comput. Appl. 2020, 164, 102688.
[19] Jiang, K., Wang, W., Wang, A., Wu, H. Network intrusion detection combined hybrid sampling with deep hierarchical network. IEEE Access 2020, 8, 32464–32476.
[20] Gu, J., Wang, L., Wang, H., Wang, S. A novel approach to intrusion detection using SVM ensemble with feature augmentation. Comput. Secur. 2019, 86, 53–62.
[21] Gao, X., Shan, C., Hu, C., Niu, Z., Liu, Z. An adaptive ensemble machine learning model for intrusion detection. IEEE Access 2019, 7, 82512–82521.
[22] Benmessahel, I., Xie, K., Chellal, M., Semong, T. A new evolutionary neural networks based on intrusion detection systems using locust swarm optimization. Evol. Intell. 2019, 12, 131–146.
[23] Zhang, Y., Chen, X., Jin, L., Wang, X., Guo, D. Network intrusion detection: Based on deep hierarchical network and original flow data. IEEE Access 2019, 7, 37004–37016.
[24] Hajisalem, V., Babaie, S. A hybrid intrusion detection system based on ABC-AFS algorithm for misuse and anomaly detection. Comput. Netw. 2018, 136, 37–50.
[25] Sahu, A., Mao, Z., Wlazlo, P., Huang, H., Davis, K., Goulart, A., Zonouz, S. Multi-Source Data Fusion for Cyberattack Detection in Power Systems. arXiv 2021, arXiv:2101.06897.
[26] Chen, K., Gu, L., Sun, J. A DoS Attack Detection Method Based on Multi-source Data Fusion. In Proceedings of the 4th International Conference on Computer Science and Application Engineering, Sanya, China, 20–22 October 2020; pp. 1–8.
Biographies

Xiangyang Li (M’76–SM’81–F’87) (June 1975), male, native to Shaanxi, China, graduated from Xinjiang University. Currently, he holds a Master’s degree and is an associate professor at College of Information Engineering, Tarim University. His research interests include Network technology, multimedia technology, information management (smart campus construction), etc.

Jianhua Zhang (M’76–SM’81–F’87) (Dec. 1991), male, native to Ningxia, China, graduated from Tarim University. Currently, he holds a bachelor’s degree and is an engineer from the Network Information Center, Tarim University. His research interests include network technology, security technology, big data, digital campus construction, etc.
Journal of Cyber Security and Mobility, Vol. 14_4, 955–980.
doi: 10.13052/jcsm2245-1439.1448
© 2025 River Publishers