Efficient Network Attack Detection Method Combining SSPCA and Layered Detection
Rui Huang
Dazhou Industrial and Park Development Promotion Center, Dazhou 635000, China
E-mail: eric.huangrui@outlook.com
Received 14 October 2025; Accepted 09 February 2026
Abstract
With the deep integration of industrial control networks and information technology, the problems of high-dimensional data redundancy, multi-stage attack concealment and class imbalance lead to the inefficiency of traditional intrusion detection methods. To this end, the new frameworks of Stacked Sparse Principal Component Analysis (SSPCA) and Step-by-Step Industrial Control Intrusion Detection (SSICID) are proposed. The SSPCA reduced the dimensionality of high-dimensional industrial control network traffic data to 12 dimensions by sparse constraint and principal component stacking strategy, which improved the accuracy by 62.5% compared with traditional Principal Component Analysis (PCA). The SSICID used a layered detection architecture to achieve 98.8% detection accuracy, 97.0% recall, and 0.3 second CPU response time on ICS-CERT datasets, which was 4.5% more accurate and 40% faster than the existing optimal model. The proposed model provides an efficient solution for the real-time monitoring of complex attacks in industrial control networks and has important practical significance for ensuring the security of critical infrastructure.
Keywords: SSPCA, ICN, attack, cost sensitive, data dimensionality reduction, CNN.
1 Introduction
As the core of modern industrial automation, Industrial Control Systems (ICSs) are widely used in key infrastructure fields such as energy, manufacturing, and transportation [1]. Industrial Control Networks (ICNs) integrate sensors, controllers, and actuators to realize real-time monitoring and optimization of production processes, significantly improving industrial efficiency [2, 3]. However, with the deep integration of ICS with information technology, ICN’s openness continues to increase, making it a high-value target for cyber attacks. In recent years, malicious attacks targeting ICNs (such as Stuxnet, ransomware, and distributed denial of service attacks) have occurred frequently, resulting in equipment damage, production disruption, and even security incidents [4, 5]. In this context, efficiently identifying abnormal traffic and complex attacks in ICN has become the core challenge to ensure the safe and stable operation of industrial systems. At present, intrusion detection methods to deal with ICN security threats mainly include traditional dimensionality reduction and statistical methods, deep learning models, and hybrid methods [6, 7]. Due to the high dimension of ICN traffic data and strong correlation between features, traditional dimensionality reduction methods make it easy to lose key information, resulting in a decrease in detection accuracy. The proportion of normal traffic is much higher than that of attack data. The traditional classifier is biased to most classes and misses critical attack events. At the same time, the multi-stage attack means has the characteristics of concealment and dynamic evolution, and it is difficult to capture its multi-dimensional characteristics by a single detection model. Therefore, this study aims to build an efficient and high-precision ICN intrusion detection model, combining the Stacked Sparse Principal Component Analysis (SSPCA) algorithm with a Step-by-Step Industrial Control Intrusion detection (SSICID) strategy to build a new model. There are two innovations in this study. First, the SSPCA is used to preserve important features in the data and remove redundant information, thereby improving the efficiency and accuracy of data analysis. Second, the SSCID method divides the intrusion detection process into several steps, each targeting a specific detection target and strategy, thereby improving the accuracy and real-time performance of detection. Through the newly constructed monitoring model, it is hoped to provide new ideas and detection methods for the security protection of ICS. The contribution of this study lies in proposing a detection framework that integrates SSPCA and SSICID, organically combining sparse constraints, principal component stacking, and hierarchical detection mechanisms to achieve end-to-end optimization from feature dimensionality reduction to multi-stage attack identification. SSPCA, through sparse constraints and stacking strategies, retains key discriminative features while reducing dimensionality, significantly reducing reconstruction errors. Furthermore, SSPCA employs hierarchical detection combined with a cost-sensitive mechanism, enabling dynamic adjustment of classification weights and effectively improving the recognition rate and model robustness for complex attacks. Simultaneously, the introduction of class cost weights in CS CNN and CS SVM alleviates the classifier’s bias towards the majority class.
The research structure is as follows: The second part introduces related work, systematically reviews the technical characteristics and limitations of existing ICN intrusion detection methods, and defines the innovation direction of this research; The third part elaborates on the sparse dimension reduction principle of SSPCA algorithm and the hierarchical detection architecture of SSICID model. The fourth part shows the experimental results and verifies the model performance through reconstruction error, detection accuracy, and real-time performance. The fifth part summarizes the research results and discusses the advantages of the SSICID model. The last part looks forward to the application potential of the research method in the safety protection of ICS, analyzes the shortcomings of the research, and puts forward the future research direction.
2 Related Work
In ICS, the application of data acquisition and monitoring control systems can lead to the growth of heterogeneous sensor data, as well as network intrusions and attacks. For this reason, the network attack detection has been deeply studied. Ahakonye L A C et al. proposed an attack detection and classification method that combines efficient machine learning classifiers and unbiased feature selection techniques by comparing and analyzing several feature selection techniques. This method has been applied to data acquisition and monitoring control systems and proved to be effective in reducing false positive rates and overall model execution time [8]. Wang W et al. proposed a detection model based on deep residual Convolutional Neural Networks (CNN) and applied this model to the ICS anomalous flow detection task, aiming to prevent gradient explosion or disappearance and ensure the detection accuracy of the model. This method performed well in terms of detection accuracy and effectively solved the problem of long-term training of deep learning models [9]. Kravchik M et al. proposed a detection model based on simple lightweight neural networks to solve the problem of attack detection in ICS and implement attack detection by using one-dimensional CNN and autoencoders. In addition, the model combined Principal Component Analysis (PCA) to complete data preprocessing and feature selection. This model was highly robust in the face of adversarial attack detection tasks [10].
Aiming at the security problem of Android mobile phones in 5G networks, Ahmed A. et al. proposed a prediction model based on Recurrent Neural Networks (RNN) to enhance the security of mobile phones by detecting side-channel attacks. The study found that even a small amount of training data was able to accurately identify 37.5 percent of unseen user input, and the method’s touch detection mechanism achieved 92 percent accuracy. These results showed that this model could effectively improve the security of mobile phones in 5G networks and enhance user privacy protection and data security [11]. Mimura M et al. proposed a new word classifier that preserves word order during word segmentation conversion to address the problem of attack avoidance faced by machine learning models when detecting unknown malware. By using models such as RNN and Long Short-Term Memory Networks (LSTM) and evaluating unbalanced datasets, this method successfully improved the detection rate of malware to more than 0.8. By taking the words that only appear in benign samples as parameters of non-functional operations, the detection rate of circumvention attacks was reduced to 0.89. Finally, it was verified that the detection rate of malicious samples in the real environment of the method was consistent, proving the effectiveness of the method [12]. Desai A. et al. proposed a depth classifier method based on sharing and hunting optimization to improve the detection accuracy and utilization efficiency of Primary User Simulation Attacks (PUEA) in cognitive radio networks. By using a three-layer method and a CNN classifier based on sharing and hunting optimization, the malicious user behavior was studied to avoid interference with the main user. By using Rayleigh and AWGN channels for evaluation, performance indicators such as detection rate, delay, and throughput were analyzed. The results showed that the detection rate and throughput of this method in attack detection had high accuracy and low latency. Finally, it was proved that this method could significantly improve the protection performance of cognitive radio networks [13].
The existing methods have made some progress in feature dimension reduction, classifier design, and real-time optimization, but there are still some limitations. For example, Kravchik et al. combined PCA with an autoencoder for anti-attack detection, which improved robustness, but its linear dimensionality reduction resulted in insufficient feature retention ability for nonlinear high-dimensional data and high reconstruction error. The proposed method by Wang et al. had high model complexity, time-consuming training, and dependence on large-scale labeled data, which is difficult to adapt to resource-constrained industrial scenarios. In addition, there are still some problems in the current research, such as class imbalance and insufficient detection of dynamic attacks. Therefore, the SSPCA-SSICID model is proposed to solve the above problems. The advantage of this model is that it can retain the nonlinear feature relationship while reducing the reconstruction error by stacking SSPCA. Hierarchical detection architecture is adopted to dynamically adjust classification weights through a cost-sensitive mechanism to solve the problem of category imbalance. Combining the parallel computing advantages of Cost-Sensitive CNN (CS-CNN) and the incremental learning capability of Extreme Gradient Boosting (XGBoost), the response time of the model is improved while the detection accuracy is guaranteed. The comparison of the advantages and disadvantages of the above methods is shown in Table 1.
Table 1 Related works table
| Method | Core Method | Advantage | Limitation |
| Ahakonye et al. [8] | Feature selection + SVM | Low false alarm rate | Cannot handle dynamic multi-phase attacks |
| Wang et al. [9] | Depth residual CNN | High detection accuracy | The model is complex and the training time is long |
| Kravchik et al. [10] | PCA + autoencoder | Strong robustness against confrontation attacks | High reconstruction error due to linear dimensionality reduction |
| Ahmed et al. [11] | RNN + side channel analysis | Small sample is adaptable | The ability to generalize across protocols is insufficient |
| Mimura et al. [12] | Word segmentation + RNN/LSTM | High circumvention detection rate | High computational complexity and poor hardware support |
| Desai et al. [13] | Optimize the CNN classifier | High throughput and detection rate | High response delay |
| Research method | SSPCA + Layered detection architecture | High accuracy, low latency | Rely on multi-model collaborative parameter adjustment |
3 Methods and Materials
To achieve accurate monitoring of abnormal attack data in ICN, this study first optimizes the PCA algorithm and proposes SSPCA, which is used to process high-dimensional attack data. Secondly, an SSICID model is constructed, which combines three different network structures to complete the classification and detection of ICN attack data.
3.1 ICN Data Dimensionality Reduction Processing Based on SSPCA Strategy
ICS is an integrated system used for managing, controlling, and automating industrial processes, typically used in fields such as manufacturing, energy, transportation, and water treatment [14, 15]. ICN refers to the communication network that connects and supports various components of ICS, including various network protocols, hardware devices, and software systems. ICN is used to achieve data transmission and information exchange between different controllers, sensors, actuators, and human-machine interfaces. The topology structure of common ICNs is shown in Figure 1.
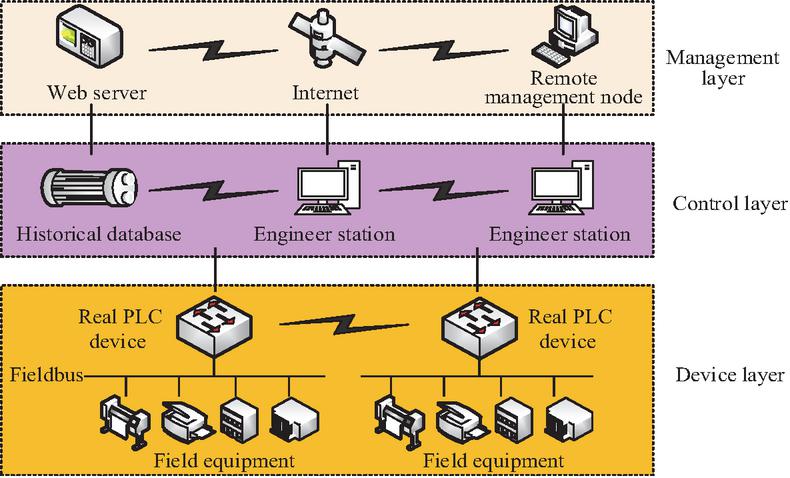
Figure 1 ICN structure.
The ICN in Figure 1 is mainly divided into three parts: the information management layer, the control layer, and the on-site equipment layer. The information management layer includes the information management system and the manufacturing execution system, which are connected to the Internet through network communication technology to realize real-time industrial process monitoring and intelligent decision-making. The control layer is the link between the information management layer and the on-site equipment layer, responsible for data collection and transmission. This layer controls on-site equipment through control logic and monitors the operating status of the equipment through SCADA components and human-machine interaction. The on-site equipment layer controls the normal operation of the equipment in real-time and obtains the status of the production process. For ICN, its large data sensors can lead to large dimensions of the original data and deviations from the easy processing range. If these data are directly input into the classifier, it will not only increase the pressure on computing resources but also reduce the network’s ability to identify abnormal attacks. Considering the strong correlation of the ICN dataset, this study first utilizes an improved PCA to explore the relationships between data dimensions, thereby improving the system’s ability to identify abnormal attack data [16, 17]. Assuming represents the transpose matrix of a data matrix , the load matrix is used to perform principal component projection on . To maximize variance, needs to satisfy the condition in Equation (1) [18].
| (1) |
In Equation (1), the first load vector is redefined as the unit vector. is the constraint condition, at which point takes a value of 1. represents the result of projecting onto . represents the transpose of . Equation (1) defines the core optimization objective of traditional PCA by maximizing the variance of the projected data to find the load vector of the first principal component. The calculation formula for the -th principal component is shown in Equation (2).
| (2) |
In Equation (2), represents the new data matrix of the -th principal component, which can be obtained by subtracting the variance of the first principal components from . and represent the transposions of the -th and -th load vectors, respectively, where takes a value of 1. Equation (2) calculates the residual matrix of the -th principal component and realizes the gradual dimensionality reduction of the data by iteratively subtracting the contribution of the first principal component. The expression for the -th load vector is shown in Equation (3).
| (3) |
In Equation (3), represents the transpose of the new data matrix for the -th principal component. Equation (3) defines the load vector of the -th principal component, and extracts subsequent principal components by maximizing the variance of the residual matrix. The optimization mathematical model of PCA under the Lagrange multiplier method can be obtained by combining Equations (1) to (3), as shown in Equation (4).
| (4) |
In Equation (4), represents the Lagrange multiplier, with a range of . Equation (4) transforms the PCA problem into a constrained Lagrangian optimization form and solves the principal components by eigenvalue decomposition, providing a mathematical framework for the improvement of sparse PCA. Treating as the covariance matrix of PCA requires eigenvalue decomposition to obtain the corresponding feature sequence. Let , the eigenvectors corresponding to the first eigenvalues are taken to form the load matrix , and then the solution of PCA is obtained.
Considering that the principal components of traditional PCA are usually linear combinations of all original variables, all variable loadings in each principal component vector may be non-zero, making it difficult to explain the principal components. In addition, traditional PCA has poor computational efficiency in situations with high data dimensions and is also very sensitive to outliers. Therefore, this study proposes Sparse Principal Component Analysis (SPCA) for optimization. SPCA is an improvement on traditional PCA, which introduces sparsity constraints in the optimization process, reducing the number of non-zero coefficients contained in each principal component vector, thereby improving interpretability and interpretability [19, 20]. In SPCA, the expression of the empirical covariance matrix is shown in Equation (5).
| (5) |
In Equation (5), represents the empirical covariance matrix in SPCA, and the dimension is denoted as . Equation (5) calculates the covariance matrix of sparse PCA to provide input for subsequent sparse constraints. Let , the expression of the sparse principal component problem is obtained, as shown in Equation (6).
| (6) |
In Equation (6), represents the unit vector, . and represent the -norm and -norm of , respectively. In Equation (6), L1 and L2 regularization terms are introduced into the PCA objective function to force the sparsity of the load vector and improve the feature interpretability. Two different Lasso norms define the number of non-zero elements of . To ensure the orthogonality of SPCA, this study uses the minimum reconstruction error method to calculate the principal components. Assuming , . Firstly, initializing the matrix , and is taken as the loads of the first general principal components, and then to solve the elastic network problem in Equation (7) [21].
| (7) |
In Equation (7), represents the sparse version of the -th principal component load vector obtained through sparse regression. and represent the -norm and -norm in elastic network problems, respectively, and are used for the and regularization terms. , and represent three different regularization parameters, respectively, used to control the sparsity level. After optimizing the value of using sparse regression, setting , then performing singular value decomposition on and updating the value of . Equation (7) optimizes the load vector by sparse regression, iteratively updates sparse principal components, and solves the redundancy problem of traditional PCA in high-dimensional data. The sparse regression and singular value decomposition are continuously repeated into two steps, until the SPCA under the minimum reconstruction error method completes iterative convergence, and finally obtains the optimized load vector.
The dimensionality reduction of ICN datasets typically relies on traditional PCA or deep learning auto-encoders. However, using these methods to directly reduce the dimensionality of the dataset cannot effectively distinguish between feature selection and dimensionality reduction processes, making it difficult to reduce dimensions while retaining hidden information in the data. This study proposes a new dimensionality reduction method by combining PCA and SPCA, which is referred to as SSPCA. The data dimensionality reduction process of SSPCA in ICN is shown in Figure 2.
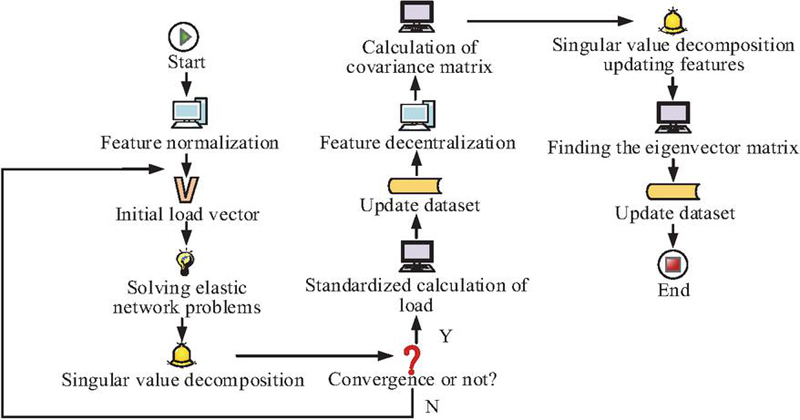
Figure 2 Flowchart of SSPCA operation.
In Figure 2, the SPCA part first normalizes the data features and initializes the load vector, then updates the matrix by solving the elastic network problem and singular value decomposition until the algorithm converges. The PCA part decentralizes the updated data and calculates the covariance matrix, then performs eigenvalue decomposition, updates the eigenvectors, and constructs the eigenvector matrix. Finally, the matrix is used to transform the data and obtain a reduced-dimensional dataset. Overall, SSPCA performs feature selection first and then dimensionality reduction, combining the advantages of SPCA under the minimum reconstruction error method and traditional PCA. Finally, efficient dimensionality reduction of ICN datasets is achieved through a stacked model.
3.2 Construction of ICN Attack Detection Model Based on SSICID Strategy
Based on the above content, this article discusses in detail the dimensionality reduction method of ICN data based on the SSPCA strategy. Moreover, it explains how to effectively reduce the dimensionality of high-dimensional data in ICN by combining the advantages of PCA and SPCA, thereby improving the system’s processing efficiency and ability to identify abnormal attacks. Next, the study further discusses how to build an SSICID attack detection model based on dimensionality reduction data to deal with redundant noise, unbalanced data, and complex traffic problems in ICN. Through a multi-level classification strategy, the SSICID model can effectively improve the security and stability of the ICN system.
Although the SSPCA algorithm can reduce the dimensionality of high-dimensional data in ICN, thereby reducing the computational pressure of the model. However, considering the drawbacks of large data volume, redundant noise, and imbalanced data in ICN, this study further constructed the SSICID model to complete the attack monitoring task of ICN. The overall structure of the SSICID model is shown in Figure 3.
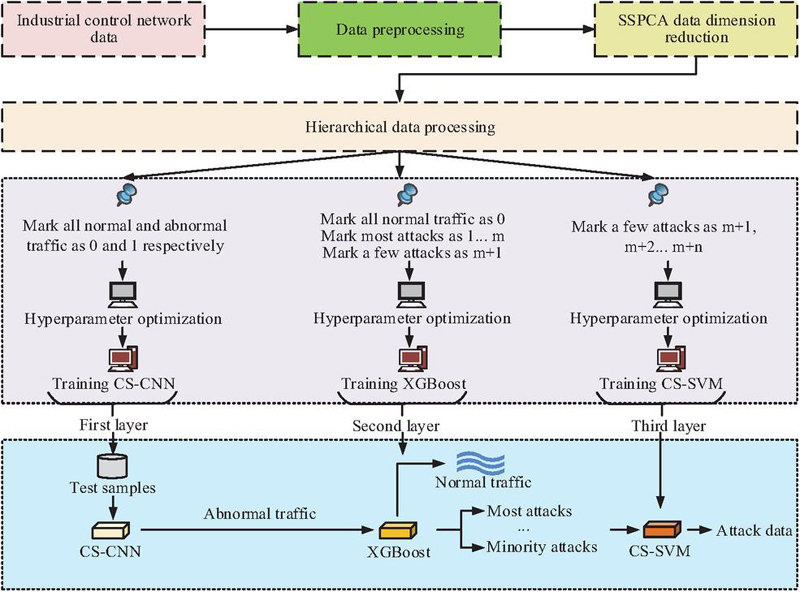
Figure 3 SSICID model framework structure.
Figure 3 shows the overall framework structure of the SSICID model, which consists of three layers: CS-CNN, XGBoost, and Cost-Sensitive Support Vector Machine (CS-SVM). The first layer of the model uses CS-CNN to divide the ICN traffic dataset into normal traffic and abnormal traffic. The identified abnormal traffic will be sent to the second layer for further classification. The second layer uses XGBoost to divide the incoming abnormal traffic into majority attack traffic and minority attack traffic. The traffic identified as a minority attack class is then sent to the third layer and finally separated using the CS-SVM algorithm [22, 23]. In the first layer, the structure of CS-CNN is shown in Figure 4.
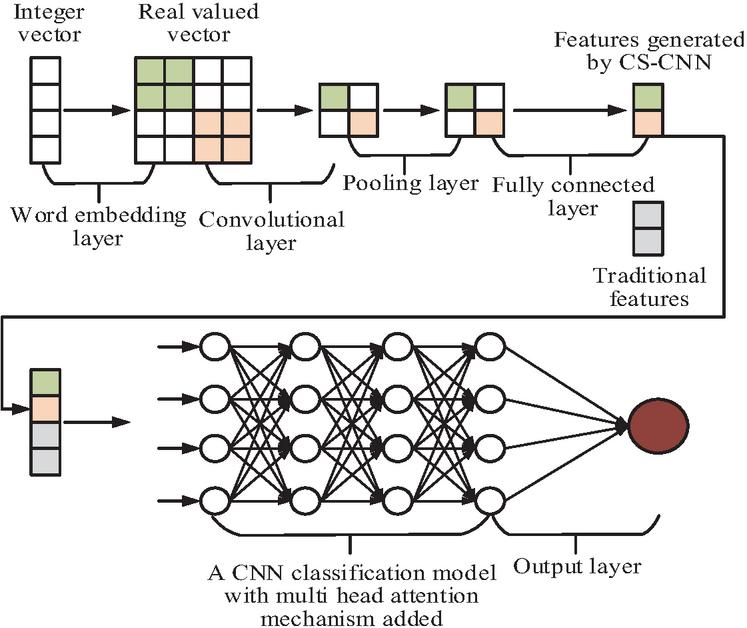
Figure 4 CS-CNN structure.
The CS-CNN in Figure 4 is the first layer of the SSICID model, used for the preliminary classification of traffic data in the ICN. Its structure is mainly divided into two parts. Part 1 is to first convert the traffic data in ICN into real-valued vectors with semantic features, and then input these vectors into CNN. Part 2 is to use CS-CNN to complete data classification. Firstly, the input layer will receive traffic data from the ICN, which includes multidimensional features and can be time series data or other forms of network traffic records. Next, the convolutional layer will extract local features of the input data through a series of convolutional operations. The pooling layer will reduce the dimensionality of the features extracted by the convolutional layer, retain important information, and reduce computational complexity. The feature vectors output by the pooling layer are further combined to generate the final classification result in the fully connected layer. Finally, based on the preliminary classification results of the data, it is divided into normal traffic and abnormal traffic. Abnormal traffic will be transmitted to the second layer of the SSICID model for further processing. In CS-CNN, a multi-head attention mechanism is added to filter out irrelevant information for prediction, allowing the model to focus on specific parts of the input. Specifically, firstly, the local feature maps output by the convolutional layers are reshaped into sequence-based feature vectors, and three matrices – query (Q), key (K), and value (V) – are generated through linear transformation. Next, Q, K, and V are input into multiple parallel attention heads, each independently calculating the association weights between features. An initial attention score is obtained by calculating the similarity between Q and K, then normalized by an activation function, and finally weighted and summed with V to obtain the output features of each attention head. Then, the output features of all attention heads are concatenated along the channel dimension and fused through a fully connected layer to obtain the final multi-head attention feature map, thus integrating the multi-dimensional association information captured by different attention heads. Finally, the fused attention feature map is input into a pooling layer, and then further processed by a fully connected layer for classification. This ensemble approach retains the ability of CNNs to extract local spatial features while strengthening the focus on attack-related key features through the multi-head attention mechanism, effectively suppressing the interference of redundant information [24, 25]. To address the issue of class imbalance, this study combines cost sensitive methods with CNN’s loss function, using the cost-sensitive binary cross entropy loss function as the loss function. In the second layer of the SSICID model, it is continued to use the XGBoost classifier to identify the majority and minority attack traffic, as shown in Figure 5.
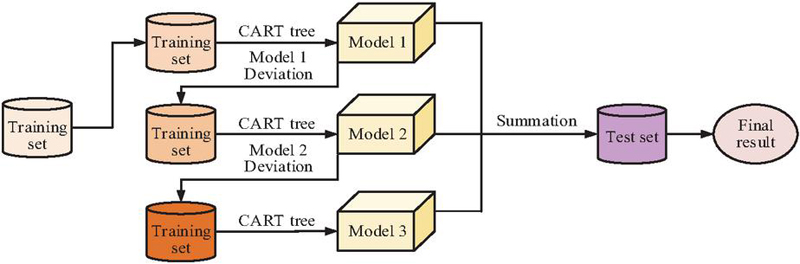
Figure 5 Flowchart of XGBoost for classifying anomalous traffic.
Figure 5 shows the workflow of the XGBoost classifier completing the ICN attack data classification task in the second layer. Firstly, the training set constructs the first decision tree (referred to as Model 1) using CART classification and regression tree algorithms, generates prediction results, and calculates their residual values. Secondly, the training set and residuals are used to construct a second decision tree (Model 2), which further fits the residuals. Then, the training set and new residuals continue to construct a third decision tree (Model 3) to optimize model performance. The prediction results of all decision trees will be merged using a weighted method to obtain the final prediction result. Finally, the model is evaluated and optimized using the validation set, and the final prediction results are output.
The Support Vector Machine (SVM) algorithm is known for its excellent generalization ability and has been successfully applied to various classification tasks. The basic optimization objective formula of SVM is shown in Equation (8).
| (8) |
In Equation (8), represents the normal vector of the hyperplane, represents the distance displacement between the hyperplane and the origin, and represents the transposition of . and represent the eigenvectors and labels of the -th sample, respectively, with taking a value of 1 or 1. Equation (8) defines the optimization objective of a standard SVM to find the optimal classification hyperplane by minimizing the weight norm and relaxation variables. During the training process of SVM, there may be a problem of imbalanced positive and negative samples, resulting in classification results biased towards the class with more samples, which affects classification accuracy. To solve the problem of imbalanced traffic data for a few attack classes in the third layer of the model, the CS-SVM algorithm is proposed. This algorithm adjusts the misclassification cost of false positive and false negative examples by introducing two different penalty coefficients, as shown in Equation (9).
| (9) |
In Equation (9), and represent two different penalty coefficients, respectively. represents the mapping function of , mainly used to map to a high-dimensional feature space. represents the number of samples in the training data. and represent the sum of relaxation variables for positive and negative class samples, respectively. is the relaxation variable, . represents the distance is allowed to deviate from the hyperplane. Equation (9) improves standard SVM to CS-SVM. By assigning different penalty coefficients to different classes, the class imbalance problem is alleviated, such as the attack traffic is much less than the normal traffic. If is correctly classified and located outside the boundary of the correct side, then ; otherwise, the calculation formula for is shown in Equation (10).
| (10) |
In Equation (10), represents the position of on the hyperplane, which is the decision function value of . Equation (10) defines the calculation method of the relaxation variable, quantifies the classification error of the sample, and is used to adjust the classification boundary in the optimization process. The specific formula for is shown in Equation (11).
| (11) |
Equation (11) is a decision function of SVM, which is used to determine the final classification result. In the third layer of the SSICID model, the classification task of CS-SVM is to perform refined multi-class classification of the minority attack traffic passed from the second layer. These minority attacks generally include system-level attacks and insider threats, which are difficult to distinguish and have relatively small sample sizes. The CS-SVM layer receives a subset that has already been filtered by the first two layers. It operates by training multiple binary CS-SVM classifiers based on a one-to-many strategy, with each classifier specializing in identifying a specific minority attack type. Each classifier assigns different penalty coefficients to the current target attack type and other attack types. By increasing the penalty coefficient for the current target attack type, the importance given to minority attack samples is increased, thus learning a more accurate classification boundary in imbalanced subsets. For a new input sample, the decision functions of all binary classifiers are calculated, and the sample is assigned to the attack class with the largest function value. Finally, the output of this layer is the specific attack type label for each minority attack traffic. The regularization coefficients introduced in a binary classifier directly encode the cost or risk of misclassification for different classes. In the context of industrial control network security, the risk of misclassifying a minority of attacks as other classes is usually far higher than the risk of misclassifying other classes as a minority of attacks. Therefore, setting a higher penalty coefficient for minority attack classes means that the model will exert greater effort in the optimization objective to reduce the sum of slack variables associated with the misclassification of positive class samples, thereby securing a wider and safer classification boundary for minority attack classes in the feature space. The penalty coefficient set for the negative class controls the model’s tolerance for false positives. By adjusting the ratio of the penalty coefficients for positive and negative attack types, a quantitative trade-off in security strategy can be achieved. A higher ratio will make the model extremely sensitive, tending to classify more samples as minority attacks to reduce the risk of false negatives, while a lower ratio will make the model more conservative, prioritizing the reduction of the overall false positive rate. Therefore, these regularization coefficients are key to transforming domain security knowledge into optimizable parameters for the mathematical model. By combining Equations (8) to (11), the range of values for the relaxation variable in CS-SVM can be obtained, as shown in Figure 6.
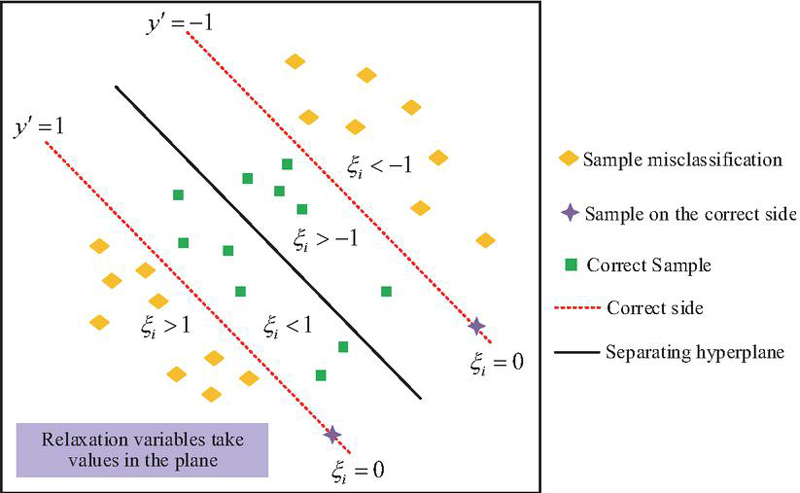
Figure 6 Range of values of relaxation variables in CS-SVM.
Figure 6 provides an example of the value of to illustrate the effectiveness of CS-SVM in dealing with classification imbalance problems. In Figure 6, there are two sample labels, and , which are classified using a black separated hyperplane. When is reached, the sample will be located on the correct side outside the decision boundary, such as the sample on the and lines in Figure 6. When , the sample is located on the correct side between the decision boundary and the interval boundary. When or , the samples are located on the wrong side of the decision boundary, as shown in the square outside the interval boundary in the figure, indicating that they have been misclassified. In the SSICID model, CS-SVM serves as the third layer, specifically designed to handle the few types of attack traffic identified by the first two layers, further refining the classification. Through this multi-level structure, the SSICID model can more effectively handle abnormal traffic in ICN, thereby improving the security and stability of the entire system.
4 Results
To demonstrate the performance and practical application effectiveness of the SSICID model, this study first tested the data dimensionality reduction algorithm SSAE and then designed ablation experiments to test the performance of each part of the SSICID model. Finally, it was demonstrated that the SSICID model has higher detection accuracy and faster System Response Time (SRT) in three different ICN environments.
4.1 SSPCA Benchmark Test Results and Ablation Experiments of SSICID Model
The publicly available ICS-CERT Dataset is selected as the experimental dataset, which includes various network traffic and attack data of ICS. The dataset is derived from the public ICS-CERT ICN traffic logs, including 2,153 normal traffic data, that is, normal control instructions and sensor feedback data without attack behavior. The number of attack traffic data is 7,847, which is subdivided into 3,310 network layer attacks (DDoS, port scanning), 1,898 system layer attacks (malicious code injection, permission promotion), and 2,639 internal threats (unauthorized access, data tampering). The original data are a CSV structured table. Each record contains 53 features, including timestamp, source/destination IP and port, protocol type, payload size, session duration, and exception flag bits. Data representation includes numerical features and categorical features. Numerical features are stored in the form of floating point numbers and processed by Z-score standardization. Class-type features are encoded into binary vectors. The pre-processed data are converted into a multi-channel two-dimensional matrix to simulate the image structure to adapt to the convolution operation of CS-CNN. The data preprocessing process is as follows: Firstly, the missing values are filled by K-nearest neighbor interpolation; Secondly, the numerical characteristics are standardized by Z-score; Thirdly, SMOTE oversampling technique is used to enhance the data of a few classes in view of the imbalance of the attack class. Then, the 53-dimensional features are compressed to 12-dimensional features by SSPCA algorithm and finally divided into training sets (7,000 pieces), verification sets (2,000 pieces), and test sets (1,000 pieces) according to a ratio of 7:2:1. The reason for choosing 12 dimensions as the final feature space is that, from the perspective of feature information preservation, 12 dimensions can fully cover the key features related to attack behavior in ICN traffic data. Adding dimensions later would result in mostly redundant information, offering limited practical help in attack detection. From the perspective of model performance balance, too low a dimension would lead to the loss of important attack-related features, making it impossible to effectively distinguish between normal traffic and abnormal attacks. Too high a dimension would introduce irrelevant noise and increase the computational complexity of subsequent detection models, affecting detection speed. Stratified sampling is adopted to ensure consistent category distribution. In the SSPCA algorithm, the sparsity constraint parameters are set to 0.1 and 0.05, which are determined by cross-validation to balance feature sparsity and dimensionality reduction stability. The mixture coefficient of the elastic network is 0.5, which is used to adjust the L1/L2 regularization intensity. In the SSICID model, the learning rate of CS-CNN is 0.001 and the class weight is 1:5 (normal: attack). XGBoost sets the tree depth to 6 and the learning rate to 0.3. The regularization coefficients of CS-SVM are 1.5 and 0.5, respectively. Enhanced-sensitivity to a small number of attacks is determined by grid search. The reconstruction errors of several dimensionality reduction algorithms obtained in four types of data are shown in Figure 7.
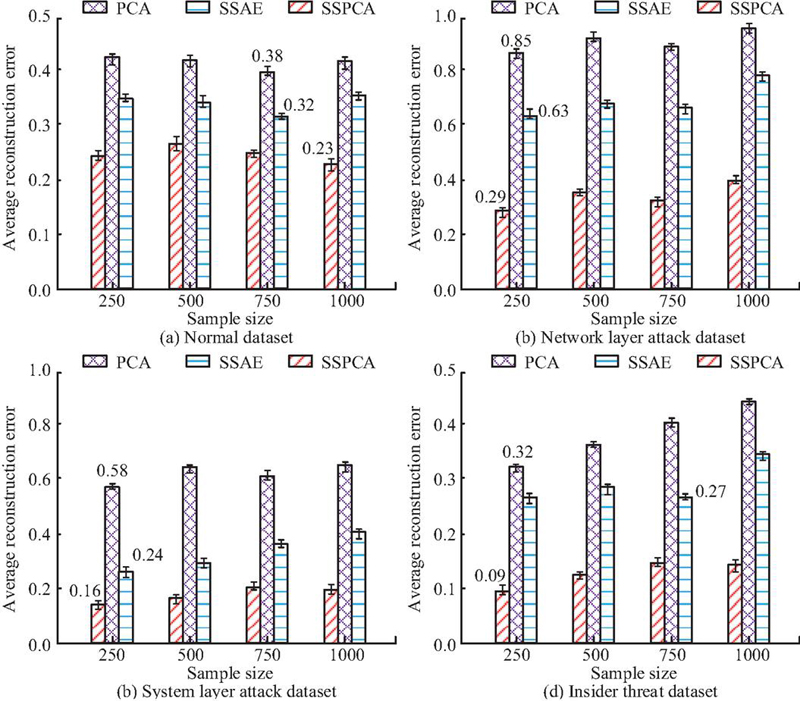
Figure 7 Average reconstruction error for different dimensionality reduction algorithms.
Figures 7(a) to 7(d) show the average reconstruction errors of PCA, SSAE, and SSPCA algorithms on normal datasets, network layer attack datasets, system layer attack datasets, and internal threat datasets, respectively. Based on Figure 7, the average reconstruction error value of SSPCA is the smallest in all four types of datasets, with the lowest being only 0.09, while the lowest average reconstruction error values of PCA and SSAE are as low as 0.32 and 0.24, respectively. SSPCA has the best error performance and can retain the most original information during the process of data deduplication. This demonstrates that SSPCA, through sparse constraints and stacking strategies, can more effectively remove redundant noise from high-dimensional data while retaining nonlinear feature relationships that are crucial for attack identification, providing high-quality, low-dimensional input features for subsequent classifiers. The Dimensionality Reduction Accuracy (DRA) and False Alarm Rate (FAR) of the three algorithms in the attack dataset are shown in Figure 8.
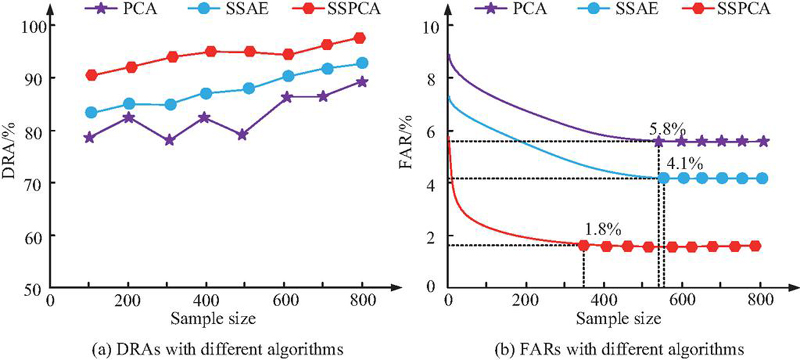
Figure 8 DRA and FAR of different reduction algorithms in the attack dataset.
Figures 8(a) and 8(b) show the DRA and FAR of PCA, SSAE, and SSPCA in the attack dataset, respectively. In Figure 8(a), compared to SSAE and SSPCA, the DRA of PCA fluctuates more. The highest DRA of PCA, SSAE, and SSPCA in the attack dataset can reach 87.6%, 90.8%, and 97.5%, respectively. This indicates that compared to PCA and SSAE, SSPCA can train the fastest to a stable FAR of only 1.8%, while the FAR of PCA and SSAE are 5.8% and 4.1%, respectively. Therefore, SSPCA performs better in both DRA and FAR during the training process. While compressing dimensionality, the core features that distinguish normal traffic from attack traffic are fully preserved, providing high-quality input data for subsequent detection models.
Considering that the SSICID model is obtained through data dimensionality reduction processing by SSPCA, followed by CS-CNN, XGBoost, and CS-SVM three-layer network structures, this study further conducts ablation testing on it, as shown in Table 2.
Table 2 Results of ablation experiments for the SSICID model
| Model | Precision | Recall | F1 Value |
| PCA+CNN | 0.83 | 0.81 | 0.82 |
| PCA+CNN+XGBoost | 0.85 | 0.83 | 0.84 |
| PCA+CNN+XGBoost+SVM | 0.88 | 0.87 | 0.88 |
| SSPCA+CS-CNN | 0.91 | 0.92 | 0.91 |
| SSPCA+CS-CNN+XGBoost | 0.95 | 0.93 | 0.94 |
| SSPCA+CS-CNN+XGBoost+CS-SVM (SSICID) | 0.98 | 0.97 | 0.97 |
Table 2 presents the ablation results of each part of the SSICID model. The final SSICID model has better detection precision, recall, and F1 value for attack data, reaching as high as 0.98, 0.97, and 0.97, respectively. Therefore, all the components that ultimately make up the SSICID model perform well. CNN, LSTM, and SVM-CNN are selected as comparison models, and the ROC curves of the four models are shown in Figure 9.
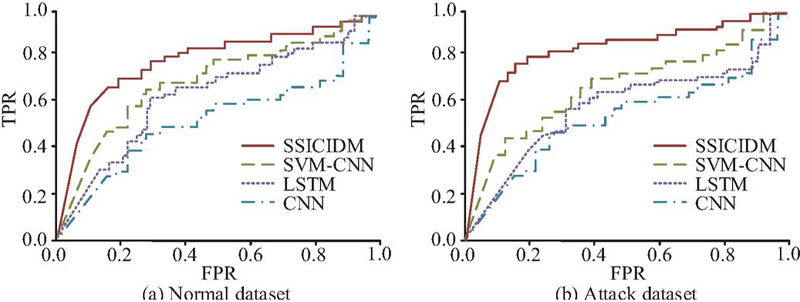
Figure 9 ROC curves for different models under normal and attack classes.
Figures 9(a) and 9(b) show the ROC curves of CNN, LSTM, SVM-CNN, and SSICID models on normal and attack datasets, respectively. The SSICID model has the highest AUC area on both normal and attack datasets, with values of 0.94 and 0.95, respectively. The AUC area of CNN is the smallest on both normal and attack datasets, with values of 0.78 and 0.75, respectively. In addition, the AUC areas of LSTM and SVM-CNN on normal datasets are 0.82 and 0.87, respectively, and on attack datasets are 0.81 and 0.85, respectively. The results above show that SSICID can achieve a higher recall rate at the same false positive rate. It can effectively distinguish between normal and attack traffic and adapt to the characteristic differences of different types of attacks.
4.2 The Practical Application Effect of SSICID Model
To demonstrate the application effect of the SSICID model in practical problems, this study selected three different ICN conditions for testing, namely pharmaceutical manufacturing, automotive manufacturing, and energy monitoring. The research test results were obtained on a test platform simulating a real ICN environment. The hardware configuration was Intel Xeon E5-2678v3 CPU (12 cores /24 threads), NVIDIA Tesla V100 GPU (32GB video memory) and 64GB DDR4 memory. The software environment was Ubuntu 20.04 LTS, Python 3.8, TensorFlow 2.6 and XGBoost 1.5. The test data were collected independently from ICS scenario datasets (1,000 pieces each for pharmaceutical, automotive, and energy). Each data was subjected to SSPCA dimension reduction and standardized pre-processing. Other processes were closed during the test to reduce interference. The model was developed based on PyCharm 2021.3 and Jupyter Lab environments, and the dependent library versions were fixed through Conda. Table 3 shows the detection accuracy and SRT of four models under three ICN conditions.
Table 3 Detection accuracy and SRT of different models under three ICN conditions
| Industrial Control | |||||
| Environment | Indicators | CNN | LSTM | SVM-CNN | SSICID |
| Pharmaceutical | Detection accuracy | 86.3% | 88.5% | 91.2% | 98.6% |
| manufacturing | System response time | 1.6s | 1.1s | 0.5s | 0.1s |
| Automotive | Detection accuracy | 85.9% | 89.1% | 90.5% | 98.2% |
| manufacturing | System response time | 1.8s | 1.4s | 0.8s | 0.4s |
| Energy monitoring | Detection accuracy | 86.5% | 88.9% | 91.4% | 98.8% |
| System response time | 1.5s | 0.9s | 0.6s | 0.2s |
In Table 3, the detection accuracy of the SSICID model under three ICN conditions is above 98%, with the highest reaching 98.8%. The highest detection accuracy of CNN, LSTM, and SVM-CNN under the three ICN conditions is 86.5%, 89.1%, and 91.4%, respectively. In addition, the SSICID model has a shorter SRT under the three ICN conditions, as low as 0.1 seconds, while the SRT of CNN, LSTM, and SVM-CNN are as low as 1.5 seconds, 0.9 seconds, and 0.5 seconds, respectively. This indicates that the SSPCA dimensionality reduction algorithm does not depend on the feature distribution of a specific scenario, can stably extract core information, and the hierarchical detection architecture can adapt to attack modes of different scenarios through multi-level models. The CPU consumption of ICN during the completion of a certain automotive manufacturing task using the four tested models is shown in Figure 10.
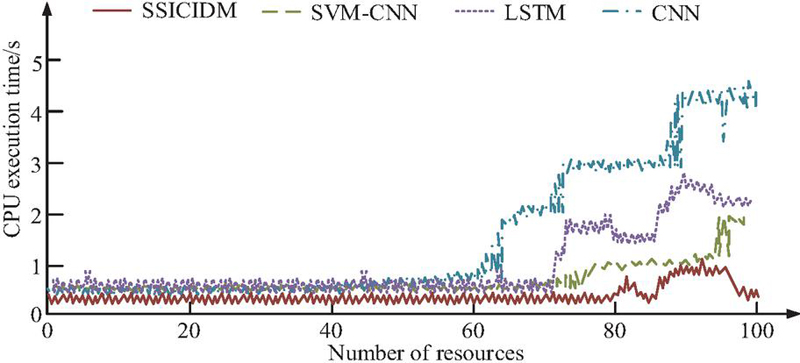
Figure 10 CPU consumption of different models in real applications.
In Figure 10, as the number of resources increases, the CPU execution time of each monitoring model shows an accelerating trend. When the number of resources reaches 100, the CPU time of CNN, LSTM, SVM-CNN, and SSICID models is 4.3 s, 2.5 s, 1.8 s, and 0.3 s, respectively. In summary, the SSICID model performs better in CPU execution time and has better monitoring performance in practical applications. This is mainly due to SSPCA compressing the data from 53 dimensions to 12 dimensions, which significantly reduces the computational load of subsequent complex models. At the same time, the hierarchical architecture avoids the overhead of a single complex model processing all data in a unified manner. To further verify the advanced nature of the proposed method, the research conducts a comparative analysis of related work methods. Specifically, it includes PCA+SVM model proposed in reference [8], Depth residual CNN model proposed in reference [9], Autoencoder + PCA model proposed in reference [10], and RNN + side channel analysis model proposed in reference [11], Feature selection + SVM model proposed in reference [12], and Optimization of CNN classifier model proposed in reference [13]. The specific comparison results are shown in Table 4.
Table 4 Performance comparison results of different models
| Detection | Recall | F1 Value | Response | |
| Method | Accuracy (%) | Rate (%) | (%) | Time (s) |
| PCA + SVM [8] | 87.6 | 82.3 | 84.9 | 1.2 |
| Depth residual CNN [9] | 94.3 | 89.1 | 91.6 | 1.8 |
| Autoencoder + PCA [10] | 91.5 | 85.7 | 88.4 | 0.9 |
| RNN + side channel analysis [11] | 92.0 | 88.5 | 90.2 | 2.1 |
| Feature selection + SVM [12] | 89.7 | 86.2 | 87.9 | 1.5 |
| Optimization of CNN classifier [13] | 93.5 | 90.8 | 92.1 | 0.5 |
| Research method | 98.8 | 97.0 | 97.0 | 0.3 |
Table 4 shows the performance comparison results between the research method and six existing models. The accuracy rate of the research method is 98.8%, the recall rate is 97.0%, the F1 value is 97.0%, and the response time is 0.3 s. Compared with deep residual CNN, SSICID improves accuracy by 4.5% and has a much higher recall rate than similar methods, which can more comprehensively capture attack traffic, especially with lower missing rates for a few types of attacks. In addition, the response time of SSICID is 40% faster than that of the Optimization of CNN classifier, mainly due to the parallel computation optimization of the SSPCA reduction and hierarchical detection architecture. SSICID performs well in high-dimensional data support, multi-stage attack detection, and class imbalance processing, making it the only model to improve on all three key capabilities.
5 Discussion
To improve the detection accuracy of traditional intrusion detection techniques, this study designed an ICN intrusion detection model, the SSICID model, that combines SSPCA with multi-layer network distribution detection and tested its performance. Compared with the X-IIoTID method proposed by Al Hawawreh et al. in reference [26], the X-IIoTID method mainly focuses on the independence of devices and connections. Although it performed well on diverse datasets, it had some shortcomings in handling high-dimensional data and complex network environments. This study, by combining SSPCA and CS-CNN, not only improved the accuracy of data dimensionality reduction but also enhanced its adaptability to complex network states. The experiment showed that the average reconstruction error of SSPCA was as low as 0.09, which was much smaller than PCA’s 0.32 and SSAE’s 0.24. In addition, SSPCA had the highest DRA (97.5%) and the lowest FAR (1.8%) on the attack dataset. Although the hybrid deep belief network proposed by Süzen in reference [18] exhibited high detection accuracy in multi-level intrusion detection, its complex structure might lead to reduced computational efficiency in large-scale ICNs. Relatively speaking, the SSICID model used in this study maintained high accuracy while achieving higher computational efficiency, thus demonstrating better practicality. The ablation test of the SSICID model revealed that the combination of SSPCA+CS-CNN+XGBoost+CS-SVM achieved the best detection accuracy, recall, and F1 value, with values of 0.98, 0.97, and 0.97, respectively. The core lied in its innovative integration of SSPCA and multi-level detection strategies. In addition, the SSICID model had the highest AUC area under the ROC curve, which was 0.94 and 0.95, respectively, far higher than the three comparative models of CNN, LSTM, and SVM-CNN. This was because SSPCA preserved important features in high-dimensional data dimensionality reduction, improving the efficiency and accuracy of data analysis, while the step-by-step detection strategy improved the accuracy and real-time performance of detection through multi-level analysis and classification. Secondly, the introduction of CS-CNN and XGBoost further optimized the detection process. Enabling the SSICID model to dynamically adjust classification strategies based on the current detection status effectively improved the accuracy and response speed of intrusion detection. In practical applications, the detection accuracy of the SSICID model in the three ICS environments of pharmaceutical manufacturing, automotive manufacturing, and energy monitoring was as high as 98.6%, 98.2%, and 98.8%, respectively. The SRT was as low as 0.1 s, 0.4 s, and 0.2 s, respectively. Finally, the CPU time of CNN, LSTM, SVM-CNN, and SSICID models in completing automotive manufacturing tasks was 4.3 s, 2.5 s, 1.8 s, and 0.3 s, respectively. Although the proposed SSICID model has demonstrated high detection accuracy and response speed in a variety of ICN environments, there are still some potential limitations and situational factors. For example, in extreme attack scenarios, the model may face problems such as insufficient feature extraction or training data that does not represent the actual scene, or the emergence of new, invisible attack types that can affect detection performance. In addition, since the model relies on previously collected features and data, poor quality input data or the presence of severe noise can affect its performance. In addition, although the hierarchical structure of the SSICID model improves classification and detection capabilities, its complexity may not perform well in the case of limited computing resources or high real-time requirements.
In summary, this study proposes an efficient and accurate ICN intrusion detection model by combining SSPCA and SSICID strategies. This not only provides new ideas and technical means for future ICN security monitoring and management but also has a positive impact on improving the overall security of ICS.
6 Conclusion
To improve the detection performance of ICS for abnormal traffic attacks, this study combined SSPCA, CS-CNN, XGBoost, and CS-SVM to build an SSICID model. Research results showed that the model significantly improved the detection performance of abnormal traffic attacks. The ablation test showed that the model showed the best performance in detection accuracy, recall, and F1 value. At the same time, the AUC area under the ROC curve was the largest, surpassing the three comparative models of CNN, LSTM, and SVM-CNN. In practical applications, the SSICID model has demonstrated high detection accuracy and low SRT in ICS environments such as pharmaceutical manufacturing, automotive manufacturing, and energy monitoring. In summary, the model achieves low loss dimensionality reduction of high-dimensional data through SSPCA algorithm, and combined with a hierarchical detection architecture, improves multi-stage attack recognition capability. Through a cost sensitive mechanism, category imbalance has been effectively alleviated, model response speed has been improved, and industrial real-time requirements have been met. While the proposed SSICID model exhibits excellent attack detection performance, some limitations remain. The model’s detection efficiency heavily relies on the attack patterns covered by the training data; its detection capability may significantly decrease for novel attack strategies not present in the training data. Although the hierarchical detection architecture improves accuracy, the multi-level model cascading inference introduces accumulated latency and resource consumption, posing challenges for real-time deployment on resource-constrained industrial edge devices. Several hyperparameters in the model require fine-tuning for specific scenarios, and its automated and adaptive adjustment mechanisms are not yet fully developed, increasing the engineering costs of practical deployment. Therefore, future research will explore few-shot learning, semi-supervised, or unsupervised anomaly detection strategies, utilizing normal traffic modeling or contrastive learning to identify attacks deviating from normal patterns, thereby reducing reliance on large-scale labeled attack data and improving the ability to detect zero-day attacks. Further research will focus on knowledge distillation, structured pruning, or designing compact hierarchical detection architectures specifically for edge devices to achieve a better balance between accuracy and efficiency. Develop adaptive or meta-learning optimization frameworks to enable automatic configuration and online adjustment of key hyperparameters of the model based on different ICN environments and traffic characteristics, thereby improving the ease of use and adaptability of the method. Simultaneously, by combining privacy-preserving computing technologies such as federated learning, collaborative training and secure knowledge sharing across multiple data sources are achieved while ensuring data privacy in various industrial settings. This systematically enhances the model’s generalization detection capabilities against diverse industrial control protocols and complex attack scenarios.
Conflicts of Interest
The author declares that there is no conflicts of interest.
References
[1] Zhang M, Li G, Xu L, Bai J, Xu M, Gu G, Wu J. Control plane reflection attacks and defenses in software-defined networks. IEEE/ACM Transactions on Networking, 2020, 29(2): 623–636.
[2] Rajesh Kanna P, Santhi P. Exploring the landscape of network security: a comparative analysis of attack detection strategies. Journal of Ambient Intelligence and Humanized Computing, 2024, 15(8), 3211–3228.
[3] Koay A M Y, Ko R K L, Hettema H, Radke K. Machine learning in industrial control system (ICS) security: current landscape, opportunities and challenges. Journal of Intelligent Information Systems, 2023, 60(2): 377–405.
[4] Udas P B, Karim M E, Roy K S. SPIDER: A shallow PCA based network intrusion detection system with enhanced recurrent neural networks. Journal of King Saud University-Computer and Information Sciences, 2022, 34(10), 10246–10272.
[5] Saminu S, Xu G, Zhang S, Kader IAE, Aliyu HA, Jabire AH, Ahmed YK, Adamu MJ. Applications of Artificial Intelligence in Automatic Detection of Epileptic Seizures Using EEG Signals: A Review. Artificial Intelligence and Applications, 2023,1(1): 11–25.
[6] Zhu, Z. and Zhou, L. 2025. Application of Complex Network Attack and Defense Time Game Model in Network Security Defense Decision. Journal of Cyber Security and Mobility. 14, 02 (Jun. 2025), 311–338. DOI: https://doi.org/10.13052/jcsm2245-1439.1423.
[7] Abid A, Jemili F, Korbaa O. Real-time data fusion for intrusion detection in industrial control systems based on cloud computing and big data techniques. Cluster Computing, 2024, 27(2): 2217–2238.
[8] Ahakonye L A C, Nwakanma C I, Lee J M, Kim D S. Agnostic CH-DT technique for SCADA network high-dimensional data-aware intrusion detection system. IEEE Internet of Things Journal, 2023, 10(12): 10344–10356.
[9] Wang W, Wang Z, Zhou Z, Deng H, Zhao W, Wang C, Guo Y. Anomaly detection of industrial control systems based on transfer learning. Tsinghua Science and Technology, 2021, 26(6): 821–832.
[10] Kravchik M, Shabtai A. Efficient cyber attack detection in industrial control systems using lightweight neural networks and pca. IEEE transactions on dependable and secure computing, 2021, 19(4): 2179–2197.
[11] Ahmed A A, Hasan M K, Alqahtani A, Islam S, Pandey B, Rzayeva L, et al. Deep Learning Based Side-Channel Attack Detection for Mobile Devices Security in 5G Networks. Tsinghua Science and Technology, 2025, 30(3):1012–1026.
[12] Mimura M, Kurashina K. Practical evasion attack against neural network-based macro-malware detection method. Cluster Computing, 2025, 28(2):1–16.
[13] Desai A A, Patil P B. Detection of primary user emulation attack using the share and hunt optimisation based deep CNN classifier. International Journal of Autonomous and Adaptive Communications Systems, 2025, 18(1):23–44.
[14] Gu H, Lai Y, Wang Y, Liu J, Sun M, Mao B. DEIDS: a novel intrusion detection system for industrial control systems. Neural Computing and Applications, 2022, 34(12): 9793–9811.
[15] Zhang B, Shi Y, Zhao J, Wang T, Wang K. A Novel Deep Learning Representation for Industrial Control System Data. Intelligent Automation & Soft Computing, 2023, 36(3): 2703–2717.
[16] Han X, Peng J, Cui A, Zhao F, Li K. A General Null Space Property for Sparse Principal Component Analysis. Circuits, Systems, and Signal Processing, 2022, 41(8): 4570–4580.
[17] Kwon O R, Lu Z, Zou H. Exactly Uncorrelated Sparse Principal Component Analysis. Journal of Computational and Graphical Statistics, 2024, 33(1): 231–241.
[18] Süzen A A. Developing a multi-level intrusion detection system using hybrid-DBN. Journal of Ambient Intelligence and Humanized Computing, 2021, 12(2): 1913–1923.
[19] Cao J, He H, Zhang Y, Zhao W, Yan Z, Zhu H. Crack detection in ultrahigh-performance concrete using robust principal component analysis and characteristic evaluation in the frequency domain. Structural Health Monitoring, 2024, 23(2): 1013–1024.
[20] Fang K, Ren R, Zhang Q, Ma S. iSFun: an R package for integrative dimension reduction analysis. Bioinformatics, 2022, 38(11): 3134–3135.
[21] Singh D, Biswal A K, Samanta D, Singh D, Lee H N. Juice jacking: Security issues and improvements in USB technology. Sustainability, 2022, 14(2), 939.
[22] Beattie J R, Esmonde-White F W L. Exploration of principal component analysis: deriving principal component analysis visually using spectra. Applied Spectroscopy, 2021, 75(4): 361–375.
[23] Craig H. Principal components analysis in stylometry. Digital Scholarship in the Humanities, 2024, 39(1): 97–108.
[24] Yang H, Zhang Z, Xie L, Zhang L. Network security situation assessment with network attack behavior classification. International Journal of Intelligent Systems, 2022, 37(10): 6909–6927.
[25] Dai Q, Zhang B, Xu K, Dong S. An Erebus Attack Detection Method Oriented to Blockchain Network Layer. Computers, Materials & Continua, 2023, 75(3): 5395–5431.
[26] Al-Hawawreh M, Sitnikova E, Aboutorab N. X-IIoTID: A connectivity-agnostic and device-agnostic intrusion data set for industrial Internet of Things. IEEE Internet of Things Journal, 2021, 9(5): 3962–3977.
Biography

Rui Huang graduated from Sichuan Normal University in 1996. Currently, he serves as the director and engineer at the Industrial and Industrial Park Development Promotion Center in Dazhou City, Sichuan Province. He has participated in the construction of national, provincial, and municipal industrial information system network platforms; Developed an industrial information data analysis system. He also published articles in municipal level research projects. His areas of interest include network and data security, data analysis and statistics, and graphic recognition.
Journal of Cyber Security and Mobility, Vol. 15_2, 335–364
doi: 10.13052/jcsm2245-1439.1523
© 2026 River Publishers