Network Security Situation Analysis and Forecasting System Based on Probability Neural Network
Bo Hong1, Xindi Ying1, Chuanfeng Lin1, Yuwei Xie1 and Xuesong Liu2*
1Information Technology Center, Zhejiang University, Hangzhou 310058, China
2College of Biomedical Engineering & Instrumentation Science, Zhejiang University, Hangzhou 310058, China
E-mail: liuxuesonng@outlook.com
*Corresponding Author
Received 25 November 2025; Accepted 29 December 2025
Abstract
This paper proposes a network security situation analysis and forecasting system to address the limits of current technologies in uncertainty measurement, multi-source data fusion, and long-sequence dependency modeling. The system uses a Genetic Algorithm to optimize the smoothing parameter and the feature weight of the Probability Neural Network to complete the situation assessment. It also uses a self-attention mechanism to enhance the gated recurrent unit’s temporal modeling ability to complete situation prediction. Experiments were conducted on the CIC-IoMT-2024 benchmark dataset, which includes multiple attack types, including DDoS, brute-force, and command-injection attacks, with comparisons against various state-of-the-art algorithms. Experiments show that the system achieves 96.78% accuracy, 95.02% detection rate, and 3.81% false alarm rate in the assessment task. In the prediction task, the mean absolute error stays below 0.0241, the root mean square error stays below 0.0603, and the coefficient of variation stays below 0.085. Compared with various state-of-the-art models, such as the support vector machine integrated with principal component analysis, the proposed integrated system achieves significant improvements in core metrics, including assessment accuracy and prediction error. These results show that the system keeps high precision, high stability, and strong generalization ability in both assessment and prediction. It offers an effective integrated solution to the limitations of current network security situation technologies. More importantly, this work bridges the gap between high-precision real-time assessment and reliable proactive forecasting in a unified framework. The demonstrated capability for accurate early warning of evolving cyber threats provides a practical pathway to building more intelligent, autonomous active defense systems, which are crucial for safeguarding critical infrastructure in the era of IoT and 5G.
Keywords: Probability neural network, network security situation, self-attention, gated recurrent unit, assessment and prediction.
1 Introduction
1.1 Research Background
With the acceleration of digital transformation, emerging technologies such as cloud computing, the Internet of Things, and 5G are profoundly reshaping the architecture and boundaries of cyberspace [1]. These technologies have led to an exponential growth in the scale of network data, rendering data sources and formats highly heterogeneous, and significantly increasing the complexity of cross-domain security information fusion [2]. Meanwhile, cyberattack techniques continue to evolve, exhibiting new characteristics such as cross-domain coordination, dynamic evasion, and persistent infiltration [3]. Traditional security defense systems that rely on signature-based matching and rule-based reasoning generally lack sufficient early warning capabilities against advanced persistent threats, creating an urgent need for efficient, accurate network security situation analysis and forecasting methods to support decision-making for network administrators and enable proactive defense [4]. Cybersecurity situation describes the overall security status of a network, which is usually quantified as a single situation value through the comprehensive calculation of multi-dimensional indicators such as attack severity and frequency [5]. However, traditional network security situation analysis and forecasting depend on the accuracy of historical situation values, and there are biases in the correlation and weight of various network security factors. A Probabilistic Neural Network (PNN) offers fast training speed and high classification accuracy. It can effectively handle the inherent uncertainty in network security, providing a new solution path for network security situation assessment [6, 7]. At the same time, the Gated Recurrent Unit (GRU), with its gating mechanism, can effectively capture long-term dependencies in time series and construct the required temporal model for predicting network security situations [8].
1.2 Related Works
Current research on network security situation analysis and forecasting has formed multi-level technical approaches. In attack detection, Dora V R S and Lakshmi V N proposed an ensemble learning model with a hybrid optimization algorithm. The model first extracted deep features using deep belief networks and autoencoders, then performed feature fusion with an adaptive sonic-speed-based Jaya sea lion optimization algorithm, and finally performed attack detection using an improved ensemble learning method. Finally, experiments validated that the framework achieved high detection efficiency [9]. In the field of situation prediction, Sun J et al. proposed a combined prediction model based on a temporal convolutional attention network and a bidirectional GRU network. They removed noise from network security situation data through singular spectrum analysis, extracted features using temporal convolutional networks, and optimized hyperparameters using an improved quantum particle swarm algorithm. The results showed that the prediction model achieved a coefficient of determination of 0.999 [10]. Due to the limited accuracy of existing methods for network threat assessment and prediction, Guo X et al. proposed a defensive stochastic game model. They established an access relationship network for threat propagation based on propagation patterns and determined the optimal protection strategy by solving the model’s mixed-strategy Nash equilibrium. Experimental validation demonstrated that the model could improve prediction accuracy [11]. In time series prediction, Ya-Xing W U and Zhao D M constructed actual situation values for network datasets and introduced sliding windows for reconstruction. They proposed a bidirectional long short-term memory prediction model based on improved particle swarm optimization attention, and the results showed that the model achieved a fitting value of 0.8822 [12]. Furthermore, to compensate for the deficiencies of traditional defense in data-driven approaches, Alharbi F and Kashyap G S innovatively developed a visualized assessment of malware features and behavior patterns by quantitatively analyzing host system metrics and network interaction logs. The research showed that this method could significantly enhance network security [13].
PNN has excellent pattern classification capability and can be applied to intelligent recognition tasks in many fields. For example, in speech emotion recognition, Deshmukh S and Gupta P studied two primary speech features: pitch and frequency. They conducted training and testing of PNN using two public speech emotion databases. The classification accuracy reached 95.76% [14]. In oil exploration, Shakir U et al. used PNN in multi-attribute seismic inversion and geostatistics. Applying PNN combined with geostatistical methods quantitatively estimated changes in shale content and porosity in sandstone reservoirs, and the inversion results based on PNN could reasonably identify the distribution of gas-bearing layers [15]. In the context of smart agriculture, Kadum et al. proposed a PNN-based method for early detection of plant diseases. By processing and extracting image features such as color, texture, and shape, they achieved intelligent diagnosis of pepper fruit diseases [16]. Meanwhile, GRU, with its strong ability to capture temporal information, has demonstrated significant advantages in sequence data analysis across various fields. Mohsen applied GRU to human activity classification tasks and trained the model in TensorFlow using hyperparameter tuning. The results showed that the GRU algorithm achieved a test accuracy of 97.08% with a test loss rate of 0.221 [17]. To address the problems of low information extraction efficiency and insufficient accuracy in thermal barrier coating detection, Cao B et al. proposed a hybrid model based on a Convolutional Neural Network and GRU. They adaptively extracted features using one-dimensional convolution, constructed a GRU to learn temporal information from feature vectors, and employed calibration strategies for peak localization. The results showed that the model’s predictive performance was superior to that of other methods [18].
1.3 Research Purpose and Innovation
Although existing research has made significant progress, there is still room for optimization in the construction of network security situation analysis and forecasting systems. Examples include the inability of the assessment phase to effectively measure the inherent uncertainties of network security, the lack of a deep fusion mechanism for multi-source heterogeneous data, and the insufficient modeling capability of the prediction phase for long-term temporal dependencies and key risk segments. Moreover, the performance of standard PNNs for assessment is constrained by the empirical selection of smoothing parameters and low efficiency in processing high-dimensional features, while standard GRUs for prediction struggle to distinguish and enhance critical risk features in long sequences. Therefore, this study utilizes the advantages of PNN in pattern classification and probability output to assess network security situations, while combining the global optimization capability of Genetic Algorithm (GA) to automatically optimize PNN’s smoothing parameters and feature weights, addressing the difficulties in uncertainty measurement and insufficient assessment accuracy in network security situation assessment. At the same time, a Self-Attention (SA) mechanism is introduced into the GRU structure for situation prediction. Ultimately, a network security situation analysis and forecasting system is constructed, which is expected to enhance the accuracy and foresight of network security situation awareness.
The innovation of this study lies in constructing an integrated cybersecurity situation awareness framework featuring “evaluation algorithm optimization-prediction model integration-system collaborative closed-loop”. Firstly, it optimizes the core parameters of PNN in a targeted manner via GA, addressing the bottlenecks of traditional PNN, such as the lack of unified standards for smoothing parameter selection and the low processing efficiency of high-dimensional data. Combined with the normalization of multi-source heterogeneous data and the quantization of five-level security grades, it achieves more accurate situation evaluation. Secondly, it innovatively integrates the SA mechanism with GRU. By strengthening the focus on key segments in time series through the SA layer, it compensates for the traditional GRU’s deficiency in modeling global dependencies. It improves the prediction accuracy of the evolution of situations. Finally, it establishes a full-process closed-loop system covering multi-source data collection, situation awareness, GA-PNN-based evaluation, and SA-GRU-based prediction. With a high-precision preliminary evaluation providing standardized, high-quality input for subsequent prediction, the system establishes a collaborative linkage between accurate perception of current situations and reliable prediction of future trends, thereby significantly enhancing the initiative and foresight in cybersecurity protection.
Based on the objectives and innovative ideas, the subsequent sections of this study will elaborate on the design and construction of the GA-PNN assessment algorithm and the SA-GRU prediction model, and on how the two components are integrated into a complete system. Next, comprehensive experiments will be conducted to verify the overall performance of the proposed system. Finally, this study will summarize the full text and present an outlook on future work.
2 Construction of the Network Security Situation Analysis and Forecasting System
2.1 Design of the PNN-based Situation Assessment Algorithm
To complete the network security situation assessment, the system first needs to quantify the network state [19]. The manuscript uses the CIC-IDS intrusion detection dataset from the Canadian Cybersecurity Institute to classify network threats and attack states. It computes the network security situation value from the network attack data, shown in Equation (1) [20].
| (1) |
In Equation (1), is the situation value of the -th host, is the attack category, and is the number of attacks. The system assigns a security level based on the situation value of each network security state, as shown in Figure 1.
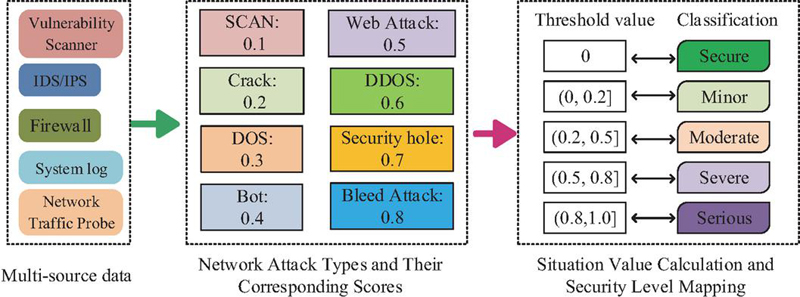
Figure 1 Network security level classification diagram.
In Figure 1, the system first integrates multi-source heterogeneous data from the firewall, the vulnerability scanner, the system log, and the network traffic probe. It then computes each host’s situation value and normalizes it. The processing method is shown in Equation (2) [21].
| (2) |
In Equation (2), is the security weight of the -th host. Based on the normalized situation value, the system divides the network security state into five categories: safe, mild threat, general threat, moderate threat, and severe threat. To map these five states to feature vectors, the system processes them through PNN. The main advantage is that the pattern layer reduces the training times by adding new samples, and the Bayesian optimal classifier completes the decision. PNN also has strong parallel processing capabilities. The process is shown in Figure 2 [22].
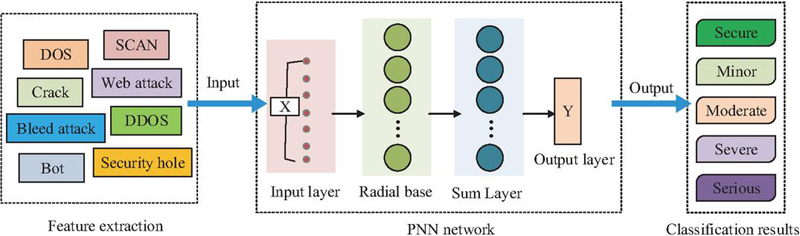
Figure 2 PNN-based network security situation assessment process.
As shown in Figure 2, PNN works as a classifier in the network security situation assessment. Before the assessment, the system extracts features describing the network security state from raw security data. It then inputs the processed multi-source security features into the PNN. The summation layer computes the probability density function, and the output layer assigns a class label to each category. The radial basis layer is computed as shown in Equation (3).
| (3) |
In Equation (3), is the smoothing parameter, is the input sample, and is the sample attribute. After summing , the system computes the error function between the output value and the actual value, as shown in Equation (4) [23].
| (4) |
In Equation (4), is the sample size of pattern , is the solving method of each pattern, is the PNN discrimination output, is the error function, is the real value, is the output value, and is the test number. The system optimizes the parameters through and obtains the assessment model. The PNN’s probability output provides confidence in the decision. However, the smoothing parameter has no fixed standard, and the high-dimensional input causes high computation cost and low classification efficiency. GA searches for the optimal value of in a fixed range to improve the classification performance of PNN [24].
Therefore, PNN is further optimized via GA, with the core of optimization focusing on the simultaneous automatic tuning of two key PNN components: the smoothing parameter and the input feature weight vector . Specifically, the parameter set to be optimized is encoded as a chromosome individual in GA. This joint optimization enables GA to identify the optimal value for the current data distribution, thus avoiding the blindness of manual parameter tuning. It also allows GA to automatically learn through evolution, assign higher weights to important features, and suppress interference from redundant or noisy features, thereby essentially improving the classification accuracy and efficiency of PNN in processing high-dimensional heterogeneous cybersecurity data. A GA-PNN situation assessment algorithm is thus constructed, with the optimization objective defined as the PNN classification accuracy on the validation set, directly driving the evolution toward maximum assessment accuracy. The fitness function comes from , shown in Equation (5) [25].
| (5) |
In Equation (5), is the fitness function. is the fitness value of the individual . The system then computes the individual’s evolution probability, as shown in Equation (6) [25].
| (6) |
In Equation (6), is the probability that the individual is selected for evolution when GA builds the population. The variation probability of the individual is shown in Equation (7) [25].
| (7) |
In Equation (7), is the mean fitness of the individuals. is the fitness of the mutated individual. is the maximum mutation probability, set to 0.9. is the minimum mutation probability, set to 0.1. Similarly, the crossover probability for individuals is given by Equation (8) [25].
| (8) |
In Equation (8), is the crossover fitness of the individual. equals 0.09, and equals 0.01. When the assessment accuracy meets the expected standard, GA-PNN stops evolution. The GA-PNN assessment process is shown in Figure 3.
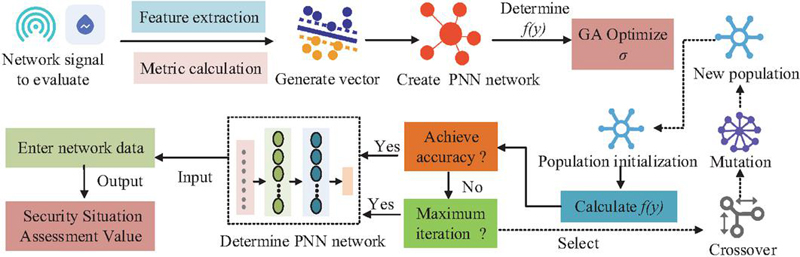
Figure 3 GA-PNN-based network security situation assessment process.
As shown in Figure 3, the GA-PNN system first preprocesses the network traffic signal to extract the features and vectorize them. It then selects the fitness function and uses GA to optimize the parameter of PNN. After initializing the GA population, the system completes the GA iteration, computes the fitness value of all individuals, and checks the assessment accuracy. If the accuracy does not meet the requirement, the system continues crossover and mutation to create new individuals and iterates again until the accuracy meets the target. The system then inputs the network data into GA-PNN and outputs the situation assessment value.
2.2 Construction of the SA-GRU-based Network Security Situation Prediction Model
Based on the network security situational assessment sequence output by GA-PNN, the sequence provides temporal data for dynamic prediction of future situational trends. To extract temporal patterns from the situational sequence, the study uses GRU as the basic prediction model because it effectively captures short-term dependencies. However, conventional GRU struggles to model global dependencies effectively. Self-attention enhances GRUs by computing cross-time-step correlations, enabling them to focus on critical segments [26]. Based on this, the study integrates the advantages of SA and GRU to construct an SA-GRU model that extracts temporal features of network security situations. The model takes as input the standardized situation value time series output by the GA-PNN module. Specifically, one normalized situation value is generated per evaluation cycle and arranged chronologically to form a continuous sequence. The SA-GRU model uses the historical sequence of the previous L time steps as input and outputs situation value predictions for the next K time steps. With this sliding window and rolling prediction mechanism, the system enables continuous advanced perception and early warning of future security risks. The structure capturing temporal correlations in SA-GRU is shown in Figure 4.
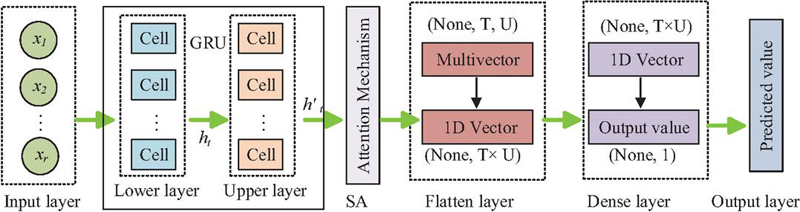
Figure 4 SA-GRU structural diagram.
As shown in Figure 4, SA-GRU consists of five modules. The input layer receives multi-dimensional features. The GRU layer performs preliminary temporal feature extraction and passes the features to the SA layer, which assigns dynamic weights and highlights critical segments for prediction. The flatten layer converts processed multi-dimensional vectors into one-dimensional vectors. The fully connected layer applies a nonlinear transformation and outputs the predicted value [19]. The attention score calculated by SA is shown in Equation (9) [27].
| (9) |
In Equation (9), and represent the query and key projection matrices, respectively. and are intermediate vectors for attention score computation. denotes the dot product operation, and represents elements of the input sequence. The self-attention output is expressed in Equation (10) [27].
| (10) |
in Equation (10) is the value projection matrix. GRU extracts features through its dual-gate structure of update and reset gates, as shown in Equation (11) [28].
| (11) |
In Equation (11), denotes the reset gate, is its weight matrix, is the bias, represents the activation function, is the input vector at time , indicates matrix multiplication, and is the hidden state at time . The candidate’s hidden state at time is shown in Equation (12) [28].
| (12) |
In Equation (12), represents the candidate hidden state, is the weight matrix, and is the bias. The update gate is expressed in Equation (13) [28].
| (13) |
In Equation (13), denotes the update gate, represents its weight matrix, and is the bias. The hidden state at a given time is obtained by Equation (14) [28].
| (14) |
in Equation (14) denotes the hidden state at time , which integrates information from the update gate, reset gate, and self-attention mechanism. This forms the core computation of the SA-GRU model [29]. Based on this, the study uses SA-GRU’s ability to dynamically weight key features and capture long-term dependencies to accurately predict the evolution trend of network security situations. The prediction process is shown in Figure 5.
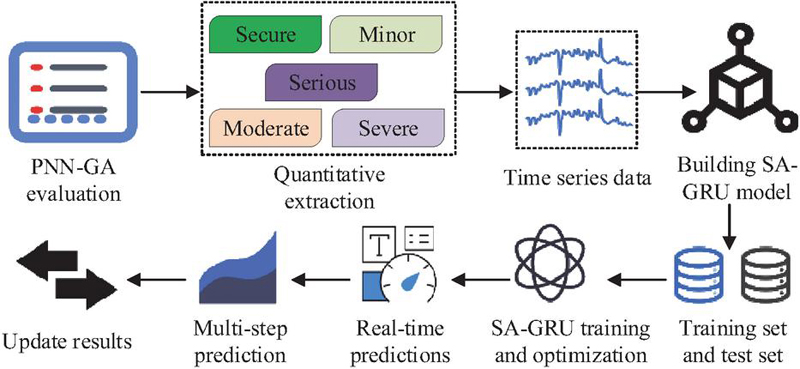
Figure 5 SA-GRU security situation evolution prediction process.
As shown in Figure 5, after GA-PNN completes the network security situational assessment, situational levels are quantified, and relevant features are selected to construct a continuous time series. The series is split into training and validation sets, and the validation set is used to train the SA-GRU model for prediction. The time series first enters the GRU lower layer of SA-GRU. After lower-layer output, the upper layer further extracts temporal features. Processed temporal features are then fed into the SA layer to compute the query, value, and key matrices, as shown in Equation (15) [30].
| (15) |
In Equation (15), represents the time series output from the GRU layer. Using , , and , the final SA score is obtained as shown in Equation (16) [30].
| (16) |
in Equation (16) represents the key dimension. The SA score strengthens attention to critical situational nodes and outputs predicted network security situations for the next one to three periods, mapping the results back to the level labels. High-quality, standardized input sequences provided by GA-PNN enable SA-GRU to learn reliable patterns of situational evolution accurately. To achieve integrated dynamic awareness, precise assessment, and proactive prediction of network security situations, the study designs a system combining GA-PNN assessment and SA-GRU prediction, as shown in Figure 6.
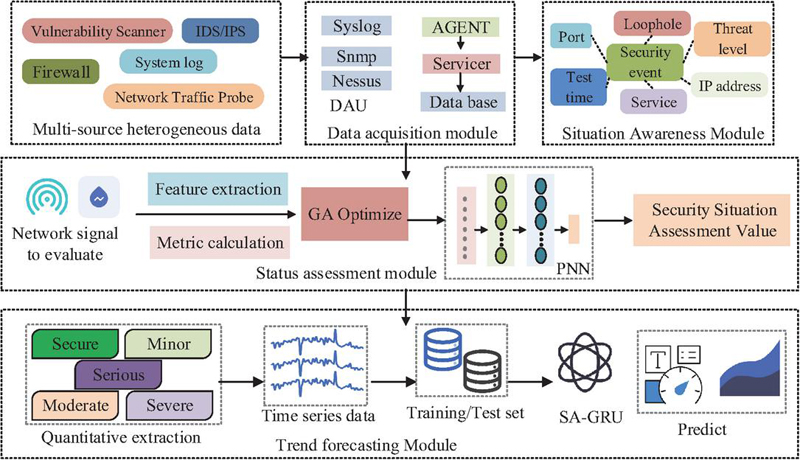
Figure 6 Operational process of the cybersecurity situation assessment and prediction system.
In Figure 6, the network security situational assessment and prediction system consists of four modules: data collection, situational awareness, situational assessment, and situational prediction. The data collection module uses Syslog, Snmp, and Nessus collectors to gather multi-source heterogeneous data and build a database. The situational awareness module analyzes the relationships between security events and features such as ports, detection times, threat levels, and device IP addresses to achieve multidimensional awareness of the current network security state. Then, network signals from the database are input into the GA-PNN assessment module for feature extraction and metric calculation. Finally, the network security situational assessment values are input into the SA-GRU prediction module to output future situational predictions.
3 Performance Analysis of the Network Security Situation Analysis and Forecasting System
3.1 Performance Verification of the GA-PNN-based Assessment Module
To verify the core performance of the network security situation analysis and forecasting system, the study first tested the GA-PNN situation assessment module. The experiment used the CIC-IoMT-2024 dataset released by the Canadian Institute for Cybersecurity in 2024. This dataset contained multiple typical network attack patterns, including Distributed Denial of Service (DDoS), Brute Force Attack (BF), Command Injection Attack (CSS), and Denial of Service (DoS). The experiment used an Intel Core i7-12700H processor, a NVIDIA GeForce RTX 3060 graphics card, 32 GB of DDR4 memory, and built the network security situation analysis and forecasting system on Windows 10. To verify the accuracy of GA-PNN assessment in the network security situation analysis and forecasting system, the study selected precision and recall metrics for validation and compared them with Principal Component Analysis-based Support Vector Machine (PCA-SVM), Random Forest-based eXtreme Gradient Boosting (RF-XGBoost), and Convolutional Block Attention Module-based Temporal Convolutional Network (CBAM-TCN) algorithms. The results are shown in Figure 7.
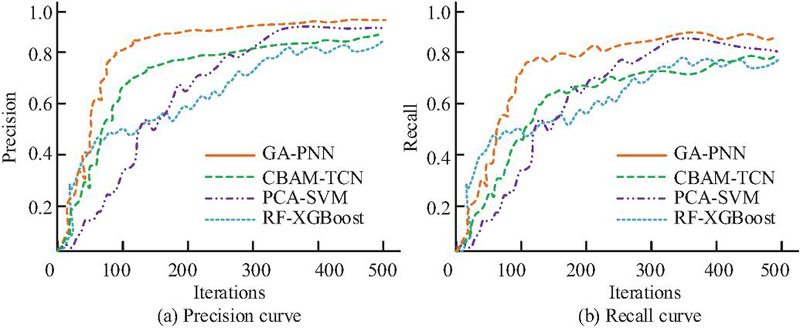
Figure 7 Comparison of precision and recall.
As shown in Figure 7, GA-PNN achieved superior overall precision and recall compared to the comparison algorithms. In Figure 7(a), GA-PNN showed the fastest improvement in precision during the iteration process, stabilizing above 0.853 after 121 iterations, with the highest final value reaching 0.956. The overall precision of CBAM-TCN, PCA-SVM, and RF-XGBoost algorithms remained consistently lower than that of GA-PNN, indicating that the GA-PNN algorithm achieved optimal precision in identifying network security situations. In Figure 7(b), the recall of GA-PNN also rose the fastest, reaching a final value of 0.892 at 500 iterations, while the final recall values of CBAM-TCN, PCA-SVM, and RF-XGBoost algorithms were 0.799, 0.801, and 0.791, respectively. This demonstrated that GA-PNN could capture actual risks to the greatest extent. To verify the GA-PNN’s recognition capability for network threats, the study used the Detection Rate (DR) and False Detection Rate (FDR) metrics for validation. Meanwhile, to evaluate the classification performance of GA-PNN for network attack types, the study also used accuracy and F1 score for verification. The comparison results of different algorithms are shown in Figure 8.
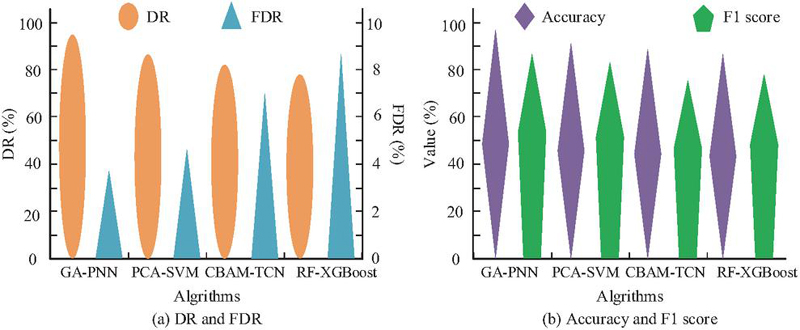
Figure 8 Classification performance comparison results.
As shown in Figure 8(a), the detection rate of GA-PNN reached 95.02%, significantly outperforming CBAM-TCN, PCA-SVM, and RF-XGBoost. This showed that it had the lowest false-negative rate for actual network threats and the widest recognition coverage. Meanwhile, the false detection rate of GA-PNN remained extremely low at 3.81%, well below that of the comparison algorithms. This indicated that GA-PNN had extremely high credibility in determining various types of network threats or attack types. In Figure 8(b), the accuracy and F1 score of GA-PNN were 96.78% and 86.92%, respectively, while the accuracy of PCA-SVM, CBAM-TCN, and RF-XGBoost were 90.12%, 88.91%, and 86.72%, respectively, with F1 scores of 81.78%, 74.53%, and 78.37%. The above results indicate that, compared with mainstream methods such as PCA-SVM, RF-XGBoost, and CBAM-TCN, the GA-PNN evaluation module exhibits significant advantages in both core metrics (including accuracy and detection rate) and practical metrics (such as false alarm rate), thus providing a more optimal solution for achieving highly reliable real-time situation assessment. To more intuitively compare the assessment performance of each algorithm on fine-grained samples, the study defined five-level situation labels: “Safe-1, Mild Threat-2, Moderate Threat-3, Severe Threat-4, Critical Threat-5”. The assessment results of each algorithm on 40 consecutive samples are shown in Figure 9.
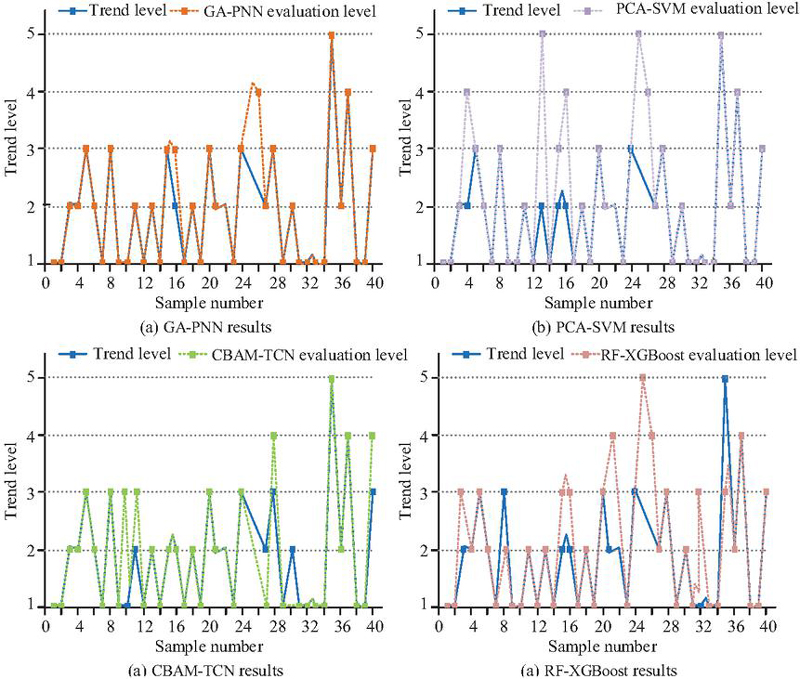
Figure 9 Evaluation results on continuous samples.
As shown in Figure 9, GA-PNN had only 2 assessment errors, with a recognition error rate of 0.050, and the assessment curve showed the highest agreement with the actual values. PCA-SVM had 5 sample assessment errors, yielding a recognition error rate of 0.125; CBAM-TCN had 6 sample assessment errors; and RF-XGBoost had 8 sample assessment errors. Among them, GA-PNN achieved 100% accuracy in identifying the three key levels of “Safe”, “Severe Threat”, and “Critical Threat”. This indicated that the GA-PNN assessment had minor overall errors while possessing excellent capability in stably distinguishing the two core states of network security and severe threats, thereby providing highly credible evidence for security decisions and effectively avoiding misjudgments on critical risks.
3.2 Effect Verification of the SA-GRU Situation Prediction Module
Based on the accurate and reliable assessment results of GA-PNN, which provided high-quality time series vectors for situation prediction, the study input the normalized situation sequence output by GA-PNN into the SA-GRU prediction module to achieve advanced perception and early warning of future security risks and to verify its performance in capturing situation evolution patterns and achieving accurate predictions. Meanwhile, the study selected GA-PNN normalized situation assessment sequences from 5 consecutive working days in the dataset, using the situation values from the first 300 minutes of each working day as input data for SA-GRU model training to predict the situation values for the subsequent 60 minutes of that working day. To evaluate the actual prediction performance of the SA-GRU, the study used Root Mean Square Error (RMSE) and Mean Absolute Error (MAE) metrics to measure the deviation magnitude and average absolute deviation between the model’s situation values and actual situation values, and compared it with Attention-based Long Short-Term Memory (Att-LSTM) and Convolutional Residual Gated Recurrent Unit (CNN-ResGRU). The results are shown in Figure 10.
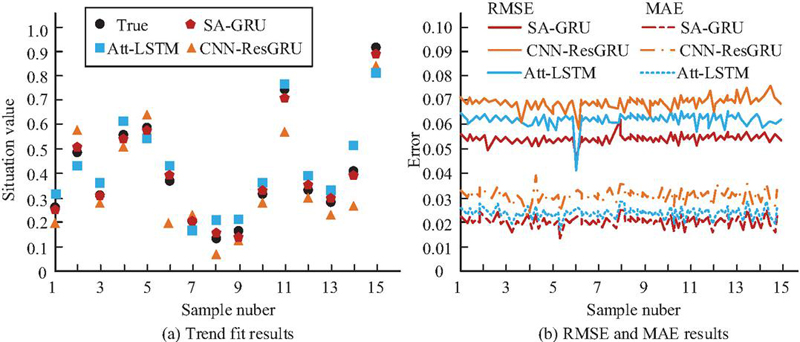
Figure 10 Comparison of RMSE and MAE results of predicted values.
In Figure 10(a), the predicted values from SA-GRU were closest to the actual values, indicating the highest degree of fit. This advantage is particularly pronounced when situation values fall within the high-risk range of 0.4-0.8: the predictions of SA-GRU closely track the actual values in near synchrony, whereas Att-LSTM and CNN-ResGRU yield substantial deviations – especially for situation values exceeding 0.75, which correspond to severe and critical threat levels. This directly confirms that SA-GRU, through its self-attention mechanism, can dynamically identify, focus on, and efficiently leverage key feature segments indicative of risk escalation in historical sequences, enabling faster, more accurate responses to rapidly rising risks. In Figure 10(b), the root mean square error and mean absolute error curves of SA-GRU were at the lowest position among all algorithms, with a maximum MAE of 0.0241 and a maximum RMSE of 0.0603, and most samples had MAE values below 0.02. This demonstrated that the SA-GRU’s predictions were the most accurate overall and maintained high stability across all test samples. To further verify the fine-grained classification performance of SA-GRU in network attack type prediction, the study selected four typical attacks – DDoS, DoS, BF, and CSS – as evaluation targets, with 100 samples per type. The results are shown in Figure 11.
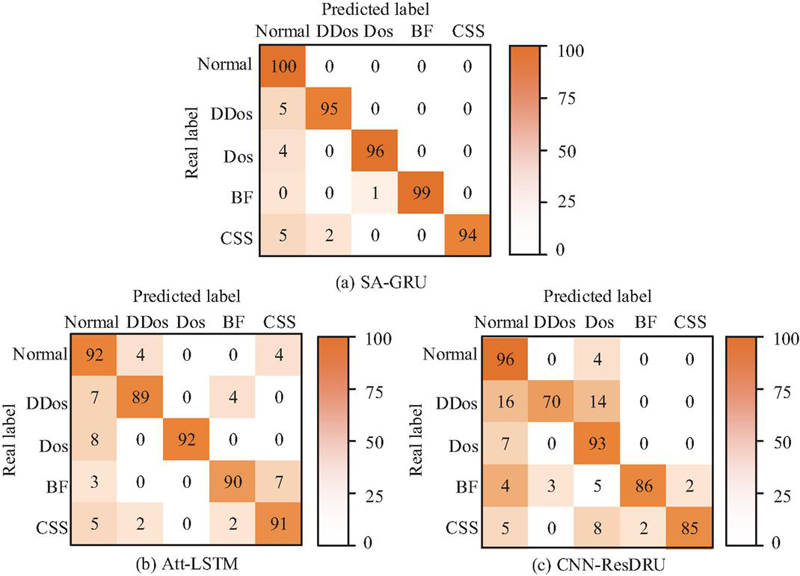
Figure 11 Classification effect of different attack types.
As shown in Figure 11, SA-GRU achieved 100% recall on 100 standard traffic samples, indicating it was highly reliable in judging baseline network behaviors. In the four attack type predictions, DDoS, DoS, BF, and CSS were accurately identified 95, 96, 99, and 94 times, respectively, with all recall rates above 94%. This indicates that the SA-GRU model has stable discrimination across different attack patterns and, in general, achieves excellent classification performance. Comparatively, the model CNN-ResGRU identified only 70 DDoS attacks correctly, reflecting its deficiency in capturing high-intensity complex attack characteristics. The model Att-LSTM correctly predicted 89 DDoS attacks, much lower than SA-GRU, which indicated that in identifying the attack traffic with fluctuation characteristics, its recall capability still had limitations. In general, through the synergistic effects of its gate structure and self-attention mechanism, SA-GRU demonstrated stronger discriminative capability in classification tasks involving multiple attack types. To comprehensively estimate the prediction performance of the SA-GRU model, this study selects the metric system from three dimensions: prediction stability, prediction deviation, and decision reliability, including CV, MPE, MSB, BS, and KLD. In addition, the general dataset commonly used for comparative verification is CIC-IDS; see the results in Table 1.
Table 1 Results of multiple comprehensive indicator tests
| Dataset | Model | CV | MPE | MSB | BS | KLD |
| CIC-IDS | SA-GRU | 0.079 | 0.085 | 0.001 | 0.031 | 0.051 |
| Att-LSTM | 0.129 | 0.178 | 0.004 | 0.083 | 0.165 | |
| CNN-ResGRU | 0.148 | 0.208 | 0.011 | 0.118 | 0.276 | |
| CIC-IoMT-2024 | SA-GRU | 0.084 | 0.089 | 0.002 | 0.032 | 0.058 |
| Att-LSTM | 0.135 | 0.185 | 0.005 | 0.094 | 0.172 | |
| CNN-ResGRU | 0.152 | 0.214 | 0.012 | 0.121 | 0.295 |
As shown in Table 1, across both datasets, SA-GRU demonstrated significant advantages over Att-LSTM and CNN-ResGRU on all metrics. In terms of prediction stability, its CV values were 0.079 and 0.084, and MPE values were 0.085 and 0.089, both lower than those of the comparison models. This meant its prediction results had the least minor fluctuations across different time periods and attack patterns, showing excellent robustness. In deviation control, the MSB of SA-GRU was close to 0, indicating that its predictions were unbiased. Furthermore, the BS of SA-GRU was below 0.032, and the maximum KLD was 0.058, indicating that SA-GRU’s prediction output had the highest decision reliability. Its predicted probability distribution was closest to the evolution pattern of actual situations, providing the most credible basis for proactive defense decisions. Additionally, whether using the classic or newly released dataset, SA-GRU maintained excellent performance, indicating strong generalization and suitability across different network security scenarios. Therefore, from a comprehensive perspective of multi-dimensional metrics including prediction error, stability, and decision reliability, the SA-GRU prediction model achieves an overall performance superiority over advanced time-series prediction models such as Att-LSTM and CNN-ResGRU. This verifies the effectiveness of integrating the self-attention mechanism with GRU, endowing the model with high accuracy, high stability, and strong generalization ability in situation prediction tasks, as well as higher practical application value.
4 Conclusion
Existing network security situation analysis and forecasting techniques have limitations in measuring uncertainty, integrating multiple data sources, and modeling long-term dependencies. To achieve dynamic perception, accurate assessment, and advanced prediction of network security situations, this study optimizes PNN parameters via GA to improve assessment accuracy, integrates SA with GRU to enhance temporal prediction capability, and constructs an integrated assessment and prediction system for proactive security early warning. Experimental results verify the effectiveness of this method. Ultimately, a network security situation analysis and forecasting system was designed that included both the GA-PNN and SA-GRU modules. The experimental results showed that the accuracy and detection rate of GA-PNN assessment reached 96.78% and 95.02%, respectively, with a false detection rate of 3.81%, all of which were superior to the comparison algorithms. SA-GRU achieved an MAE below 0.0241 and an RMSE below 0.0603 in situation prediction tasks, with recall rates exceeding 94% across four types of attack recognition. Moreover, the CV was below 0.085, and the BS score did not exceed 0.032, demonstrating excellent prediction stability and decision reliability.
The study’s core innovations are threefold: first, it proposes a GA-PNN collaborative optimization framework, where GA simultaneously optimizes PNN’s smoothing parameters and feature weights to achieve accurate measurement of cybersecurity uncertainties; second, it constructs an SA-GRU prediction model, which leverages the self-attention mechanism to enhance the weights of key segments indicative of risk escalation in time series, balancing global dependency capture and local feature extraction; third, it designs an integrated assessment and prediction system, bridging the gap between decoupled assessment and prediction in existing research to provide a highly efficient integrated proactive defense solution. Compared with previous literature, this study breaks through the core bottlenecks of traditional techniques in uncertainty measurement, multi-source data fusion, and long-term temporal dependency modeling, establishing an integrated technical approach with high reliability and strong generalization capability at the methodological level. From a system-integration perspective, this integrated design avoids the complexity and costs of deploying multiple independent systems and provides a highly efficient alternative.
However, the study has not been fully validated in ultra-large-scale network environments and diverse attack scenarios. Future research will focus on two directions: first, verifying the system’s adaptability to ultra-large-scale networks and complex attack scenarios, and optimizing the efficiency of massive data processing; second, integrating federated learning and reinforcement learning technologies to enhance the system’s adaptive defense capability against unknown attacks.
Conflicts of Interest
The authors declare that they have no conflicts of interest.
References
[1] Feng H, Chen D, Lv H, Lv Z. Game theory in network security for digital twins in industry. Digital Communications and Networks, 2024, 10(4), 1068–1078.
[2] Ogah M D, Essien J, Ogharandukun M, Abdullahi M. Machine learning models for heterogenous network security anomaly detection. Journal of Computer and Communications, 2024, 12(6):38–58.
[3] Sokol P, Staňa R, Gajdoš A, Pekarèík P. Network security situation awareness forecasting based on statistical approach and neural networks. Logic Journal of the IGPL, 2023, 31(2): 352–374.
[4] Khan M J. Zero trust architecture: Redefining network security paradigms in the digital age. World Journal of Advanced Research and Reviews, 2023, 19(3): 105–116.
[5] Li J, Wu Y, Li Y, Zhang Z, Fouad H, Altameem T. A network security prediction method based on attack defense tree. Journal of Nanoelectronics and Optoelectronics, 2023, 18(3), 357–366.
[6] Chen, Z. 2024. Campus Network Security Intrusion Detection Based on Feature Segmentation and Deep Learning. Journal of Cyber Security and Mobility. 13, 04 (Jun. 2024), 775–802. https://doi.org/10.13052/jcsm2245-1439.1349.
[7] Mlakar P, Merše J, Faganeli Pucer J. Ensemble weather forecast post-processing with a flexible probabilistic neural network approach. Quarterly Journal of the Royal Meteorological Society, 2024, 150(764): 4156–4177.
[8] Zha W, Zhang J, Dan Y, Li, Y. A novel wind power prediction method of the lower upper bound evaluation based on GRU. Transactions of the Institute of Measurement & Control, 2025, 47(3):599–609.
[9] Dora V R S, Lakshmi V N. Smart network security using advanced ensemble-DDoS attack detection and hybrid JA-SLOA-linked optimal routing-based mitigation. Australian journal of electrical and electronics engineering, 2024,21(4):374–396.
[10] Sun J, Li C, Song Y, Ni P, Wang J. Network Security Situation Prediction Based on TCAN-BiGRU Optimized by SSA and IQPSO. Tech Science Press, 2023, 47(10): 993–1012.
[11] Guo X, Yang J, Gang Z Y A. Research on Network Security Situation Awareness and Dynamic Game Based on Deep Q Learning Network. Journal of Internet Technology, 2023, 24(2):549–563.
[12] Ya-Xing W U, Zhao D M. Build IPSO-ABiLSTM Model for Network Security Situation Prediction. Journal of Information Science & Engineering, 2024, 40(1): 71–88.
[13] Alharbi F, Kashyap G S. Empowering Network Security through Advanced Analysis of Malware Samples: Leveraging System Metrics and Network Log Data for Informed Decision-Making. International Journal of Networked and Distributed Computing, 2024, 12(2): 250–264.
[14] Deshmukh S, Gupta P. Application of probabilistic neural network for speech emotion recognition. International Journal of Speech Technology, 2024, 27(1): 19–28.
[15] Shakir U, Ali A, Hussain M, Radwan A E, Aal A A E. PNN Enhanced Seismic Inversion for Porosity Modeling and Delineating the Potential Heterogeneous Gas Sands via Comparative Inversion Analysis in the Lower Indus Basin. Pure and Applied Geophysics, 2024, 181(9): 2801–2821.
[16] Kadum J, Al-Tuwaijar J M, Kadum A, Rasheed S H. Towards Smart Farming Approach for Plants Disease Detection and Classification by Using HoG Feature Extraction and PNN Algorithm. Mustansiriyah Journal of Pure and Applied Sciences, 2025, 3(1):64–81.
[17] Mohsen S. Recognition of human activity using GRU deep learning algorithm. Multimedia Tools and Applications, 2023, 82(30): 47733–47749.
[18] Cao B, Shang H, Fan M, Sun F. CNN-GRU based method for peak location of reflected Terahertz signals from thermal barrier coatings. Nondestructive Testing and Evaluation, 2024, 39(8): 2132–2149.
[19] Chang Z H. Analysis of Collaborative Characteristics of Reinforcement Learning Intelligent Control and Bayesian Network Model in Network Security Protection. Journal of Cyber Security and Mobility, 2025, 14(2): 365–390.
[20] Zhang L, Liu Y. Network Security Prediction and Situational Assessment Using Neural Network-based Method. Journal of Cyber Security and Mobility, 2023, 12(4): 547–568.
[21] Gao H, Guo L. Research on Network Security Situation Prediction Algorithm Combining Intuitionistic Fuzzy Sets and Deep Neural Networks. SAE International Journal of Connected and Automated Vehicles, 2024, 7(3):341–353.
[22] Shi Y, Liu G, Yang B, Chen Y, Liang Z. A feature selection algorithm for PNN optimized by binary PSO and applied to smart city intrusion detection system. IC-ITECHS, 2024, 5(1), 33–42.
[23] Javeed M D, Nagaraju R, Chandrasekaran R, Rajulu G, Tumuluru P, Ramesh M, Shrivastava R. Brain tumor segmentation and classification with hybrid clustering, probabilistic neural networks. Journal of Intelligent & Fuzzy Systems, 2023, 45(4): 6485–6500.
[24] Li Z. Retracted: Neural network economic forecast method based on genetic algorithm. IET software, 2023, 17(4): 681–693.
[25] Khatri K A, Shah K B, Logeshwaran J, Shrestha A. Genetic algorithm based techno-economic optimization of an isolated hybrid energy system. CRF, 2023, 8(4), 1447–1450.
[26] Yan Y, Zhang W, Liu Y, Li Z. Simulated annealing algorithm optimized GRU neural network for urban rainfall-inundation prediction. Journal of Hydroinformatics, 2023, 25(4), 1358–1379.
[27] Xue Q, Fang F. Study on Nowcasting Method of Severe Convective Weather Based on SA-PredRNN++. Journal of Data Science and Intelligent Systems, 2024, 3(3), 176–183.
[28] Uluocak I, Bilgili M. Daily air temperature forecasting using LSTM-CNN and GRU-CNN models. Acta Geophysica, 2024, 72(3): 2107–2126.
[29] Chen J, Liu M, Liu W, Chi D, Xie J, Liu J, Zhang W. Middle-and Long-Term Runoff Forecast Model for Water Resource and Climate Security Based on Self-Attention Mechanism. Land Degradation & Development, 2025, 36(8), 2773–2785.
[30] Chen C, Quan W, Shao Z. Aerial target threat assessment based on gated recurrent unit and self-attention mechanism. Journal of Systems Engineering and Electronics, 2024, 35(2): 361–373.
Biographies

Bo Hong was born in Zhejiang Province, China, in 1979. He received his Bachelor’s degree from Ningbo University in Ningbo City, China, in 2002, a Master of Software Engineering degree from Dalian University of Technology in Dalian City, China, in 2006, and a Master of Management degree from Dalian Jiaotong University in Dalian City, Liaoning Province, China in 2007. He is currently a Senior Engineer with Zhejiang University. His current research interests include Software Engineering and University Informatization. He is with the Information Technology Center, Zhejiang University, Hangzhou 310058, China.

Xindi Ying was born in Zhejiang Province, China, in 1985. He received his Bachelor of Computer Science and Technology degree from Jiaxing University in Jiaxing City, Zhejiang Province, China, in 2007, and his Master of Software Engineering degree from Zhejiang University in Hangzhou City, Zhejiang Province, China, in 2009. He is currently an Engineer at Zhejiang University. His current research interests include Computer Science and Technology, Software Engineering, and University Informatization. He is with the Information Technology Center, Zhejiang University, Hangzhou 310058, China.

Chuanfeng Lin was born in Zhejiang Province, China, in 1988. He received the M.Sc. degree in computer application technology from Zhejiang Gongshang University, Hangzhou, China, in 2012. respectively. He is currently an Engineer with Zhejiang University. His current research interests include data governance and data security. He is with the Information Technology Center, Zhejiang University, Hangzhou 310058, China.

Yuwei Xie was born in Hangzhou, Zhejiang Province, China, in 1988. He received the Master degree in Embedded system from Kristianstad University, Sweden, and received the B.Sc. in Automation from Hangzhou Dianzi University, Hangzhou, China. He is currently an engineer with Zhejiang University. His current research interests include artificial intelligence, IT service, IT Operations and maintenance and Computer applications. He is with the Information Technology Center, Zhejiang University, Hangzhou 310058, China.

Xuesong Liu was born in Shaanxi Province, China, in 1988. He received the B.Sc. and Ph.D. degrees in sonar signal processing from Zhejiang University, Hangzhou, China, in 2010 and 2015, respectively. He is currently an Associate Professor with Zhejiang University. His current research interests include sonar signal processing, parallel processing, and embedded system design. He is with the College of Biomedical Engineering & Instrumentation Science, Zhejiang University, Hangzhou 310058, China and also with the Embedded System Engineering Research Center, Ministry of Education of China, Zhejiang University, Hangzhou 310027, China.
Journal of Cyber Security and Mobility, Vol. 15_1, 247–272
doi: 10.13052/jcsm2245-1439.1519
© 2026 River Publishers