Prediction of Financial Data Security Risks and Privacy Protection Methods for Listed Companies Based on Hypergraph Learning
Zijie Zhou1,* and Tao Zhang2
1The College of International Economics and Trade, Central University of Finance and Economics, 102206 Beijing, China
2The College of Computer Science and Engineering, Nanjing University of Science and Technology, 210094 Nanjing, China
E-mail: 2022311224@email.cufe.edu.cn
*Corresponding Author
Received 26 November 2025; Accepted 29 December 2025
Abstract
With the acceleration of digitalization, financial data of listed companies are facing complex and diverse security risks and privacy leakage hazards. To improve the accuracy and effectiveness of data security management, this study proposes a financial data security risk prediction and privacy protection method for listed companies based on hypergraph learning. It is based on hypergraph learning to construct a risk prediction model, which optimizes the hyperedge weight algorithm to explore the complex relationships between multi-dimensional financial data, and integrates bidirectional gated loop units to achieve dynamic risk prediction. A layered privacy protection strategy based on differential privacy has been designed, which adaptively allocates privacy budget according to data sensitivity. The experiment showed that this risk prediction method had an accuracy rate of 93.1% on financial datasets, which was 9.2% higher than traditional graph attention networks. The false positive rate was only 2.8%, and it could accurately identify 8 potential security risks. When the privacy budget was 0.6, the privacy protection method controlled the data utility loss at 11.5%, which improved the information utilization rate by 25.3% compared to traditional generalized anonymity methods. It also met the privacy compliance standards of the financial industry in six scenarios, including data transactions and internal audits. Through the coordinated design of risk prediction and privacy protection, this study establishes a comprehensive financial data security management framework for listed companies. The method’s core innovation lies in systematically resolving the balance between security safeguards and data utility. By integrating hypergraph learning with BiGRU prediction models, it achieves high-precision dynamic risk alerts for complex scenarios while preserving data analytical value. Additionally, the adaptive hierarchical protection strategy based on differential privacy provides compliant and measurable security for sensitive information. This system delivers a practical, integrated technical solution for the financial industry that balances precise risk alerts with privacy controllability.
Keywords: Big data security issues, privacy in data processing, hypergraph learning, risk prediction, bidirectional gate control loop unit.
1 Overview
With the widespread application of emerging technologies such as big data, cloud computing, and artificial intelligence in the financial field, listed companies have generated and accumulated a large amount of high-value financial data during their operations. These data cover sensitive content such as financial statements, transaction records, customer information, as well as strategic decisions and trade secrets of enterprises. They also include supply chain finance data, cross-border fund flow records, executive compensation and equity pledge information, and other deeply sensitive data. This type of data is not only related to the core business operations of enterprises, but also involves the rights and interests of multiple parties such as investors and employees, making it a key target of cyber attacks and data breaches. In recent years, many frequent financial data security incidents have exposed the vulnerability of traditional data protection mechanisms in dealing with complex threats, and there is an urgent need to introduce more intelligent and efficient security risk prediction and privacy protection measures. At the same time, the national level continues to strengthen the supervision of data security, and the introduction of relevant regulations has also put forward higher requirements for enterprise data compliance management. Therefore, how to achieve accurate prediction and dynamic protection of financial data security risks while ensuring data privacy has become an important issue that urgently needs to be addressed in the current financial technology field [1, 2].
In terms of risk prediction, conference call transcript data holds significant value for predicting a firm’s future risks. However, the excessive length of these texts complicates model development. To tackle this challenge, He Y et al. proposed an approach that integrates TextRank for extracting key information with hypergraph learning to model semantic relationships within the dialogue, leading to a notable improvement in predictive performance [3]. Graph Machine Learning (Graph ML) has seen widespread adoption in high-stakes domains such as finance and healthcare, yet its security vulnerabilities are becoming increasingly apparent. Wang S et al. caution that models lacking explicit security-aware design may yield unreliable predictions, exhibit poor generalization, and even risk leaking sensitive data. In critical applications like financial anti-fraud systems, there is an urgent need to develop security-oriented graph models to mitigate potential societal risks [4]. Traditional credit ratings rely on financial and market data. However, Das S et al. constructed a corporate network (CorpNet) based on SEC filings, combined graph convolutional networks with the AutoGluon ensemble model, and verified the effectiveness of network data in credit scoring. Their approach outperforms traditional tabular models [5]. Wang Z et al. designed a hybrid collaborative scoring strategy to meet the needs of dynamic credit risk assessment, with sub-models predicting default and risk timing. Empirical evidence showed that it was superior to survival analysis and multi-label learning methods [6].
In terms of privacy protection, Effendi F et al. proposed a privacy-preserving collaborative framework based on fully homomorphic encryption (FHE). By quantizing and pruning to optimize the graph neural network (GNN) and developing an XGBoost pipeline based on graph feature pre-processing, secure modeling under cross-institutional encrypted data was achieved [7]. Current network threat intelligence analysis often ignores the multiple relationships among entities. Jia J et al. proposed the Hyper Attack Graph (HAG) framework, which uses a multi-head selection mechanism to jointly extract security entities and relationships, and integrates external knowledge through a hypergraph structure. Experiments show that the F1 values of HAG in entity and relationship extraction are improved by 11.12% and 6.71% respectively [8]. Xu X et al. emphasized in empirical asset pricing research that network big data mining needs to be combined with privacy protection techniques. By using nonlinear unsupervised feature learning to improve the effectiveness of pricing models, it was possible to enrich the cross-research between machine learning and empirical finance while meeting the data security requirements in practical applications [9].
Hypergraph learning, an advanced paradigm capable of explicitly modeling multi-relationships and high-order dependencies, is expanding its applications from traditional domains like social networks and bioinformatics into financial analysis. Early explorations primarily focused on using hypergraphs to structurally analyze complex trading networks in financial markets or cross-company equity relationships, aiming to reveal systemic risks. However, most of these studies treated companies or assets as homogeneous nodes, failing to fully exploit the rich semantic information and interaction logic embedded in unstructured financial texts (such as financial reports and meeting minutes). Recently, while some scholars have attempted to combine hypergraphs with graph neural networks for financial sentiment analysis or credit risk assessment, their models often struggle to simultaneously accommodate the multi-source heterogeneity of texts (e.g., distinguishing between declarative and interrogative roles) and dynamic temporal sequences, showing limitations when handling multi-round, multi-role interactive scenarios like earnings calls [10].
While existing methods have optimized feature extraction and model architecture, most models struggle to effectively capture the temporal dynamics and higher-order semantic relationships inherent in financial texts. Risk signals in earnings call transcripts often evolve dynamically with the progression of Q&A sessions and discussion topics, involving complex interactions and semantic connections among multiple stakeholders (e.g., executives, analysts) across various issues. Current models either focus on static feature extraction or can only handle simple binary relationships, lacking the capability to model multi-node, cross-session semantic chains. This limitation results in limited recognition of dynamically evolving and semantically complex risk categories such as compliance risks and information disclosure risks.
To address this, the study proposes an end-to-end framework that deeply integrates hypergraph learning with BiGRU, specifically designed for predicting financial data security risks and protecting privacy in listed companies. The breakthroughs are reflected in: (1) Innovative high-order semantic modeling: By designing three types of semantic hyperedges (temporal, role, and thematic), the framework constructs a dynamically evolving high-order semantic network directly from earnings call transcripts, achieving granular risk correlation characterization; (2) Synergy of dynamic and static features: Utilizing hypergraph convolution to capture complex spatial semantic associations combined with BiGRU to track temporal risk evolution trajectories, this approach overcomes previous models’ limitations of being either static or neglecting high-order relationships; (3) Integrated “prediction-protection” design: Collaborating cutting-edge hypergraph risk prediction models with adaptive protection mechanisms based on differential privacy, the framework enables comprehensive security management spanning from precise risk perception to compliant data utilization.
2 Management Methods for Financial Data Security of Listed Companies
2.1 Risk Prediction Method Based on Hypergraph Learning
Financial risk signals are often embedded in heterogeneous textual information generated by various stakeholders (e.g., corporate executives, analysts, auditors) through diverse communication formats (statements, questions, responses). Traditional sequence models or graph models typically treat texts as homogeneous sequences or simplify relationships into binary interactions, making it challenging to explicitly distinguish and integrate these heterogeneous information sources and their structural roles. Hypergraphs provide a natural formal framework by defining different types of nodes (e.g., statement nodes, question nodes, response nodes) and hyperedges (e.g., temporal edges, role edges, topic edges). This approach unifies multi-source heterogeneous data into a structured topological representation, preserving complete relational semantics for subsequent feature learning. Moreover, the formation and transmission of financial risks often stem not from simple pairwise relationships, but from high-order semantic associations arising from the combined effects of multiple entities and discourse fragments within specific contexts (such as the same issue or time window). The core component of hypergraphs, “hyperedges,” can simultaneously connect any number of nodes, enabling direct and explicit capture of the prevalent “group-semantic” high-order patterns in financial texts. Figure 1 shows the hypergraph structure under various levels of correlation. Figures 1(a)–1(c) show the first-order, second-order, and third-order correlations of hypergraphs.
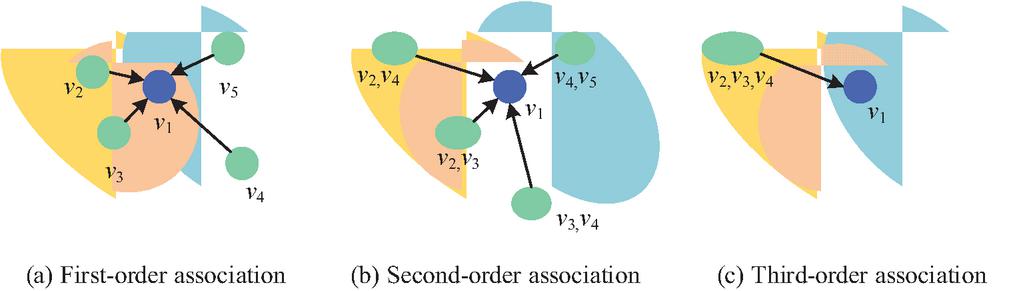
Figure 1 Hypergraph structure under various correlation levels.
In Figure 1, the hypergraph can directly associate nodes 2, 3, and 4 through a hyperedge, while also capturing indirect higher-order associations between node 1 and nodes 2 and 4. A regular graph can only represent a binary relationship by connecting two nodes with edges, and cannot reflect a multi node semantic chain. As the number of nodes covered by hyperedges increases, the number of expressed association combinations increases exponentially [11, 12]. For the financial report conference text in financial data, the hypergraph can be represented as , where is the node set and is the hyperedge set. For node , this study uses the Bidirectional and Auto-Regression Transformers (BART) summarization algorithm to extract key semantic sentences from the statement section [13]. Each key sentence corresponds to one global statement node . The question and answer section is divided into “question answer” units, with each question referred to as question node and each answer referred to as answer node . Therefore, the node set can be defined as Equation (1) [14].
| (1) |
In Equation (1), represents the number of Q&A rounds for the financial report conference text, while and correspond to the question and answer texts for the -th round of Q&A. The construction of hyperedge needs to match the semantic association characteristics of financial report text. For this purpose, this study designs three types of hyperedges: temporal hyperedge (capturing the sequential relationship between Q&A), role hyperedge (aggregating cross turn conversations of the same analyst/executive), and topic hyperedge (linking statements and the same topic of Q&A). The construction of thematic hyperedges follows these steps: First, the LDA (Latent Dirichlet Allocation) model extracts topics from the full text of earnings calls (including presentations and Q&A sessions), with K topics set to 10 in the experiment, generating topic distribution vectors for each text segment. Second, the cosine similarity between presentation nodes and Q&A nodes is calculated. If the similarity exceeds a predefined threshold ( in the experiment), the nodes are classified as sharing the same topic and merged into a single hyperedge. To enhance interpretability, a keyword matching strategy is additionally employed. Identical key term clusters (e.g., “liquidity risk,” “compliance disclosure,” “revenue recognition”) in presentation and Q&A texts serve as supplementary evidence for topic association. The correlation is quantified by matrix , as shown in Equation (2).
| (2) |
In Equation (2), , is the total number of nodes, is the total number of hyperedges, is the semantic association of node participating in the construction of hyperedge , and represents no association. After the completion of the hyperedge construction, due to the different contributions of different hyperedges to risk prediction, using fixed weights may cause non critical hyperedges to interfere with model decision-making. Therefore, this study designs a hyperedge weight optimization algorithm based on semantic similarity and risk contribution. The weight of the hyperedge is calculated as shown in Equation (3).
| (3) |
In Equation (3), is the balance coefficient, and is the cosine similarity between the hyperedge and the risk semantic template . is a dynamic vector that integrates domain prior knowledge and data-driven learning. First, based on the 8 categories of financial risks identified in this paper (such as market fluctuation risk, compliance risk, etc.), we organize an authoritative risk terminology dictionary from financial regulatory documents, risk event cases, and industry reports. We then encode the dictionary terms using the pre-trained BERT model to obtain the initial risk semantic vector. Then, during the model training process, is co-optimized with the hypergraph learning framework. It adaptively adjusts the vector representation according to the actual risk expression habits in the financial report meeting texts (such as implicit risk expressions in executive Q&As, industry-specific risk description methods), and finally forms a dynamically updated risk semantic template. is the maximum similarity between all hyperedges and the risk template, used for normalization. is the number of risk related nodes contained in the hyperedge. is the total number of nodes contained in hyperedge . Based on hyperedge weights and hypergraph structures, a complete hypergraph learning framework can be constructed, as shown in Figure 2.
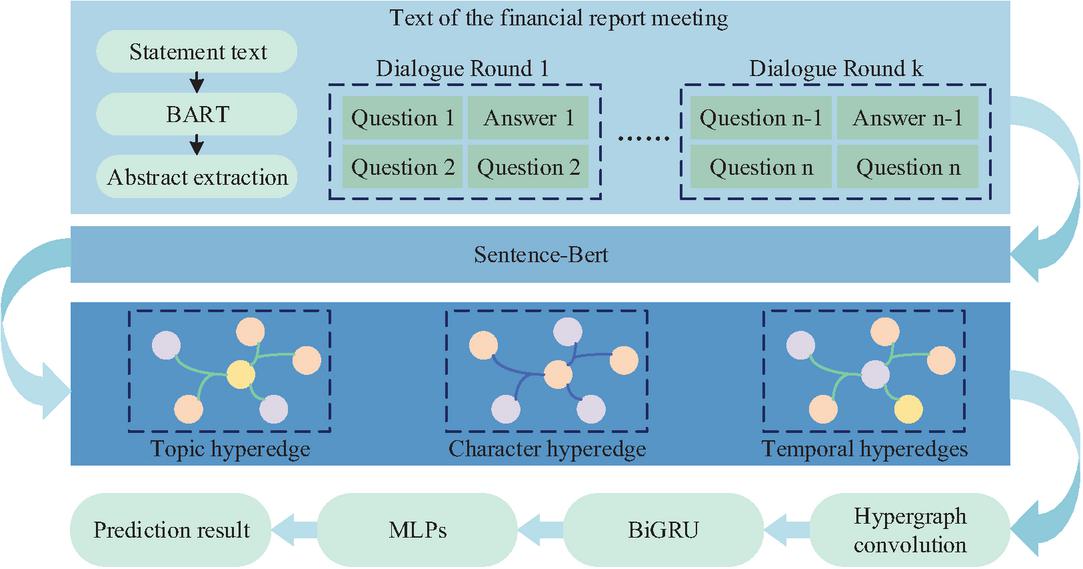
Figure 2 Risk prediction process based on hypergraph learning.
In Figure 2, the entire framework starts with financial report text preprocessing, first generating compressed statement information through summarization, and then encoding various nodes as initial features. Subsequently, it constructs a hypergraph based on hyperedges and weight optimization, extracts deep features through the synergistic effect of hypergraph convolution and BiGRU, and finally outputs risk prediction results through a Multilayer Perceptron (MLP) [15]. Among them, hypergraph convolution enables each node to fuse the semantic information of its corresponding hyperedges. Combining the optimized hyperedge weights, the node features of the hypergraph convolution are updated as shown in Equation (4).
| (4) |
In Equation (4), is the node feature matrix of layer (dimension , is the feature dimension). is the updated node feature matrix after convolution. is the transpose symbol of the matrix. is the node degree matrix (diagonal element , reflecting the total weight of hyperedges in which nodes participate). is the hyperedge matrix (diagonal element , reflecting the number of nodes contained in the hyperedge). is the hyperedge weight matrix (diagonal element ). is the learnable parameter matrix of the -th layer, and is the ReLU activation function. The information transmission process of hypergraph convolution is shown in Figure 3.
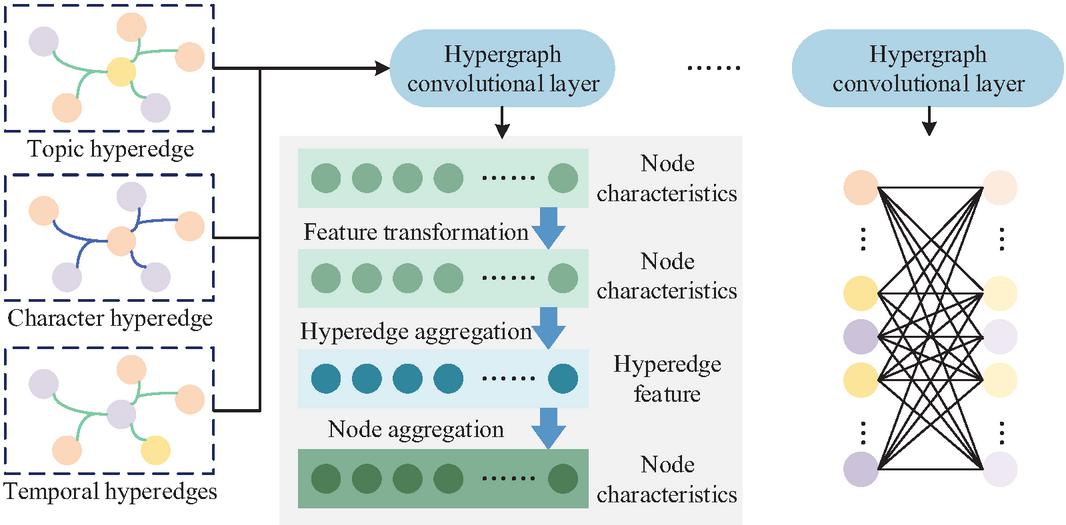
Figure 3 Hypergraph convolutional network.
In Figure 3, the hypergraph convolution first aggregates node features using hyperedge weights to generate hyperedge features, and then feeds back the hyperedge features to the corresponding nodes to complete the update of node features. After stacking multiple layers of convolution, node features can gradually integrate global semantic associations. Due to the temporal nature of the financial report conference text, relying solely on the static features output by hypergraph convolution cannot capture this temporal dynamics. Therefore, the BiGRU model is introduced [16]. The calculation of the forward hidden state and backward hidden state of BiGRU is shown in Equation (5) [17].
| (5) |
In Equation (5), represents the node representation after hypergraph convolution, and represents the hidden state output by BiGRU. Finally, the representations of all nodes are concatenated after average pooling and input into MLP for risk prediction, as shown in Equation (6).
| (6) |
In Equation (6), is the risk value predicted by the model. and are the number of all question and answer nodes and statement nodes. is the final feature representation of node after hypergraph convolution and BiGRU processing. The model training adopts mean square error loss, as shown in Equation (7).
| (7) |
In Equation (7), is the loss value, is the batch size, and are the predicted risk value and true risk value of the -th sample.
2.2 Methods for Protecting Financial Data Privacy
Financial data from listed companies (including transaction records and multi-period financial panel data) inherently possess high-dimensional characteristics. Applying uniform noise protection across all dimensions would lead to exponential growth in total privacy budget requirements, causing a sharp decline in data utility. More critically, distributing noise evenly across all dimensions within a fixed budget would result in excessively low signal-to-noise ratios for individual features, rendering subsequent risk prediction models ineffective. Financial data exhibits complex strong correlations between dimensions (e.g., revenue-profit interdependencies, cross-period asset return linkages). These structural relationships mean that even when applying noise to individual data points or dimensions, attackers could leverage known correlation models to deduce or significantly narrow the possible range of original sensitive information from multiple compromised dimensions, thereby weakening or circumventing differential privacy protections [18]. Therefore, this study designs a layered privacy protection strategy based on differential privacy. This strategy adaptively allocates privacy budget based on data sensitivity, and combines adaptive gradient pruning and dynamic noise injection to maintain the accuracy of risk prediction models while meeting privacy compliance standards in the financial industry. The overall architecture of this strategy is shown in Figure 4.
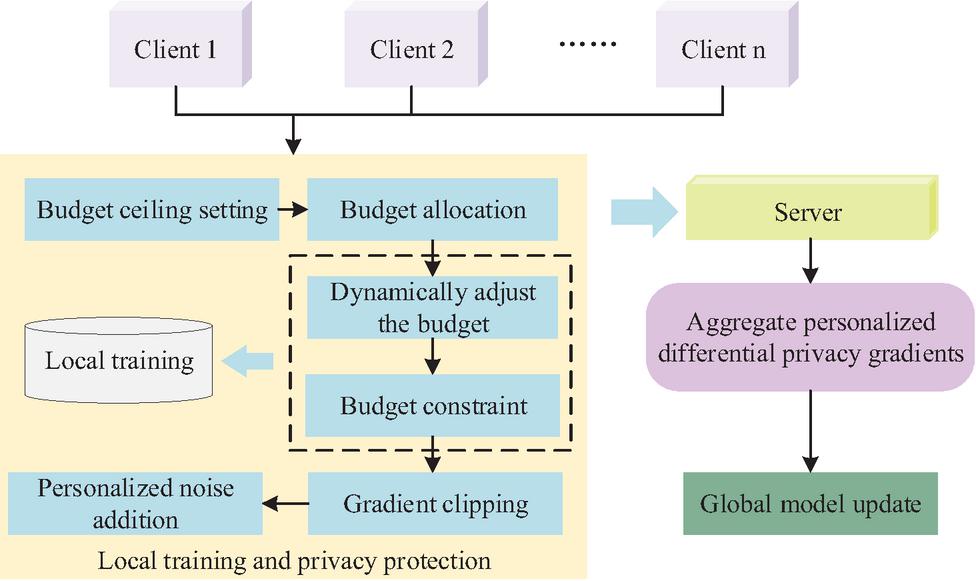
Figure 4 Hierarchical privacy protection strategy based on differential privacy.
In Figure 4, each client is configured with an independent privacy budget , which is determined by both the sensitivity and quality of the client’s data. During the local training phase, the client first performs a pruning operation on the model gradient to limit the impact of abnormal gradients on the global model. Subsequently, the noise intensity is calculated based on , and Gaussian noise is injected into the cropped gradient to ensure that there are no identifiable individual data information in the gradient. After receiving the privacy gradients from all clients, the server aggregates and updates the global model based on weights. In the privacy budget allocation stage, this study designs a two-level budget allocation strategy of initial allocation and dynamic adjustment. The allocation of the initial privacy budget is shown in Equation (8).
| (8) |
In Equation (8), is the sample size of financial data for client . is the data quality score (value range [0,1]), which comprehensively reflects the completeness, consistency, and feature correlation of the data. The denominator is the sum of the products of the data volume and quality of all clients, ensuring that the total budget does not exceed (privacy budget limit). The calculation of is shown in Equation (9).
| (9) |
In Equation (9), is the integrity score (reconstructed financial report data using an autoencoder, calculated by subtracting the reconstructed mean square error from 1, with higher values indicating fewer missing fields in the financial report). is the consistency score (using isolated forest to detect outliers in transaction data, calculated by subtracting the proportion of outlier samples from 1, with higher values indicating more standardized transaction records). is the correlation score (using a deep feature selection network to evaluate the correlation between risk prediction targets and data features, calculated by the mean absolute value of feature weights, with higher values indicating greater contribution of data to risk prediction). , , and are the weights of the three [19]. Assuming that the contribution of client in the -th round is (measured by the increase in Area Under the Curve (AUC) before and after using the client data in the model), the update process of budget is shown in Equation (10) [20].
| (10) |
In Equation (10), is an adjustment coefficient (taking the value of 0.1), which is used to control the magnitude of budget adjustment in a single training round, so as to avoid severe fluctuations in budget allocation caused by contribution fluctuations that would affect training stability. The selection of this value is based on the following considerations and verifications: First, preliminary experiments were conducted via grid search within the range {0.01; 0.05; 0.1; 0.2; 0.5}, and it was found that achieves the optimal balance between budget adjustment sensitivity and training stability; Second, to verify its robustness, the study varied within the interval of 0.05 to 0.2 under a fixed total budget. Within this interval, the fluctuation of the model’s final risk prediction accuracy is less than 0.5%, and the Gini coefficient of the final distinguishability of each client remains stable, indicating that the method is insensitive to the value of within this reasonable range and has good robustness. is the average contribution of all clients in the -th round. If the client’s contribution is higher than the average, their budget will be moderately increased to encourage the provision of high-quality data, otherwise it will be reduced to avoid budget waste.
Given the significant disparities in financial data quality, fixed budget allocation would result in a mismatch between the privacy protection intensity of high-quality data and its value. The dynamic adjustment mechanism, however, incentivizes clients to proactively provide high-quality, standardized data by allocating budgets to high-contributing entities. This approach enhances the training efficiency and prediction accuracy of the global model at the source. Furthermore, the design strictly adheres to the total budget ceiling constraint. Budget adjustments are limited to dynamic reallocation within the total budget (where increased budgets for high-contributing clients come from reduced redundant budgets for low-contributing clients), rather than adding extra privacy resources. This ensures that the global privacy cost remains consistently manageable. From the perspective of privacy risk accumulation, combined with the Sequential Composition Theorem of differential privacy, the cumulative privacy loss of all clients in multi-round training satisfies . Since the total budget is always below the upper limit, and the number of training rounds is constrained by the Early-Stopping strategy (no more than 200 rounds in experiments), the final cumulative privacy loss can be strictly controlled within the range of . Meanwhile, with the adaptive gradient clipping (dynamically limiting gradient leakage risk) and dynamic noise injection mentioned earlier, even if high-contribution clients obtain a higher budget, the leakage probability of their sensitive information can still be controlled within the interval of 0.5%1.2%, which is much lower than the 3% privacy risk threshold in the financial industry. The client privacy budget allocation process is shown in Figure 5.
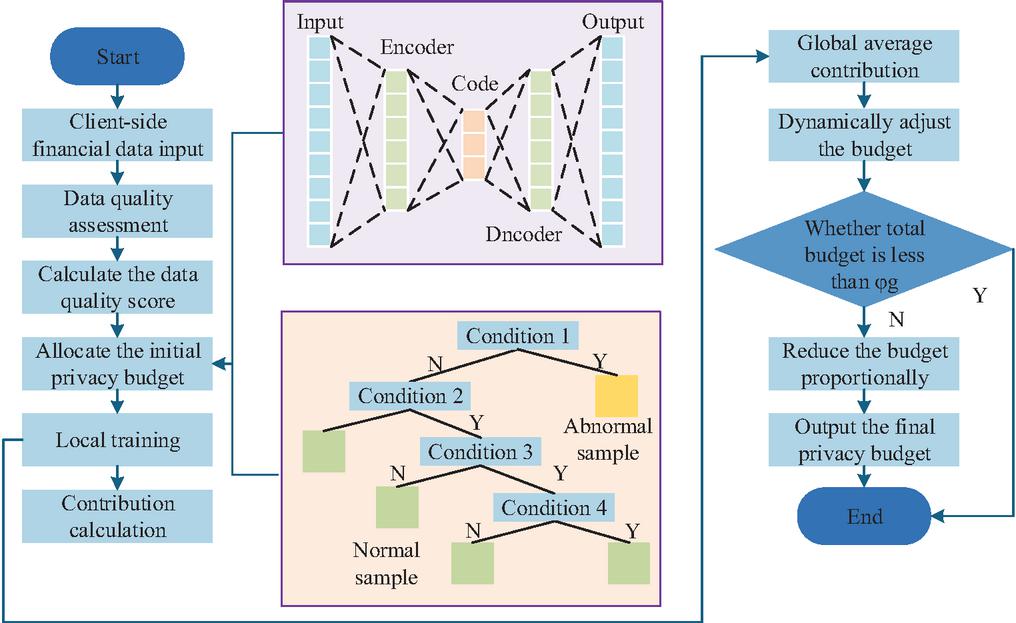
Figure 5 Client privacy budget allocation process.
In Figure 5, the process first determines the initial budget through multidimensional evaluation, then dynamically optimizes it based on the contribution during the training process, and finally ensures that the overall privacy protection strength meets the standard through total budget constraints. This process considers the quality differences in financial reports and trading data while incentivizing clients to provide high-quality data through contribution adjustments, avoiding the rigid flaws of traditional fixed budget strategies. After budget allocation, it is necessary to further control the risk of privacy leakage through gradient processing. In the financial data of listed companies, there are differences in gradient distribution among different clients, so an adaptive gradient clipping and dynamic noise injection mechanism has been designed. Assuming that the gradient norm of client in the -th round is , the update of the clipping threshold is shown in Equation (11).
| (11) |
In Equation (11), is the smoothing factor (taken as 0.9 to avoid excessive threshold fluctuations). The initial threshold is set based on the characteristics of financial data and dynamically adjusted with gradient distribution to ensure adaptation to the gradient characteristics of different clients. The gradient clipping operation is achieved by restricting the gradient norm, as shown in Equation (12).
| (12) |
In Equation (12), is the cropped gradient and is the original gradient. If , the gradient remains unchanged. If it exceeds the threshold, it is compressed proportionally to ensure that a single gradient does not leak too much sensitive information. The trimmed gradient still needs to be injected with noise to meet differential privacy requirements, and the noise intensity needs to be adaptively adjusted according to the client’s privacy budget. The collaborative process of gradient clipping and noise injection is shown in Figure 6.
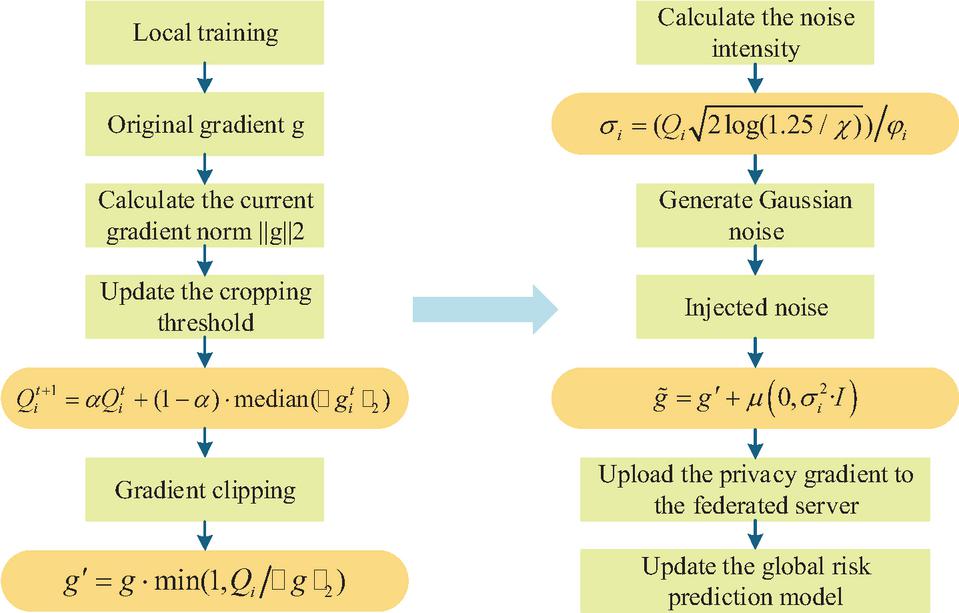
Figure 6 Synergistic process of gradient cropping and noise injection.
In Figure 6, the gradient processing process first adjusts the clipping threshold based on gradient statistics to avoid privacy leakage caused by abnormal gradients. Then, combined with personalized privacy budgeting, the noise intensity is calculated to ensure the targeted injection of noise. The entire process does not require sharing of raw financial data, only uploading privacy gradients, while meeting financial data protection requirements and maintaining the training efficiency of risk prediction models, suitable for scenarios where multiple parties collaborate in listed companies. The calculation of noise intensity is shown in Equation (13).
| (13) |
In Equation (13), is the relaxation parameter (taken as 10-5, representing the additional fault-tolerant probability for privacy protection). Afterwards, Gaussian noise is injected into the cropped gradient, as shown in Equation (14).
| (14) |
In Equation (14), is the gradient after injecting noise. is a Gaussian distribution with a mean of 0 and a variance of . is the identity matrix, ensuring that the noise dimension is consistent with the gradient.
3 Performance Analysis of Financial Data Security Management Methods for Listed Companies
3.1 Performance Analysis of Financial Data Security Risk Prediction Methods
The experimental dataset is sourced from the Thomson Reuters Street Events platform, and the financial conference texts of A-share listed companies from 2019 to 2023 are selected as experimental data, covering a total of 4,895 valid samples from 1,168 listed companies. Each sample is jointly labeled with risk labels by three senior financial analysts. The central processing unit model used in the experiment is Intel Xeon Gold 6338, the graphics processor is NVIDIA A100 80GB PCIe 4.0, the operating system is Ubuntu 22.04 LTS, and the deep learning framework is PyTorch 2.0. Table 1 shows the relevant settings.
Table 1 Experimental parameter setting
| Parameter Name | Setting Value | Description |
| Batch Size | 32 | Balances the GPU memory usage (32-batch training is supported by a single A100 GPU) and the stability of parameter updates to avoid gradient oscillation. |
| Initial Learning Rate | 1e-4 | Adopts the adaptive learning rate strategy of the Adam optimizer, which decays with training epochs according to “cosine annealing” to prevent overfitting. |
| Maximum Number of Epochs | 200 | Combined with the Early Stopping strategy: training is terminated when the validation set accuracy does not improve for 5 consecutive epochs to avoid invalid iterations. |
| Optimizer | Adam | Momentum parameters: , ; weight decay coefficient: 1e-5, which suppresses overfitting of model parameters. |
| Privacy budget ceiling | 0.6 | It balances the contribution of “semantic similarity between hyperedge and risk template” and “proportion of hyperedge risk nodes” to the weight. |
| Olution Layers | 2 | Prevents gradient vanishing caused by an overly deep network |
| BiGRU Hidden Layer Dimension | 256 | Both the forward GRU and backward GRU have 256 dimensions, and finally output 512-dimensional node representations that integrate temporal features. |
To investigate the impact of the number of supergraph convolution layers (L) on model performance and validate the rationality of the current setting (2 layers), an ablation experiment was designed. Under the condition of maintaining all other parameters consistent with the main experiment, the number of supergraph convolution layers was set to 1, 2, 3, and 4 for comparison, with the results shown in Table 2.
Table 2 Performance of the proposed model with different numbers of hypergraph convolutional layers
| Number of Hypergraph | Accuracy | Precision | Recall | F1-Score | Training Time |
| Convolutional Layers (L) | (%) | (%) | (%) | (%) | per Epoch (s) |
| 1 | 91.2 | 90.8 | 91 | 90.9 | 42.1 |
| 2 | 93.1 | 92.9 | 93.2 | 93.1 | 45.2 |
| 3 | 92.5 | 92.1 | 92.4 | 92.2 | 48.7 |
| 4 | 91.8 | 91.4 | 91.7 | 91.5 | 52.3 |
As shown in Table 2, the model with achieves the best performance across all metrics. A single layer yields inferior results, indicating insufficient aggregation of multi-hop neighborhood information. Increasing the depth to and leads to a performance decline, likely due to the over-smoothing effect where node features become overly homogenized, thereby reducing discriminative power. Furthermore, training time increases with depth. Therefore, is selected as it provides the optimal balance between model expressiveness for capturing complex high-order associations and computational efficiency. This empirical analysis validates our architectural choice and offers a reference for future research in hypergraph learning design. To evaluate the impact of BiGRU hidden layer dimensions on model performance and generalization ability, the study fixed the hypergraph convolution layer count at 2 while varying the hidden layer dimensions (DhDh) of BiGRU to 128,256,384, and 512 for comparison. The results are presented in Table 3.
Table 3 Performance comparison of the model with different BiGRU hidden layer dimensions
| BiGRU Hidden | Accuracy | Precision | Recall | F1-Score | Train/Validation |
| Layer Dimension | (%) | (%) | (%) | (%) | Accuracy Gap (%) |
| 128 | 92.1 | 91.7 | 92 | 91.8 | 1.5 |
| 256 | 93.1 | 92.9 | 93.2 | 93.1 | 1.8 |
| 384 | 92.8 | 92.5 | 92.7 | 92.6 | 2.5 |
| 512 | 92.5 | 92.2 | 92.4 | 92.3 | 3.1 |
As shown in Table 3, the model achieves optimal overall performance on the test set when the dimensionality is set to 256. At 128 dimensions, the model may lack sufficient capacity, resulting in incomplete feature extraction and a slight performance decline. When dimensions increase to 384 and 512, while the model’s performance on the training set continues to improve, its test set performance shows a noticeable drop. The significant widening gap between training and validation set accuracy rates indicates overfitting – where excessive parameter capacity causes the model to memorize noise in training data rather than general patterns. The 256-dimensional configuration strikes a balance: it provides adequate expressive power while effectively controlling overfitting risks through early stopping and weight decay strategies, ultimately achieving the best generalization performance. Comparative models include Spatio-Temporal Graph Neural Network (ST-GNN), Traditional Graph Attention Network (GAT), and related studies (references [21] and [22]). Figure 7 shows the convergence curves of financial data security risk prediction for each model. Figures 7(a) and 7(b) show the convergence curves of accuracy and false positive rate.
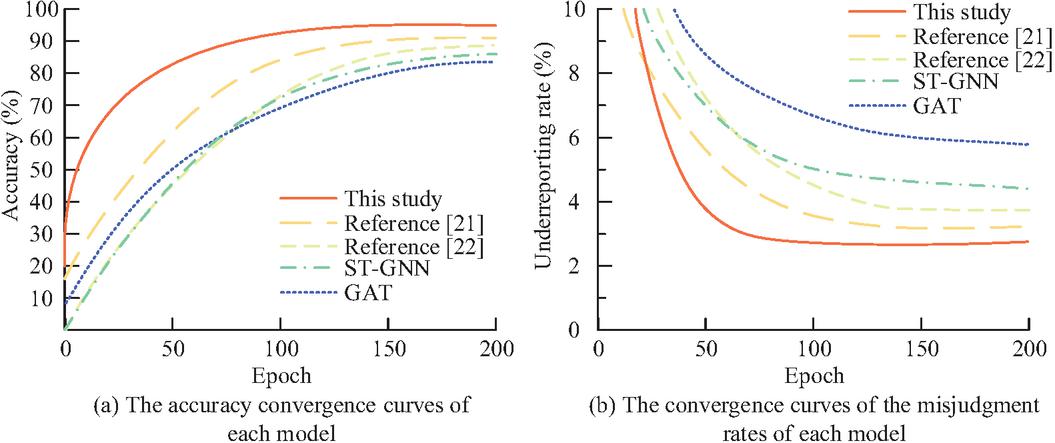
Figure 7 Convergence curves of financial data security risk prediction for each model.
In Figure 7(a), the convergence speed of the research model is faster, entering the performance stability stage earlier, and ultimately achieving an accuracy of 93.1% on the financial dataset, which is 9.2% higher than GAT (83.9%) and also better than ST-GNN (86.7%), reference [21] (90.8), and reference [22] (89.6%). In Figure 7(b), the final false positive rate of the research model is only 2.8%, which is much lower than the traditional model. This is thanks to the hyperedge weight optimization algorithm based on semantic similarity and risk contribution in the research model. This algorithm can effectively screen key risk features, reduce the interference of non critical hyperedges on model decision-making, and thus lower the probability of erroneous warnings.
Figure 8 shows the prediction results of various models for different risk categories. Figures 8(a)–8(c) show the comparison of precision, recall, and F1 values for each model. Categories 1 to 8 are market volatility risk, compliance risk, credit default risk, liquidity risk, operational risk, information disclosure risk, profitability risk, and policy risk.
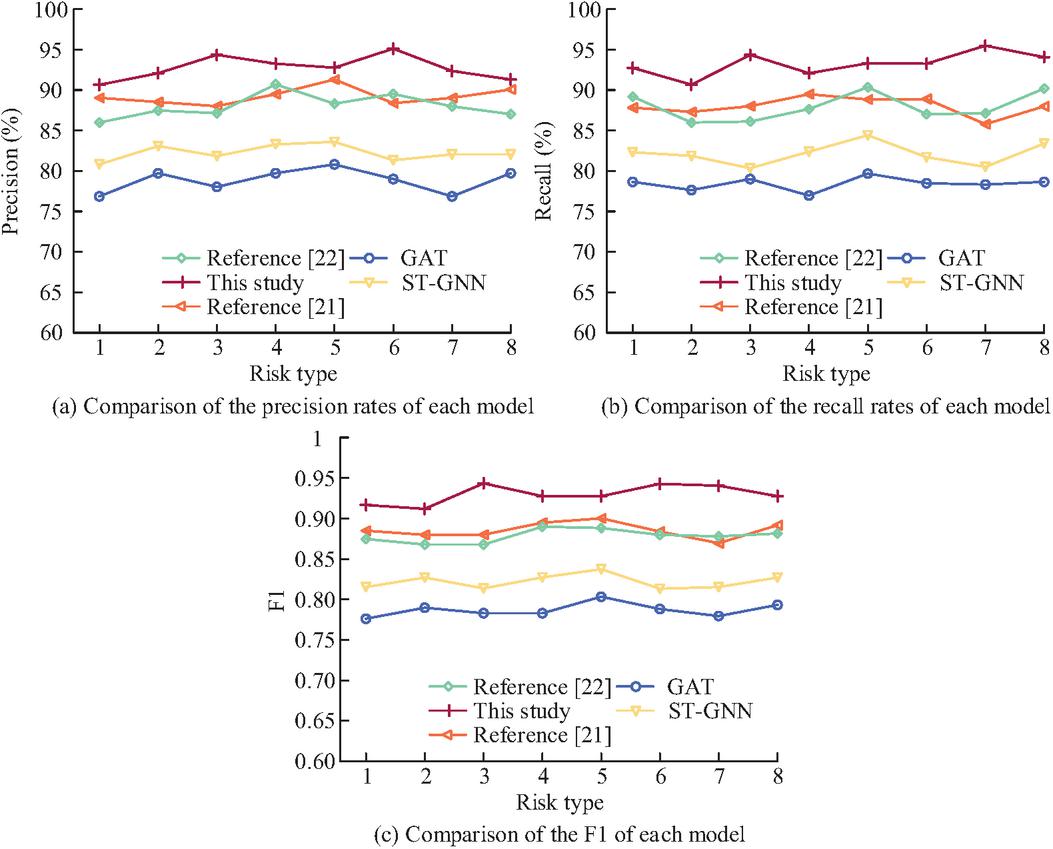
Figure 8 Predictions of different models for different risk categories.
In Figure 8(a), the research model achieves a precision of over 90% in predicting class risks, with an average recognition precision of 92.9%, which is higher than GAT (79.2%), ST-GNN (82.5%), reference [21] (88.7%), and reference [22] (87.4%). Especially in risk categories with complex semantic associations such as compliance risk and information disclosure risk, the advantages of research methods are more obvious. This is because hypergraphs can efficiently capture the semantic associations of multiple nodes in financial report texts, combined with hyperedge weight optimization algorithms to accurately screen key risk features, reduce non risk information interference, and improve the accuracy of risk prediction. In Figure 8(b), the research model also leads overall in the recall rate of 8 types of risks, with an average recall rate of 93.2%, higher than GAT (79.6%), ST-GNN (83.1%), reference [21] (88.5%), and reference [22] (87.7%). In Figure 8(c), the average F1 value of the research method reaches 93.1%, demonstrating that the research method achieves a good balance between accurately identifying real risks and avoiding false positives, and has the best overall risk prediction performance.
To evaluate the model’s temporal stability and generalization capacity across different macroeconomic environments, the study collected financial report meeting transcripts from A-share listed companies between 2015 and 2018 using the same data platform. This period represents a relatively stable economic growth cycle prior to the pandemic. The dataset contains 3,412 valid samples, all processed through the same preprocessing and annotation procedures as the main experiment. Table 4 presents the risk prediction accuracy of our model versus key benchmark models under the two cross-cycle testing scenarios.
Table 4 Risk prediction accuracy across different economic cycles (%)
| Training: 2019–2023 | Training: 2015–2018 | ||
| (Pandemic Period) | (Normal Period) | Average | |
| Testing: 2015–2018 | Testing: 2019–2023 | Cross-Cycle | |
| Model | (Normal Period) | (Pandemic Period) | Accuracy |
| ST-GNN | 81.3 | 80.1 | 80.7 |
| GAT | 78.5 | 77.8 | 78.1 |
| Literature [21] | 85.6 | 84.9 | 85.3 |
| Literature [22] | 84.1 | 83.5 | 83.8 |
| Proposed Model | 89.1 | 88.4 | 88.8 |
As shown in Table 4, while the average accuracy of our model (88.8%) slightly decreased compared to the same-period test (93.1%) in two cross-cycle tests spanning significantly different economic cycles, the decline (4.3 percentage points) was the smallest. This demonstrates that the high-order semantic associations and temporal dynamic patterns learned by our model exhibit strong cross-cycle robustness. Traditional graph models (ST-GNN, GAT) and recently proposed methods show more pronounced performance degradation in cross-cycle tests (averaging 7–12 percentage points), indicating their greater susceptibility to specific economic cycle patterns in training data. The model’s advantage lies in its core hypergraph structure, which captures deeper semantic associations of corporate risks beyond surface-level cyclical fluctuations (e.g., the correlation between “executive evasive responses” and “compliance risks”), demonstrating universality across different cycles. Additionally, BiGRU’s modeling of temporal dynamics helps the model adapt to varying risk evolution rhythms across different cycles.
To further validate the superior performance of the hypergraph learning model proposed in this study in capturing complex semantic relationships in financial texts, the research compares four state-of-the-art text-based models – BERT, FinBERT, TextCNN+BiLSTM, and RoBERTa – as baselines. All models were trained and tested on the same dataset using concatenated full transcripts of earnings calls (including presentations and Q&A sessions) as input. The overall performance comparison of these models in financial data security risk prediction tasks is presented in Table 5.
Table 5 Overall performance comparison of various models on financial data security risk prediction
| Model | Accuracy (%) | Precision (%) | Recall (%) | F1-Score (%) |
| BERT | 89.4 | 87.9 | 88.1 | 88.0 |
| FinBERT | 90.1 | 88.5 | 88.8 | 88.6 |
| TextCNN+BiLSTM | 88.7 | 86.3 | 86.9 | 86.6 |
| RoBERTa | 90.8 | 89.1 | 89.3 | 89.2 |
| Proposed Model | 93.1 | 92.9 | 93.2 | 93.1 |
As shown in Table 5, our model outperforms all competing models in accuracy, precision, recall, and F1 score. Notably, it achieves 2.3 to 3.7 percentage points higher accuracy than Transformer-based pre-trained models (BERT, FinBERT, RoBERTa), with an even more significant improvement compared to the text-specific TextCNN+BiLSTM model. This demonstrates that relying solely on powerful sequence modeling architectures (e.g., Transformers) or traditional text feature extraction methods cannot fully capture the high-order semantic relationships formed by multi-party interactions and multi-round Q&A in earnings calls. By explicitly modeling complex multi-node relationships through hypergraph structures and incorporating BiGRU to capture temporal dynamics, our approach achieves more comprehensive risk feature extraction and more accurate predictions.
3.2 Performance Analysis of Financial Data Privacy Protection Methods
To verify the performance of hierarchical privacy protection strategies based on differential privacy, this study compares traditional methods such as generalized anonymity and fixed budget differential privacy, and evaluates the effectiveness of the research methods from dimensions such as data utility and scenario compliance. The experimental environment is the same as in Section 2.2, with an adjustment coefficient of 0.1, a relaxation parameter of 10-5, and a smoothing factor of 0.9. The weight of the integrity score is 0.4, the weight of the consistency score is 0.3, the weight of the correlation score is 0.3, and the budget ceiling is 0.6. Figure 9 shows the data utility of various methods under different privacy budgets. Figures 9(a) and 9(b) show the relationship curves between privacy budget and data utility loss/information utilization rate.
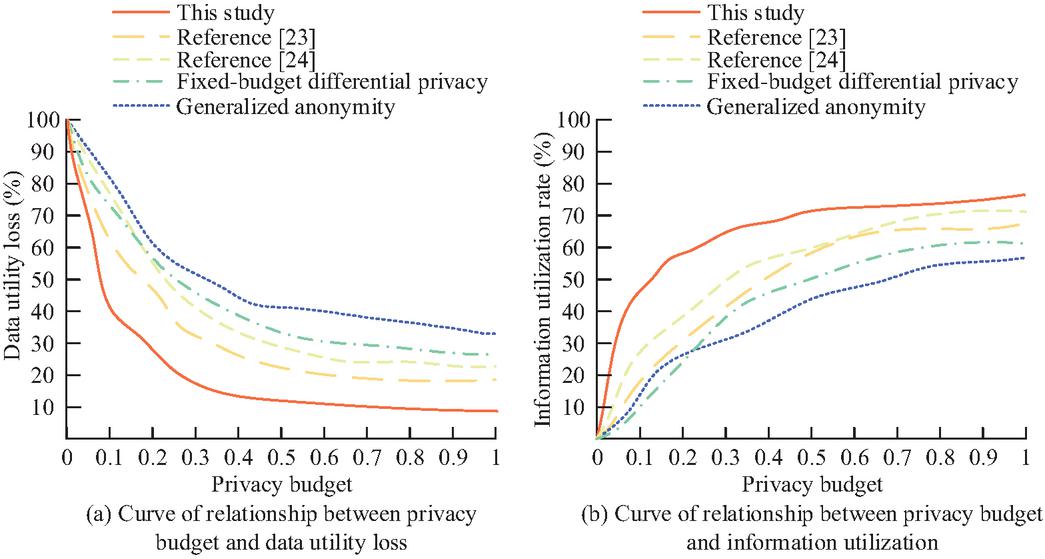
Figure 9 Data utility of each method under different privacy budgets.
In Figure 9(a), the utility losses of the three privacy protection methods all show a decreasing trend with increasing privacy budget. When the budget limit is 0.6, the utility loss of the research method is reduced to 11.3%, while traditional generalized anonymous methods, fixed budget differential privacy methods, and references [23] and [24] are 40.9% and 34.3%. The budget for research strategies slows down after exceeding 0.6 to avoid privacy risks caused by excessive budgeting. In Figure 9(b), when the budget is 0.6, the utilization rate of the research method reaches 73.2%, which is 25.3% higher than the traditional generalized anonymity method, reflecting the research strategy’s advantage in preserving the effective value of data under this budget.
Figure 10 shows the compliance rate and information utilization rate of privacy in various scenarios. Scenario numbers 1 to 6 refer to data transactions, internal auditing, cross-institutional collaboration, model sharing, regulatory reporting, and historical data archiving. Number 7 is the average of the six scenarios mentioned above. Figures 10(a) and 10(b) show the privacy compliance compliance rate and information utilization rate in various scenarios.
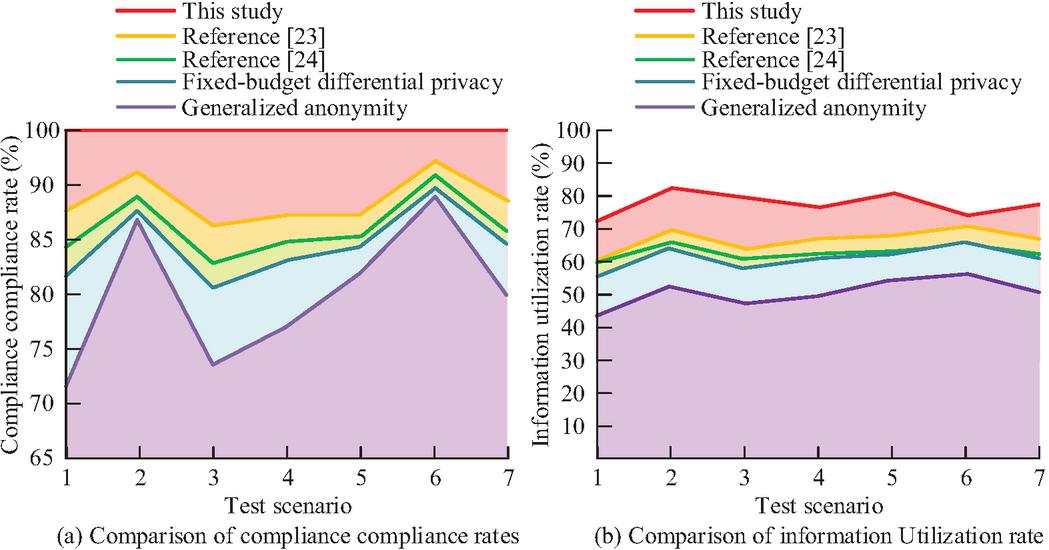
Figure 10 Privacy compliance compliance rates and information utilization rates in various scenarios.
In Figure 10(a), the hierarchical strategy based on differential privacy achieves a compliance rate of 100% in six scenarios including data transactions, internal auditing, and cross-institutional collaboration, meeting the compliance requirements of the financial industry and outperforming other methods. The average compliance rate of traditional generalized anonymous methods is only 79.9%. The average values of the fixed budget differential privacy method, reference [23], and [24] methods are 84.6%, 85.1%, and 87.4%, which cannot achieve full scenario compliance. In Figure 10(b), the average information utilization rate of the research strategy is 77.1%, while the other four methods have an average of only 51.3%, 65.3%, 62.9%, and 65.1%. This indicates that research strategies can maximize the utility of data retention while ensuring compliance.
To further quantify the performance differences between research methods and various comparative methods, this study compares the test results of each method on different performance indicators, as shown in Table 6. The “Risk Prediction Model Precision Retention Rate” metric in Table 6 measures how well data availability preserves model training outcomes after privacy-preserving measures are applied. The calculation involves retraining the model with privacy-processed data (e.g., through noise addition), then dividing the test-set accuracy by that of a baseline model trained on original undisturbed data. A higher retention rate indicates the privacy-preserving method minimizes disruption to data’s inherent patterns and utility while masking sensitive information, thereby better maintaining analytical value under strict privacy constraints.
Table 6 Comparison results of performance indicators
| Fixed-Budget | |||||
| Performance | This | Generalized | Differential | Reference | Reference |
| Indicators | Study | Anonymity | Privacy | [23] | [24] |
| Differential Privacy Epsilon Value | 0.38 | No Differential Privacy Mechanism | 0.52 | 0.65 | 0.71 |
| Risk Prediction Model Accuracy Retention Rate (%) | 92.7 | 75.3 | 84.5 | 81.2 | 79.6 |
| Sensitive Information Leakage Probability (%) | 0.85 | 6.32 | 2.17 | 2.89 | 3.54 |
| Average Noise Injection Intensity | 0.82 | No Noise Mechanism | 1.15 | 1.32 | 1.45 |
| Gradient Clipping Adaptability | Adaptive (Dynamically Adjust Threshold Based on Gradient Distribution) | No Gradient Processing | Fixed Threshold (Q 2.0) | Semi-Adaptive (Only Adjust Threshold for High-Sensitivity Data) | Fixed Threshold (Q 2.5) |
| Training Time per Epoch (s) | 45.2 | 32.8 | 41.5 | 48.7 | 51.2 |
In Table 6, the differential privacy epsilon value of the research method is the smallest (0.38), indicating that its privacy protection strength is the highest, while the epsilon values in references [23] and [24] are both greater than 0.6. The accuracy retention rate of the risk prediction model reaches 92.7%, which is much higher than the traditional generalized anonymous method (75.3%). This indicates that the data processed by the research strategy can still effectively support the training of the risk prediction model, and the data availability is stronger. The probability of sensitive information leakage is only 0.85%, far lower than traditional methods (6.32%), and 70% lower than reference [24] (3.54%), significantly reducing the risk of financial sensitive data leakage. In addition, the training time of the research strategy is still lower than that of references [23] and [24], taking into account privacy and security, data availability, and training efficiency, which is more suitable for the needs of financial scenarios. The hierarchical privacy protection strategy proposed in this study operates within a federated learning framework. Its practical deployability depends not only on the privacy-utilization trade-off but is also constrained by cross-client network communication conditions. To evaluate the impact of communication overhead and network fluctuations on the system, the research simulated five typical client network bandwidth scenarios under fixed total privacy budget (0.6) and model parameter quantities, while accounting for the effects of varying client numbers and average packet loss rates. The results are presented in Table 7.
Table 7 Training efficiency evaluation under different network conditions
| Avg. | Rounds | Total | Final | ||
| Number | Comm. | to | Training | Model | |
| Network | of | Time Per | Target | Time | F1-Score |
| Condition | Clients | Round (s) | Performance | (min) | (%) |
| High Bandwidth (100 Mbps) | 10 | 1.2 | 48 | 1 | 92.8 |
| Medium-High Bandwidth (50 Mbps) | 10 | 2.5 | 49 | 2 | 92.6 |
| Medium Bandwidth (10 Mbps) | 10 | 5.8 | 50 | 4.8 | 92.5 |
| Medium-Low Bandwidth (5 Mbps) | 10 | 11.5 | 52 | 10 | 92 |
| Low Bandwidth (2 Mbps) | 10 | 28.5 | 55 | 26.1 | 91.7 |
| High Bandwidth (100 Mbps) | 50 | 5 | 45 | 3.8 | 92.9 |
| Medium Bandwidth (10 Mbps) | 50 | 28 | 48 | 22.4 | 92.3 |
| Low Bandwidth (2 Mbps) | 50 | 135 | 60 | 135 | 90.5 |
As shown in Table 7, the model demonstrates robust accuracy, maintaining an F1 score above 90.5% across varying bandwidths and client scales. This confirms the core algorithm’s reliable predictive performance under diverse network conditions. The model also exhibits strong convergence stability, requiring minimal changes in training rounds to achieve target performance. This indicates that the adaptive privacy budget and gradient clipping mechanisms effectively ensure stable training without being affected by network fluctuations. Furthermore, the system demonstrates scalability. Although total training time significantly increases under extreme low-bandwidth, multi-client scenarios – a inherent challenge for distributed systems – the proposed framework successfully converges under these conditions. Its modular design also lays the foundation for future communication optimizations such as integrated gradient compression and asynchronous aggregation.
4 Summary
To improve the accuracy of financial data security risk prediction and the effectiveness of privacy protection for listed companies, this study constructed a risk prediction model through hypergraph learning, optimized the hyperedge weight algorithm to mine complex relationships in multi-dimensional data, and integrated BiGRU to achieve dynamic prediction. A layered protection strategy based on differential privacy was designed, which adaptively allocated privacy budget according to data sensitivity, and combined gradient pruning and noise injection to ensure privacy. On the financial report text dataset of 1,168 listed companies, the accuracy of risk prediction reached 93.1%, which was 9.2% higher than traditional graph attention networks. The omission rate was controlled at 2.8%, and 8 potential threats such as market volatility and compliance risks were successfully identified. When the budget was 0.6, the data utility loss for privacy protection was only 11.5%, and the information utilization rate was 25.3% higher than that of generalized anonymous methods. Six scenarios, including data transactions and cross-institutional collaboration, all meet financial privacy compliance requirements. The study’s key contribution lies in establishing a closed-loop system of “risk awareness, privacy protection, and compliant utilization” through the coordinated design of risk prediction models and layered privacy protection strategies. This approach achieves full-process coverage from risk feature mining and dynamic early warning to data security collaboration and compliant utilization, providing financial institutions with an integrated solution that combines security monitoring and privacy control. Traditional Value at Risk (VaR)/Exposure-Sensitive (ES) models focus on quantifying the probability and scale of tail events in potential losses, predicated on effective risk factor identification. This study, however, emphasizes front-end risk source detection – intelligently mining root semantic signals (e.g., disclosure flaws, compliance issues) that may trigger various losses from massive, heterogeneous financial texts. Methodologically, while conventional models rely on statistical relationships of historical prices, this research directly models high-order semantic associations and dynamic patterns of risk formation through hypergraphs, expanding from “numerical statistical induction” to “semantic process analysis.” In practice, the data security risks identified by this method often directly trigger market risks (e.g., stock price volatility, VaR increases). Therefore, this study provides forward-looking, interpretable risk factor inputs for dynamically calibrating traditional risk models, achieving a closed-loop synergy between “intelligent early warning” and “precision measurement.”
However, current research has not fully integrated multimodal information such as transaction records and market public opinion. Future work can explore multimodal data fusion frameworks, combine knowledge graph technology to construct dynamic risk propagation models. In terms of privacy protection, blockchain technology can be further introduced to utilize its smart contracts for automatic negotiation of privacy budgets across institutions, transparent execution of gradient aggregation rules, and tamper-proof records. This enhances the credibility of collaboration and audit transparency in decentralized environments, providing technical support for building a trustworthy financial data collaboration ecosystem.
References
[1] Wang J, Zhou L, Jiang C, Wang Z. Modeling and Interpreting the Propagation Influence of Neighbor Information in Time-Variant Networks with Exemplification by Financial Risk Prediction. Journal of Management Information Systems, 2025, 42(1): 105–142. DOI: 10.1080/07421222.2025.2452016.
[2] Yuan L, Duan M, Xiao G, Tang Z, Li K. BM-FL: A Balanced Weight Strategy for Multi-Stage Federated Learning Against Multi-Client Data Skewing. IEEE Transactions on Knowledge and Data Engineering, 2024, 36(9): 4486–4498. DOI: 10.1109/TKDE.2024.3372708.
[3] He Y, Tai W, Zhou F, Yang Y. Exploring Hypergraph of Earnings Call for Risk Prediction (Student Abstract). Proceedings of the AAAI Conference on Artificial Intelligence, 2024, 37(13): 16226–16227. DOI: 10.1609/aaai.v37i13.26973.
[4] Wang S, Dong Y, Zhang B, Chen Z, Fu X, He Y, Shen C, Zhang C, Chawla N V, Li J. Safety in Graph Machine Learning: Threats and Safeguards. ArXiv, 2024. DOI: 10.48550/arXiv.2405.11034.
[5] Das S, Huang X, Adeshina S, Yang P, Bachega L. Credit Risk Modeling with Graph Machine Learning. INFORMS Journal on Data Science, 2023, 2(2): 197–217. DOI: 10.1287/ijds.2022.00018.
[6] Wang Z, Jiang C, Zhao H. Depicting Risk Profile Over Time: A Novel Multiperiod Loan Default Prediction Approach. MIS Quarterly, 2023, 47(4): 1455–1485. DOI: 10.25300/MISQ/2022/17491.
[7] Effendi F, Chattopadhyay A. Privacy-Preserving Graph-Based Machine Learning with Fully Homomorphic Encryption for Collaborative Anti-Money Laundering. International Conference on Security, Privacy, and Applied Cryptography Engineering, 2024, pp. 80–105. Springer Nature Switzerland, Cham. DOI: 10.1007/978-3-031-80408-3_6.
[8] Jia J, Yang L, Wang Y, Sang A. Hyper Attack Graph: Constructing a Hypergraph for Cyber Threat Intelligence Analysis. Computers & Security, 2025, 149: 104194. DOI: 10.1016/j.cose.2024.104194.
[9] Xu X. Empirical asset pricing based on network big data mining and privacy protection. Neural Computing and Applications, 2025, 37(12): 7841–7855. DOI: 10.1007/s00521024101108.
[10] Matalobos Veiga J M, Criado R, Romance Del Rio M, Iglesias Perez S, Partida Rodriguez A, Hanumanthappa Manjunatha K K. A Hypergraph-based Model for Cyberincident-related Data Analysis. In Proceedings of the 2024 European Interdisciplinary Cybersecurity Conference, 2024: 161–162. DOI: 10.1145/3655693.3661300.
[11] Mohapatra D, Bhoi S K, Jena K K, Sahoo K S, Nayyar A, Shah M A. Rank-Label Anonymization for the Privacy-Preserving Publication of a Hypergraph Structure. IEEE Access, 2022, 10: 118253–118267. DOI: 10.1109/ACCESS.2022.3219107.
[12] Li Z, Wang C, Wang X, Chen Z, Li J. HJE: Joint Convolutional Representation Learning for Knowledge Hypergraph Completion. IEEE Transactions on Knowledge and Data Engineering, 2024, 36(8): 3879–3892. DOI: 10.1109/TKDE.2024.3365727.
[13] Yang Y, Qin Y, Fan Y, Zhang Z. Unlocking the Power of Voice for Financial Risk Prediction: A Theory-Driven Deep Learning Design Approach. MIS Quarterly, 2023, 47(1): 63–96. DOI: 10.25300/MISQ/2022/17062.
[14] Huang J, Lei F, Jiang J, Zeng X, Ma R, Dai Q. Multi-Order Hypergraph Convolutional Networks Integrated with Self-Supervised Learning. Complex & Intelligent Systems, 2023, 9(4): 4389–4401. DOI: 10.1007/s40747-022-00964-7.
[15] Su L, Gan Z, Wang J, Li X. Structural Complementary Hypergraph Defense Framework against Adversarial Attacks. Knowledge-Based Systems, 2025, 114897. DOI: 10.1016/j.knosys.2025.114897.
[16] Yuan H, Xu J, Huang R, Song M, Wang C, Yang Y. Can Graph Neural Networks Expose Training Data Properties? An Efficient Risk Assessment Approach. Advances in Neural Information Processing Systems, 2024, 37: 69361–69385. DOI: 10.52202/079017-2215.
[17] Tai B, Tsou Y, Li S, Huang Y, Tsai P, Tsai Y. User-Driven Synthetic Dataset Generation With Quantifiable Differential Privacy. IEEE Transactions on Services Computing, 2023, 16(5): 3812–3826. DOI: 10.1109/TSC.2023.3287239.
[18] Liu J, Ge Z, Wang Y. Role of Environmental, Social, and Governance Rating Data in Predicting Financial Risk and Risk Management. Corporate Social Responsibility and Environmental Management, 2024, 31(1): 260–273. DOI: 10.1002/csr.2567.
[19] Zhang P, Sun H, Zhang Z, Cheng X, Zhu Y, Zhang J. Privacy-Preserving Recommendations With Mixture Model-Based Matrix Factorization Under Local Differential Privacy. IEEE Transactions on Industrial Informatics, 2025, 21(7): 5451–5459. DOI: 10.1109/TII.2025.3555993.
[20] Markovic T, Leon M, Buffoni D, Punnekkat S. Random Forest with Differential Privacy in Federated Learning Framework for Network Attack Detection and Classification. Applied Intelligence, 2024, 54(17–18): 8132–8153. DOI: 10.1007/s10489-024-05589-6.
[21] Elhoseny M, Metawa N, Sztano G, Elhasnony I M. Deep Learning-Based Model for Financial Distress Prediction. Annals of Operations Research, 2025, 345(2–3): 885–907. DOI: 10.1007/s10479-022-04766-5.
[22] Li Z, Chen Y, Wang X, Yao L, Xu G. Multi-view GCN for Loan Default Risk Prediction. Neural Computing and Applications, 2024, 36(20): 12149–12162. DOI: 10.1007/s00521-024-09695-x.
[23] Chen C, Zhang X, Lin S, Chen X. MPGStack: Membership Privacy Protection on Graph Data via Model Stacking. IEEE Transactions on Dependable and Secure Computing, 2025, 22(4): 3723–3736. DOI: 10.1109/TDSC.2025.3541403.
[24] Asif H, Vaidya J, Papakonstantinou P A. Identifying Anomalies While Preserving Privacy. IEEE Transactions on Knowledge and Data Engineering, 2023, 35(12): 12264–12281. DOI: 10.1109/TKDE.2021.3129633.
Biographies

Zijie Zhou (09.2004–), Male, Undergraduate student studying at the School of International Economics and Trade, Central University of Finance and Economics. My major is International Trade and Financial Risk Management, and his current main research direction is international finance and macro-finance.

Tao Zhang (05.2003–), Male, Undergraduate student studying at the School of Computer Science and Engineering, Nanjing University of Science and Technology. My major is Computer Science and Technology, and his current main research directions are machine learning, deep learning and multimodality.
Journal of Cyber Security and Mobility, Vol. 14_6, 1533–1562
doi: 10.13052/jcsm2245-1439.1469
© 2026 River Publishers