Information Security Risk Assessment Based on Markov Chain Optimization SPA Model
Qi Liang
College of Computer Science and Cyber Security, Chengdu University of Technology, Chengdu, 610059, China
E-mail: Liangqi2024lq@163.com
Received 27 November 2025; Accepted 31 January 2026
Abstract
As a transformation of libraries combined with digital technology, digital libraries inevitably face risks such as hacker attacks and virus invasions. In order to reduce losses to users and platforms from information leakage, Information security risk assessment of digital libraries becomes an important topic. The traditional method of risk assessment always has a blind spot when assessing dynamic risk factors. Therefore, this paper constructs a fusion model based on Markov Chain optimized Set Pair Analysis model, which makes full use of the powerful function of Markov Chain and Set Pair Analysis in dealing with dynamic model with fuzzy factor. Experimental results show that when tested on the dataset, the model achieves an identification accuracy of 98.4%, an area under the curve of 0.95, and an F1 score of 0.98. Compared with other models, it not only has higher accuracy but also lower false alarm rates. These results indicate that the proposed risk assessment model is applicable and accurate in risk evaluation. It effectively addresses the difficulty of traditional methods in handling dynamic risk factors. The innovation of the model proposed in the research lies in the construction of a risk assessment framework that combines dynamic and static elements. Although the traditional set pair analysis method can handle the static correlations of risk factors, it is difficult to capture their dynamic evolution. The research achieved dynamic modeling and prediction of the risk situation through the state transition mechanism of Markov chains, and introduced the rough set theory to objectively allocate weights for risk indicators, overcoming the limitation of traditional methods where weights rely on subjective experience. Through Bayesian optimization and accelerated gradient strategies for adaptive parameter adjustment, the convergence speed and generalization ability of the model in complex risk environments were significantly improved. This framework not only realizes the deep integration of multiple algorithms at the functional level, but also achieves the unification of dynamics, objectivity and adaptability in the risk assessment of digital library information security, providing new methodological support for the analysis of high-dimensional and time-varying risks. The model proposed in the research, although performing well in terms of performance, involves integrating multiple algorithms, which leads to high computational complexity and high requirements for hardware resources and real-time performance. In practical deployment, it may encounter challenges in adapting to the high heterogeneity of digital library systems and the inconsistent data formats, and in the future, it needs to be further optimized in aspects such as lightweight deployment, cross-platform adaptation, and weak supervision learning.
Keywords: Markov chain, digital library, set pair analysis, information security, risk assessment.
1 Introduction
With the deepening of digitalization, digital libraries play an increasingly important role in knowledge dissemination and information services. Information security risk assessment is also a key link that guarantees the stable operation of the system. The assessment scope covers core security dimensions such as confidentiality, integrity, availability and user privacy. Assessment accuracy directly impacts data security and users’ trust in it [1]. Accurate assessments will offer very good early warnings of threats and provide scientific grounds for security strategies. Assessment bias may result in protection failure and cause security incidents [2]. Traditional assessment methods mainly depend on expert experience, static analysis, and local scanning, which have a series of limitations, such as strong subjectivity, poor dynamic adaptability, and information gaps [3]. Meanwhile, the current research on information security risk assessment in digital libraries still has significant deficiencies in dynamic risk detection, objective weight allocation, multi-source data integration, and system scalability. It is unable to cope with the increasingly complex security threats and digital service forms. Efficient and accurate information security risk assessment has thus become the current research focus. Computer development has made data-driven assessment models develop new potentials lately [4]. Among them, the combination of Markov Chain (MC) and Set Pair Analysis (SPA) constructs the MC-SPA model, which possesses advantages of dynamic prediction capability, strong adaptability to complex scenarios, and precise quantification [5]. Applying this model to the information security risk assessment of digital libraries can clearly reveal the key factors affecting assessment and construct a scientific evaluation system, so as to improve the efficiency and accuracy of risk assessment. For example, when dealing with typical risk scenarios such as DDoS attacks, user data breaches, illegal access, and service interruptions faced by digital libraries, this model can dynamically integrate multi-source data such as traffic anomalies, login behavior, and vulnerability intelligence to achieve real-time quantitative risk assessment and early warning. Based on the above considerations, this paper proposes a method for evaluating the information security risk of digital libraries by integrating the MC-SPA model. The goal is to maintain stable operation and provide scientific grounds for the information security risk assessment of digital libraries. In recent years, security risk assessment methods based on data-driven and machine learning have gradually become the mainstream, such as anomaly detection based on deep learning and risk propagation modeling using graph neural networks. In contrast, the proposed MC-SPA model by the research maintains the dynamic prediction capability while enhancing the interpretability and objectivity of weights in the assessment process through pair-wise aggregation analysis and rough set theory. It is more suitable for complex information system environments like digital libraries that require a balance between accuracy, interpretability, and dynamic adaptability. The innovation of this study lies in the integration of interdisciplinary methods. By combining Markov chains with set pair analysis, the risk state transition process is mathematically fused with static indicators. With the help of rough sets and optimization algorithms, subjective experience driven weight allocation is transformed into data-driven objective quantification. Finally, the high-dimensional risk features were mapped into a low dimensional interpretable space through visualization techniques, allowing for a visual representation of the dynamic risk evolution process and achieving dynamic assessment of library information risks. The integration of these methods in terms of systematicity, interpretability, and dynamism provides new ideas for current data-driven risk assessment research that lacks interpretability.
2 Related Work
The advantage of MC lies in its ability to quantify dynamic stochastic systems using mathematical simplicity. It demonstrated superiority in scenarios such as dynamic prediction and risk assessment. Scholars both domestically and internationally conducted studies on it. To predict the academic performance of students during their school years, Mallak S et al. raised a method combining MC and educational data mining. The method first collected students’ academic data for each semester, processed the data using MC, then selected a model for training, and finally obtained the prediction results [6]. Chen J et al. addressed the problem that epidemic models could not adapt to higher-order networks by proposing an effective MC method. In this method, nodes were classified according to the number of neighbors and hyperedges under different states, and the data were matched to achieve discontinuous variation in higher-order networks [7]. To predict land use rate, Tariq A et al. raised a network combining a cellular automata algorithm and MC. The network constructed a stochastic model using land use data, performed random sampling based on historical parameters, and used statistical distributions to achieve prediction [8]. SPA is strong in integrating deterministic and uncertain factors in risk analysis for comprehensive evaluation. To estimate regional water resource carrying capacity, Jin D T et al. proposed a model combining quadratic subtraction and SPA. The model first constructed an indicator system for water resource carrying capacity, determined weights using quadratic subtraction, processed indicator uncertainty with SPA, calculated connection numbers, and finally performed a comprehensive evaluation of water resource carrying capacity [9]. To address clinical case differences, Kobayashi K et al. raised a composite SPA method. The method established a clinical case indicator set and a reference indicator set, calculated identity and difference degrees to construct coefficients, and finally quantified case differences for classification [10].
Information security risk assessment often serves as a balancer in various scenarios. High precision promotes positive cycles, while low precision triggers systemic crises. Scholars conducted research on multiple scenarios. In the risk assessment of coronary heart disease, Wang J et al. proposed a model combining cloud and forest models. The model collected coronary heart disease data, processed data uncertainty using the cloud model, trained data with the forest model, and finally output risk assessment results [11]. Amarnadh V et al. proposed an adaptive binary spiking marine predator neural network to evaluate the bank loan credit risk effectively. The network first collected customer data and processed it with adaptive binarization. Then, it optimized network parameters using the spiking marine predator algorithm, built an assessment model, and produced risk scores from input data [12]. The small and medium-sized enterprise networks are under attack, and Sukumar A et al. proposed a multi-criteria decision analysis method for risk assessment. This method determines network attack assessment indicators, constructs a multi-criteria decision matrix for quantifying indicators’ weights, and offers a comprehensive risk level assessment [13]. Choudhary N A proposed a multivariate ideal-anti-ideal solution distance-based method to evaluate supply chain management risks. After determining the assessment indicators, this method constructed a decision matrix, standardized the data, calculated indicator weights, and determined ideal and anti-ideal distances, ranked the risk level [14]. Park S et al. proposed a risk assessment matrix against the instability problem in autonomous driving. The matrix first identified the instability factors of the autonomous driving, divided the risk occurrence probability, constructed a matrix to locate the coordinates of the risk, and finally output the risk assessment report [15].
In summary, the MC-SPA algorithm demonstrated unique advantages in risk assessment and handling complex indicator systems, providing a new approach for multidimensional risk evaluation. Although existing studies on digital library information security risk assessment made progress in system construction, they still had limitations, such as lag in real-time risk data collection, strong subjectivity in assessment indicator weights, and insufficient quantitative analysis of dynamic risk features. Therefore, this study raised a method combining the MC-SPA algorithm with digital library information security risk assessment. The aim was to enhance the comprehensive handling of risk indicators and dynamic weight optimization, further improving the accuracy and timeliness of risk assessment and providing scientific decision support for digital library security management.
3 Model Construction for Information Security Assessment Based on MC-SPA
3.1 Optimization Design of RE-based MC-SPA Fusion Algorithm
When assessing library information security risk, SPA constructs the set-pair relationship of information security risk indicators and quantifies the association characteristics of risk factors by determining indicators [16]. MC uses its state transition features to model the dynamic evolution process of risk states. By calculating the transition probability matrix of each risk state, it obtains the evolution pattern of risks and achieves scientific evaluation of information security risks [17]. The study considers that SPA can effectively handle the uncertainty relationship among risk indicators, while MC enhances timeliness and accuracy of risk assessment through dynamic updates of state transition probabilities. Therefore, the study raises the MC-SPA fusion algorithm, and its operation process is shown in Figure 1.
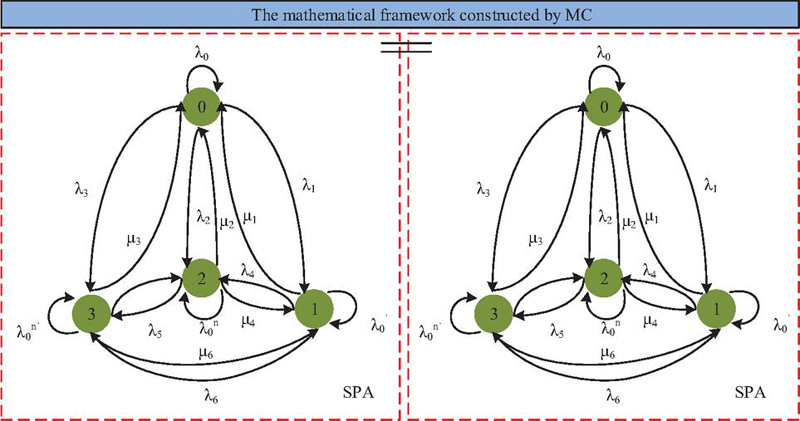
Figure 1 MC-SPA fusion algorithm structure mechanism.
As shown in Figure 1, according to the SPA method, the states are divided into two pairs: 0–2 and 1–3, forming four types of states. MC constructs a mathematical framework based on SPA. According to SPA theory, all fully compliant indicators form a standard set. The actual obtained indicator set is compared with the standard set to establish the connection degree indicator, as shown in Equation (1).
| (1) |
In Equation (1), is the connection degree, is the total number of indicators in the standard set, is the number of indicators with identity in both actual and standard sets, is the number of indicators with opposition, represents the number of indicators with difference, is the difference coefficient, and is the opposition coefficient. After analyzing static factors using SPA, the MC links to analyze dynamic factors. In Figure 1, each of the four states transitions to another state with a certain probability. For example, 0 transitions to 1 with probability , and 1 transitions to 0 with probability . This state transition diagram can be represented as a matrix, forming the state transition matrix of the MC model, as shown in Equation (2).
| (2) |
In Equation (2), assuming there are difference features in period , then in period , features turn into identity, features remain as differences, features turn into opposition, and other matrix calculations proceed similarly. After multiple transitions, the system tends to stabilize, and the connection degree under stable state can be calculated to evaluate security risk, as shown in Equation (3).
| (3) |
In Equation (3), represents the random points of connection degree under stable state, is the average transition matrix, and is the unit matrix. Although the MC-SPA algorithm has advantages in handling fuzzy and stochastic factors, it relies on subjective judgment for indicator weights. Rough Set (RS) calculates decision dependence and other metrics to measure the influence of each attribute on decision results, thereby deriving objective weights for all attributes [18]. Therefore, this study introduces RS to strengthen MC-SPA in processing fuzzy and dynamic data. The RS procedure for determining risk factor weights is shown in Figure 2.
Figure 2 RS’s process for determining risk factor weights.
As shown in Figure 2, RS first determines assessment conditions and decision attributes, then partitions factors using indiscernibility relations, calculates attribute importance, and determines the weights of risk factors based on importance. The decision table is expressed in Equation (4).
| (4) |
In Equation (4), represents the universe, represents the attribute set, represents the set of attribute values, and represents the information function. During the calculation of attribute importance, lower and upper approximations are calculated, as shown in Equation (5).
| (5) |
In Equation (5), is the lower approximation, is the upper approximation, is the target set, and represents a random variable. After calculating attribute importance, normalization is applied to obtain the weights of all risk factors, as shown in Equation (6).
| (6) |
In Equation (6), and represent the minimum and maximum values, respectively. RS derives objective weights of indicators based on decision dependence and other calculations. MC-SPA evaluates feature events based on data computation. Therefore, this study integrates RS with MC-SPA to form the RS-MC-SPA fusion algorithm, and its network process is shown in Figure 3.
Figure 3 RS-MC-SPA fusion algorithm operation process.
As shown in Figure 3, when processing data, the RS-MC-SPA algorithm first analyzes data using SPA to initially determine the relationships among risk factors. Then MC and RS act jointly to further refine and deepen the association between risk elements. Finally, all analysis results are unified, combined with security risk probabilities to assess risk levels and analyze development trends. MC performs dynamic index evaluation of risk factors, as shown in Equation (7).
| (7) |
In Equation (7), is initial factors of class , and represents the total outgoing factors of class . After calculating risk factors, RS constructs a difference matrix to determine the number and relationships of risk factors. The difference matrix is expressed in Equation (8).
| (8) |
In Equation (8), represents the set of differential attributes between samples and , represents the set of conditional attributes, represents the value of sample on attribute , and represents the decision attribute value of sample . After determining risk factors, SPA performs weighted processing of data features, as shown in Equation (9).
| (9) |
In Equation (9), is the mid-value of interval elements in the judgment matrix, is the geometric mean, is the error distribution, and is the square of the weight median. During risk assessment in MC-SPA, the RE algorithm refines individual risk factors to explore nonlinear relationships among multiple factors. This compensates for the subjective judgment of weights in MC-SPA and improves the accuracy of risk assessment.
3.2 Construction of Information Security Risk Assessment Model
Although the RS-MC-SPA algorithm can evaluate information security risks, it still lacks quantitative analysis of limited risk factors in information extraction. Random Forest-Bayesian Optimization (RF-BO) is based on Bayesian theorem and introduces Gaussian processes as surrogate models for function fitting. It adapts parameters automatically to find the optimal solution with fewer experimental iterations [19]. Therefore, the study introduces RF-BO for quantitative analysis of local data. The RF-BO process is shown in Figure 4.
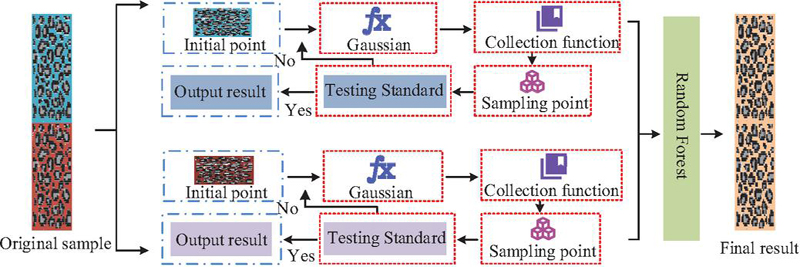
Figure 4 RF-BO operation flow chart.
As shown in Figure 4, when processing data, RF classifies the data while BO refines it. A Gaussian process serves as a surrogate model, continuously updating the next observation point through function evaluation and fitting a deep neural network model. The Gaussian process is calculated as shown in Equation (10).
| (10) |
In Equation (10), represents the mean function, usually set as 0, and represents the covariance function describing the correlation between two points . During data refinement, BO constructs a mathematical framework, as shown in Equation (11).
| (11) |
In Equation (11), represents the evaluation point, represents the historical observation set, represents the objective function value, and represents noise. Updating observation points in the framework is expressed in Equation (12).
| (12) |
In Equation (12), represents observed results, and represents the previous observation results. The RF-BO algorithm, as a global optimization method, maximizes the use of historical data to optimize evaluation efficiency, compensating for the original model’s weak capability in hyperparameter adjustment. However, BO relies heavily on prior knowledge, and inaccurate priors can lead to inaccurate posterior results, which is a limitation [20]. Therefore, the study introduces Nesterov Accelerated Gradient-Backpropagation Algorithm (NAG-BP) to optimize RF-BO. NAG-BP can learn and store extensive input-output mapping relationships, has strong ability to overcome local optima, adapts to complex networks, and does not depend on prior knowledge. The integration of RF-BO and NAG-BP forms the NAG-BP-RF-BO algorithm, and its operation process is shown in Figure 5.
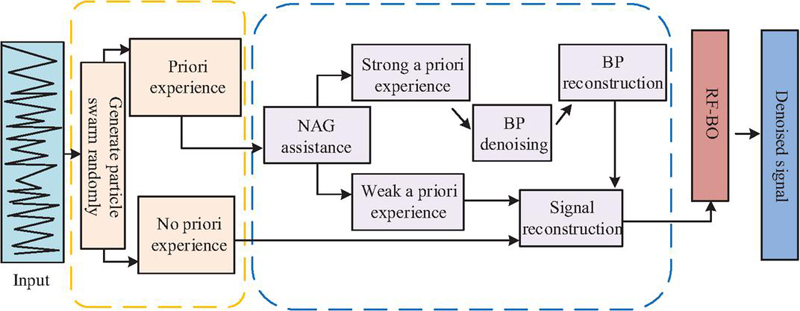
Figure 5 NAG-BP-RF-BO operation flow chart.
As shown in Figure 5, after receiving data, NAG-BP-RF-BO first determines whether prior knowledge exists. NAG assists BP in denoising data with prior knowledge. Processed data are input into the RF-BO module to obtain the final output. The BP layer assigns weights in a single hidden layer, as shown in Equation (13).
| (13) |
In Equation (13), represents input features, represents weights from input to hidden layer, represents bias, and represents the number of input neurons. After the hidden layer output, the data enter the output layer for denoising, as shown in Equation (14).
| (14) |
In Equation (14), represents the number of hidden layer neurons, represents weights from hidden to output layer, represents bias terms, and represents the activation function. In the RF-BO module, the input data are updated for weight adjustment, as shown in Equation (15).
| (15) |
In Equation (15), represents update momentum, and represents real-time weights. When processing data, NAG-BP-RF-BO first filters features with RF, then optimizes BP neural network training with NAG, while BO performs Bayesian optimization of network hyperparameters. Iterative updates enhance model performance. Combined with RS-MC-SPA, this improves the precision and timeliness of digital library information security risk assessment. Therefore, the study integrates NAG-BP-RF-BO with RS-MC-SPA to form the NBRB-RMS model. Its process is shown in Figure 6.
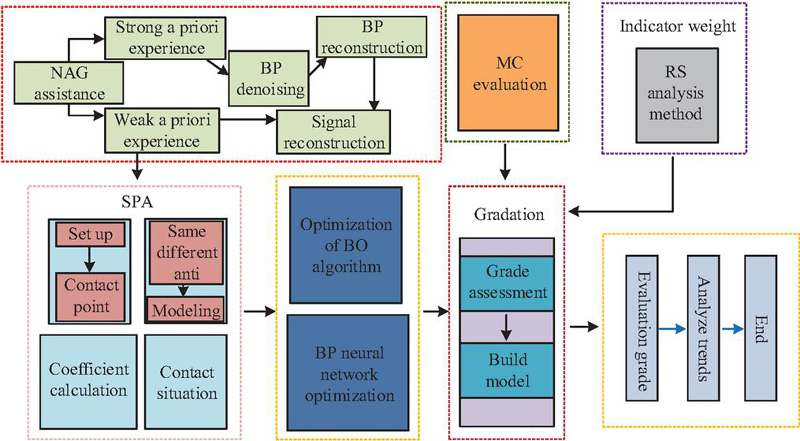
Figure 6 NBRB-RMS model operation flow chart.
In Figure 6, in the NBRB-RMS model, NAG accelerates BP network training. RF-BO screens data features. In the RS-MC-SPA module, RS collaboratively optimizes model parameters. MC quantifies risk uncertainty, and SPA extracts causal relationships among risk factors. This constructs a comprehensive assessment model and establishes a digital library information security risk assessment system. In summary, the NBRB-RMS model not only effectively handles complex data and nonlinear relationships in digital library information security risk assessment but also enhances accuracy and reliability through multi-algorithm collaboration, providing a scientific and efficient solution for evaluating digital library information security risks.
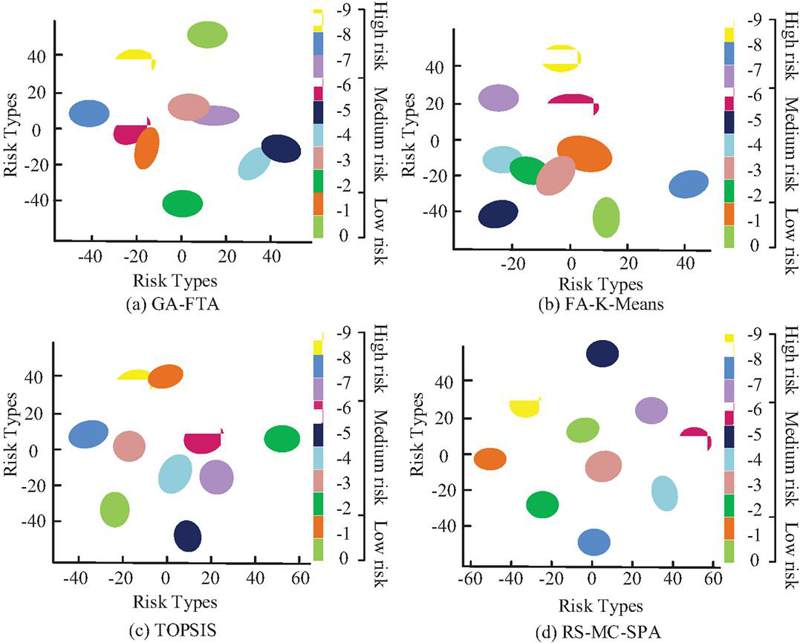
Figure 7 Classification results of various risk types.
4 Validation of RS-MC-SPA Information Security Risk Assessment Model
4.1 Effective Validation of RS-MC-SPA Algorithm
To verify the superiority of the RS-MC-SPA algorithm, the study compared it with Genetic Algorithm-Fault Tree Analysis (GA-FTA), Firefly Algorithm-K-Means Clustering (FA-K-Means), and Technique for Order Preference by Similarity to Ideal Solution (TOPSIS). The experimental system ran on Windows 10 with Pytorch as the deep learning framework, Python 3.8 as the programming language, AMD Ryzen 9 5900HX as the processor, and Pycharm as the IDE. To increase the credibility of results, the experiment used the KISA cybersecurity AI dataset (https://aihub.or.kr/aihubdata/data/view.do?dataSetSn=560) and DARPA network intrusion detection dataset (https://www.ll.mit.edu/r-d/datasets). Both datasets are publicly available real datasets, widely used in information security and intrusion detection research, with high authority and reproducibility. The study adopts a comparative experimental design, comparing the proposed RS-MC-SPA algorithm with traditional methods such as GA-FTA, FA-K-Means, and TOPSIS. The algorithm performance is verified using KISA and DARPA datasets, and the classification and prediction capabilities of each algorithm are evaluated. The four algorithms were visualized with t-SNE (t-distributed Stochastic Neighbor Embedding) and tested on multiple digital risk types. The results are shown in Figure 7.
As shown in Figure 7(a), the GA-FTA algorithm produced poor results. The five middle risk features were intermixed to varying degrees, failing to capture relationships among data, and the classification accuracy was 81%. Figure 7(b) visualized FA-K-Means results, showing only three risk features separated from the chaotic center, with a classification accuracy of 78%. Figure 7(c) showed that TOPSIS extracted data features relatively well, achieving 91% accuracy. Figure 7(d) demonstrated that RS-MC-SPA effectively identified all risk features, with high aggregation of similar types, achieving a classification accuracy of 98%, far exceeding the comparison models. These results indicated that RS-MC-SPA accurately extracted target features and possessed strong fitting ability. To further demonstrate the superiority of RS-MC-SPA, the study tested accuracy and loss on the KISA dataset for the four algorithms. The results are shown in Figure 8.
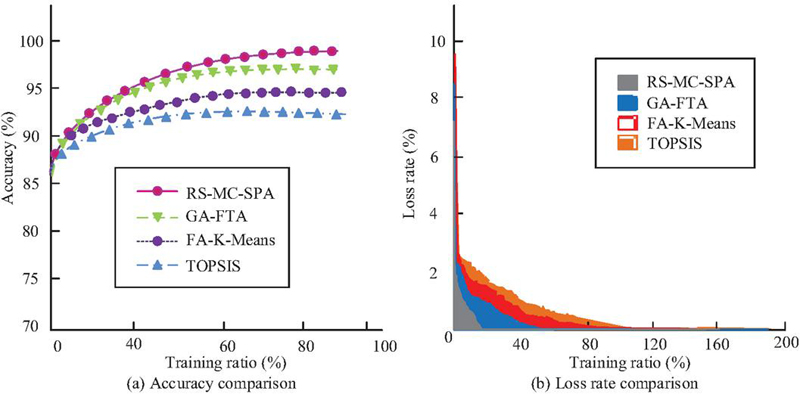
Figure 8 Comparison of accuracy and loss rate results.
As shown in Figure 8(a), as the proportion of training data increased, RS-MC-SPA maintained high prediction accuracy, reaching 98.4% at full training, significantly higher than TOPSIS at 91.8%, FA-K-Means at 93.3%, and GA-FTA at 96.5%. Figure 8(b) showed that RS-MC-SPA converged the fastest, reaching 1.2% loss in only 26 iterations, close to zero, and maintained stability thereafter. Its convergence speed led the other three algorithms throughout all iterations. Overall, RS-MC-SPA demonstrated superior prediction accuracy and faster convergence. To further evaluate algorithm performance, the study compared the Area Under Curve (AUC) value and F1 scores of the four models on KISA and DARPA datasets. The results are shown in Figure 9.
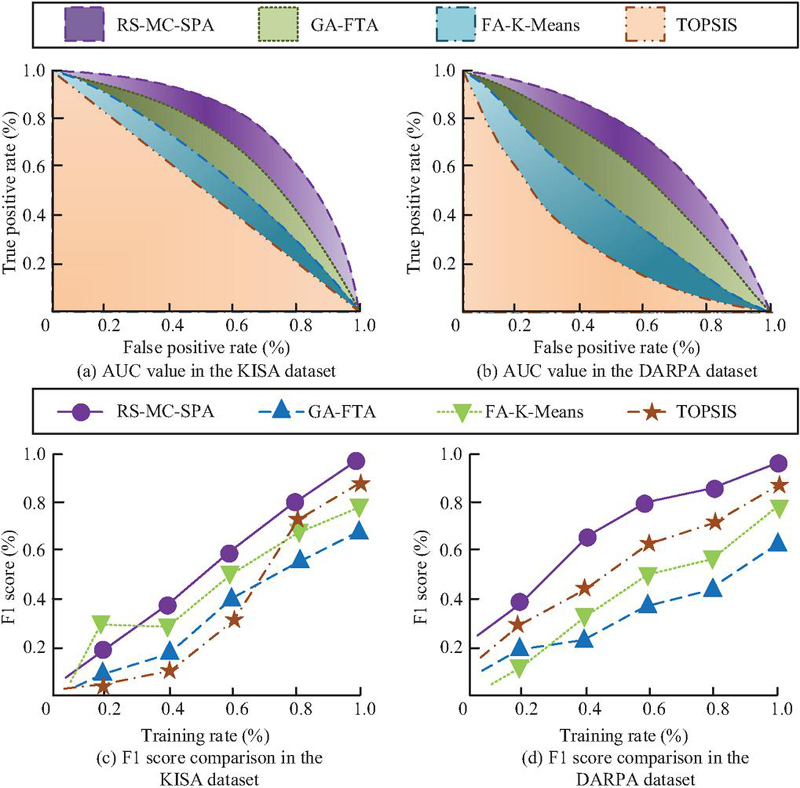
Figure 9 Comparison of AUC value and F1 score experimental results.
Figure 9(a) showed that larger AUC indicated faster convergence and better performance. On KISA, RS-MC-SPA achieved 0.95, while TOPSIS had the lowest AUC at 0.79, performing poorly. Figure 9(b) showed RS-MC-SPA reached 0.94 on DARPA, far higher than comparison models. Figure 9(c) showed that FA-K-Means initially had the highest F1 score at 0.35 but performed poorly overall, ending at 0.79. RS-MC-SPA reached 0.98. Figure 9(d) confirmed RS-MC-SPA’s F1 score at 0.98, while GA-FTA had the lowest at 0.62. These results indicated that RS-MC-SPA outperformed the other models in classification performance and robustness, confirming its accuracy and reliability in risk assessment.
4.2 Performance Analysis of NBRB-RMS Risk Assessment Model
After verifying RS-MC-SPA, the study further evaluated the performance of the NBRB-RMS risk assessment model constructed based on RS-MC-SPA. It compared NBRB-RMS with models built by GA-FTA, FA-K-Means, and TOPSIS. For efficient testing, the system ran on macOS with Python 3.9.2.15, NVIDIA Tesla A100 GPU, AMD Ryzen 7 CPU, RTX 3060 GPU, and 128GB memory. The NVD (https://nvd.nist.gov/) and CVE (https://cve.mitre.org/) datasets were used for credibility. Both datasets are publicly available real vulnerability data, which are commonly used for information security risk assessment and model validation. The study adopts a comparative experimental design and uses the NVD and CVE datasets to test the generalization ability of the model. NVD served as the training set and CVE as the validation set. Accuracy and loss were tested, as shown in Figure 10.
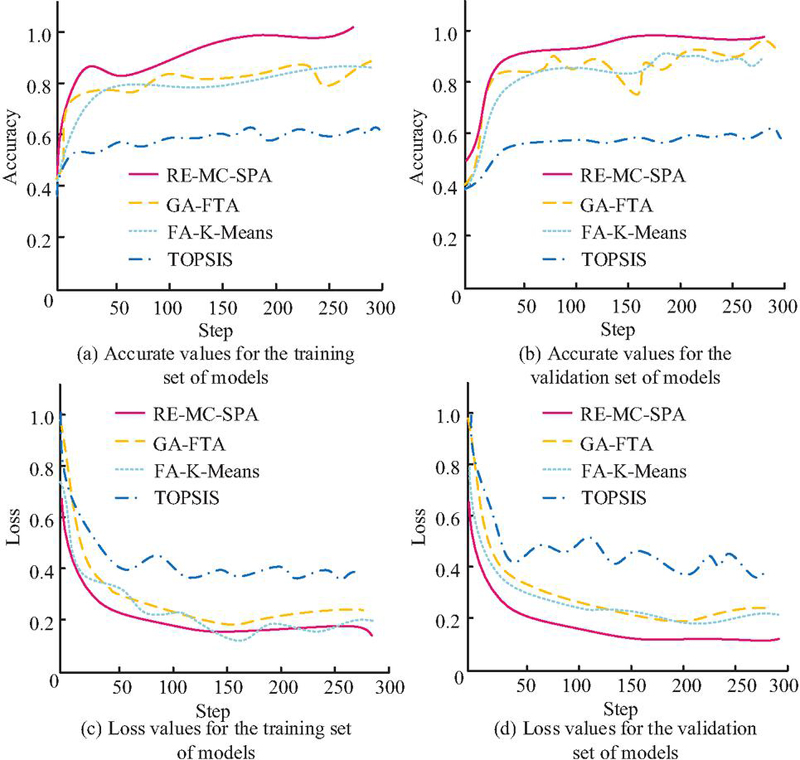
Figure 10 Comparison of accuracy and loss value test results.
Figures 10(a) and 10(b) showed that in training, NBRB-RMS achieved 0.98 accuracy, while validation was consistent at 0.97. Other models had lower accuracy, GA-FTA fluctuated, with 0.81 in training and 0.86 in validation. Figures 10(c) and 10(d) showed that NBRB-RMS consistently had the lowest loss in both sets, requiring fewer iterations to reach stable loss (0.18 for training, 0.16 for validation). FA-K-Means had a loss of 0.19 but performed unstably. Overall, NBRB-RMS showed strong generalization and high reliability. To further evaluate performance, F1 score and error rates of NBRB-RMS were tested, as shown in Figure 11.
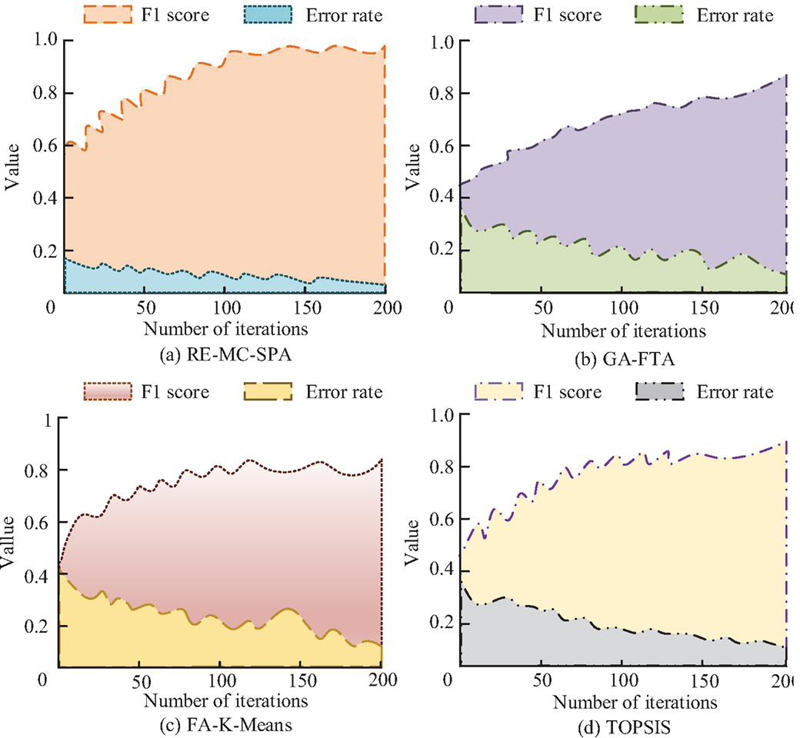
Figure 11 Comparison of F1 score indicator and error rate results
Figure 11(a) showed NBRB-RMS F1 score at 0.97, error rate 0.08. Its F1 score values exceeded comparison models, with GA-FTA the lowest at 0.81. Figures 11(b) and 11(d) showed GA-FTA and FA-K-Means performed moderately during training, below NBRB-RMS. Figure 11(d) showed TOPSIS had higher F1 score at 0.91 but higher initial error at 0.38, reducing to 0.15 after training. Overall, NBRB-RMS showed strong fitting and predictive ability, confirming its superiority. To verify performance in actual library networks, predicted external attacks and actual attacks, as well as predicted and actual library network vulnerabilities, were compared. Mean Absolute Error (MAE) and Mean Relative Error (MRE) were calculated, as shown in Figure 12.
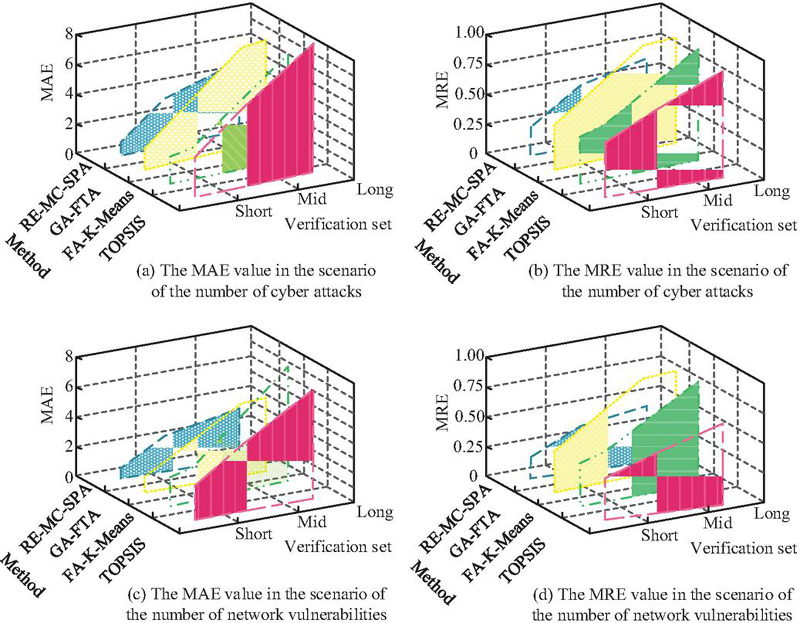
Figure 12 Comparison of MAE and MRE results.
Figure 12(a) showed NBRB-RMS MAE for external attacks was lower than other models, overall 2.5. GA-FTA, FA-K-Means, and TOPSIS were 3.4, 4.2, and 5.1, respectively. Figure 12(b) showed NBRB-RMS MRE was 0.52, lower than others. Figures 12(c) and 12(d) showed NBRB-RMS MAE and MRE for library network vulnerabilities were superior, overall MAE 2.1, MRE 0.31. These results confirmed NBRB-RMS outperformed comparison models in accuracy and stability, demonstrating greater effectiveness in information security risk assessment.
5 Summary
To address the challenges of dynamic changes and high computational complexity in current risk assessment models, this study put forward a SRE-MC-SPA algorithm and, based on this algorithm, built the NBRB-RMS risk assessment model. The model first extracted initial data and constructed a key factor matrix. Taking these key factors as variables and setting the information security risk assessment results as the optimization goal, it used NAG to accelerate the training of the BP network. Meanwhile, the RF-BO method jointly optimized the model parameters. Through iterative optimization, the best parameter combination was determined. The optimized parameters were then applied to SPA to build the causal relationship model of risk factors. MC was used to quantify the uncertainty in risk assessment, which ultimately achieved the information security risk assessment of digital libraries. Experimental results showed that the NBRB-RMS model achieved an accuracy of 0.98 in the training set and 0.97 in the validation set, both higher than the comparison models. When testing the loss value in the CVE dataset, the NBRB-RMS model obtained a loss value of 0.16, which was 0.23 lower than the highest loss value of 0.39 from the TOPSIS model. The t-SNE visualization results of the model demonstrated that, among all comparison models, the NBRB-RMS model achieved the best visual classification performance, with a classification accuracy of 98%. The model clearly identified each risk feature, and the risk features of the same category showed a high degree of aggregation. In terms of error, the NBRB-RMS model had lower prediction errors than other models in external cyberattack prediction scenarios, with an overall MAE of 2.5 and an overall MRE of 0.52. In summary, the NBRB-RMS model efficiently extracted risk features and performed risk assessment through a mathematical framework. This study did not evaluate more university or public digital libraries, and the generalizability of the assessment still requires further validation. In the future, the model can be trained and evaluated for different types of digital library system platforms to continuously improve its generalizability and assessment performance.
References
[1] Goumiri S, Benboudjema D, Pieczynski W. A new hybrid model of convolutional neural networks and hidden Markov chains for image classification. Neural Computing and Applications, 2023, 35(24): 17987–18002.
[2] Carnier R M, Li Y, Fujimoto Y. Exact Markov chain of random propagation of malware with network-level mitigation. IEEE Internet of Things Journal, 2023, 10(12): 10933–10947.
[3] Pesapane F, Battaglia O, Pellegrino G, et al. Advances in breast cancer risk modeling: Integrating clinics, imaging, pathology and artificial intelligence for personalized risk assessment. Future Oncology, 2023, 19(38): 2547–2564.
[4] Obeagu E I, Obeagu G U. Assessing Platelet Functionality in HIV Patients Receiving Antiretroviral Therapy: Implications for Risk Assessment. Elite Journal of HIV, 2024, 2(3): 14–26.
[5] Amarnadh V, Moparthi N R. Comprehensive review of different artificial intelligence-based methods for credit risk assessment in data science. Intelligent Decision Technologies, 2023, 17(4): 1265–1282.
[6] Mallak S, Kanan M, Al-Ramahi N. Using Markov chains and data mining techniques to predict students’ academic performance. Inf. Sci. Lett, 2023, 12(9): 2073–2083.
[7] Chen J, Feng M, Zhao D. Composite effective degree Markov chain for epidemic dynamics on higher-order networks. IEEE Transactions on Systems, Man, and Cybernetics: Systems, 2023, 53(12): 7415– 7426.
[8] Tariq A, Mumtaz F. A series of spatio-temporal analyses and predicting modeling of land use and land cover changes using an integrated Markov chain and cellular automata models. Environmental Science and Pollution Research, 2023, 30(16): 47470–47484.
[9] Jin D T, Zhou T, Yang X H. Assessment of regional water resource carrying capacity by the connection number of set pair analysis. Thermal Science, 2024, 28(3): 2287–2294.
[10] Kobayashi K, Toritani K, Kimura H. Differences in Prognosis and Recurrence Patterns Between Ulcerative Colitis-Associated Colorectal Cancer and Sporadic Colorectal Cancer: A Matched-Pair Analysis. Annals of Surgical Oncology, 2024, 31(12): 7807–7819.
[11] Wang J, Rao C, Goh M. Risk assessment of coronary heart disease based on cloud-random forest. Artificial Intelligence Review, 2023, 56(1): 203–232.
[12] Amarnadh V, Moparthi N R. Prediction and assessment of credit risk using an adaptive Binarized spiking marine predators’ neural network in financial sector[J]. Multimedia Tools and Applications, 2024, 83(16): 48761–48797.
[13] Sukumar A, Mahdiraji H A, Jafari-Sadeghi V. Cyber risk assessment in small and medium-sized enterprises: A multilevel decision-making approach for small e-tailors. Risk Analysis, 2023, 43(10): 2082–2098.
[14] Choudhary N A, Singh S, Schoenherr T. Risk assessment in supply chains: a state-of-the-art review of methodologies and their applications. Annals of Operations Research, 2023, 322(2): 565–607.
[15] Zhan, Z., Wang, X., Liu, Y., Sun, Z., & Gu, C. Integration and Optimization Strategy of Blockchain-Enabled Edge Computing System for Internet of Vehicles. Journal of Cyber Security and Mobility, 2025, 14(02), 391–432.
[16] Yang D, Liang Q, Li R. LSTM deep learning long-term traffic volume prediction model based on Markov state description. Journal of the Chinese Institute of Engineers, 2024, 47(4): 405–413.
[17] Qin Y, Tang Z, Wu H. Flexible tensor learning for multi-view clustering with Markov chain. IEEE Transactions on Knowledge and Data Engineering, 2023, 36(4): 1552–1565.
[18] Madrigal-Cianci J P, Nobile F, Tempone R. Analysis of a class of multilevel Markov chain Monte Carlo algorithms based on independent Metropolis–Hastings. SIAM/ASA Journal on Uncertainty Quantification, 2023, 11(1): 91–138.
[19] Zhou W, Villa U, Anastasio M A. Ideal observer computation by use of markov-chain monte carlo with generative adversarial networks. IEEE transactions on medical imaging, 2023, 42(12): 3715–3724.
[20] N. Luo, H. Yu, Z. You, Y. Li, T. Zhou. N. Han. Fuzzy logic and neural network-based risk assessment model for import and export enterprises. Journal of Data Science and Intelligent Systemsvol, 2023, 1(1):2–11.
Biography

Qi Liang, female, born in May 1982, Han ethnicity, a native of Anxin, Hebei Province. She graduated from Sichuan University with a Bachelor of Management in Library Science in 2004, and obtained a Master of Philosophy degree in Philosophy of Science and Technology from Chengdu University of Technology in 2010, with her research focus on Public Utility Management. She has been working at Chengdu University of Technology since 2004.
She has published 3 papers in CSSCI source journals and 1 paper indexed by EI. She has participated in the compilation of one textbook, presided over 1 provincial-level scientific research project and 1 university-level scientific research project, and taken part in 5 provincial-level scientific research projects and 3 university-level scientific research projects.
Journal of Cyber Security and Mobility, Vol. 15_2, 443–466
doi: 10.13052/jcsm2245-1439.1527
© 2026 River Publishers