Smart Grid Security Vulnerability and Defense Frameworks: A Knowledge Graph and Blockchain-based Collaborative Vulnerability Security Defense Framework
Dongxi Lu1,*, Chenwei Yang1 and Yu Liang2
1Guangdong Grid Electric Power Dispatching Control Center, Guangzhou 510220, Guangdong, China
2China Southern Power Grid Digital Enterprise Technology (Guangdong) Co., Ltd., Guangzhou 510000, Guangdong, China
E-mail: ludongxi508@gmail.com
*Corresponding Author
Received 29 January 2026; Accepted 18 March 2026
Abstract
At present, there are numerous security vulnerabilities in the smart grid, which seriously threaten the usage environment of the smart grid and the privacy of users. This study addresses this problem by building a vulnerability collaborative defense framework that strengthens smart grid’s resilience against vulnerabilities by utilizing the immutability of blockchain technology and the semantic association capabilities of knowledge graphs, and ensure the data security. The model created by combining these two technologies is examined first in the study. According to the findings, the model increased vulnerability description accuracy by 32.1% and decreased data tampering by 11.4%. Analysis of the collaborative defense framework based on this model later showed that it reduced the vulnerability false positive rate to 4.8% while achieving a 95.7% detection rate for covert vulnerabilities. From the above analysis results, it can be observed that the vulnerability collaborative defense framework proposed in the study can improve the accuracy of vulnerability detection and defense capabilities of the smart grid, thereby providing a secure environment for the smart grid, preventing external interference, and ensuring the accuracy of data.
Keywords: Smart grid, knowledge graph, blockchain, data security, vulnerability collaborative defense.
Overview
Artificial intelligence (AI) refers to the theories, methods, technologies, and application systems that simulate, extend, and augment human intelligence through computer systems. This technology is being applied across various fields [1]. Meanwhile, the smart grid serves as the core infrastructure of the energy revolution, enabling the intelligent upgrade of power systems through AI technology [2]. However, with the development of smart grids, the various attacks and threats that the grids are subjected to are also increasing [3]. Many smart grids have low defense capabilities against network attacks, which can easily lead to data vulnerabilities, resulting in data being tampered with and affecting the judgment of managers on the status of grid equipment [4, 5]. Therefore, numerous scholars have conducted research on vulnerability defense technologies. For instance, Luo Y et al. designed a vulnerability defense framework based on offensive and defensive games to improve the ability of the power system to resist external attacks. The test results showed that the framework could increase the defense capability of the power system by 21.2% [6]. Dutta A et al. also employed security control networks and satisfiability model theory to defend against vulnerabilities in power grids. Results demonstrated a 9.7% improvement in defense capabilities [7]. To enhance smart grids’ resilience against cyberattacks, Zhang Z et al. utilized machine learning to design a cyberattack resistance framework. Test results indicated a 14.2% increase in the framework’s resistance to cyberattacks [8]. To address various attacks targeting smart grids, Banik S et al. employed simulation testing to assess smart grid vulnerabilities and enhance grid resilience. Grid vulnerability was reduced by 10.8%, according to test results [9]. Although these techniques improve the power grid’s vulnerability defense capabilities, an analysis of the aforementioned research shows that they still fall short of expectations, making data vulnerable to manipulation. Therefore, to increase their resilience against cyberattacks and fortify their ability to counter vulnerabilities, more optimization of the current vulnerability defense techniques is required.
Relationships between different entities can be shown using knowledge graphs (KG), which can show how one entity affects others [10]. This approach is commonly used in a variety of data formats. For example, the Zhang Y et al. used KG technology to predict network threat situations to ensure network security, with a prediction accuracy of 90.3% [11]. Deep learning models trained on enormous volumes of textual data are known as large language models (LLMs). They can produce natural language text and understand its meaning through training [12]. Numerous data analyses also commonly use this model. Using LLM and deep neural networks, The Bayer M et al. designed a network threat mitigation model based on the LLM model to resist various threats in the network. The test results show that the model can reduce network security threats by 10.2% [13]. Blockchain technology (BT) is a distributed ledger technology that prevents data tampering by using cryptographic techniques to link data blocks chronologically into a chained structure [14]. Numerous data encryption applications also commonly use this technology. For example, Ray RK et al. used BT to protect transaction security and data in the retail industry. Test results show that data security in the network has been improved by 17.2% [15].
In conclusion, in existing literature, the combination of KG and BT in the field of smart grid security has been preliminarily explored, but there are obvious limitations. First, the level of technological integration is low. Most research only applies blockchain or a KG independently without establishing a deep collaborative mechanism. Second, existing solutions focus on attack detection or data validation, with less analysis on vulnerability discovery. To solve the above problems, this research utilizes LLM to optimize the KG, thereby improving the KG’s ability to identify the information of intelligent grid entities, and then combines LLM-KG with BT to design a vulnerability defense framework, thereby enhancing the vulnerability defense capability of the grid and reducing the probability of data tampering in the smart grid, ensuring the security of grid information. The asset ledger is a detailed account in the smart grid that records, tracks, and verifies fixed assets such as transformers, transmission lines, and switchgear, as well as intangible assets such as software systems and data assets. The smart grid asset ledger is a digital accounting system that registers, classifies, and dynamically manages all assets owned or controlled by power grid operating enterprises. When verifying the smart grid asset ledger, there is a risk of data tampering, which requires extremely high security requirements. Moreover, the asset ledger verification has the characteristic of multi-source, heterogeneous data. This allows for the precise verification of the technical advantages of KG processing of complex relationships and blockchain, which ensures data immutability. Therefore, this study uses the verification of smart grid asset books as its research object and analyzes the effectiveness of the vulnerability collaborative defense framework using examples of various attacks encountered during the verification process. BT will defend and fix vulnerabilities. The innovation point of this research is to use the self-attention mechanism and multi-head attention mechanism in LLM to capture the implicit entity relationships and logical rules in the text, and combine the cross-attention mechanism of the LLM decoder and the information generation in the KG to generate more accurate supplementary content, thereby improving the incompleteness of the KG. Finally, LLM-KG is combined with BT, and through the grid KG constructed by LLM-KG to query the affected grid equipment by the vulnerability, and then use BT to defend and repair the vulnerability.
1 Vulnerability Collaborative Defense Framework Based on Knowledge Graphs and Blockchain Technology
1.1 KG Integrated with LLM
At present, when the smart grid is in operation, it is vulnerable to various external attacks, which can affect various data within the smart grid and reduce its security [16]. For instance, during the verification of asset ledgers, due to the low resistance of the smart grid to external attacks, when conducting the verification of asset ledgers, the asset data of the smart grid is prone to being leaked or tampered with, and cannot reflect the true state of the power grid equipment [17]. Therefore, it is urgent to design a framework for collaborative defense against vulnerabilities that can enhance resistance to network attacks. KG is a series of different graphs that can display the process and structural relationship of knowledge development, and can show the connections between them [18]. Through KG, various entities in the smart grid can be accurately identified and defined, and the relationships between the entities can be regarded as the connections in the KG, thereby constructing a KG about the entities in the smart grid, which can quickly locate the devices related to the vulnerability and analyze the possible impact of the vulnerability on the devices [19, 20]. The construction process and visualization of KG are shown in Figure 1.
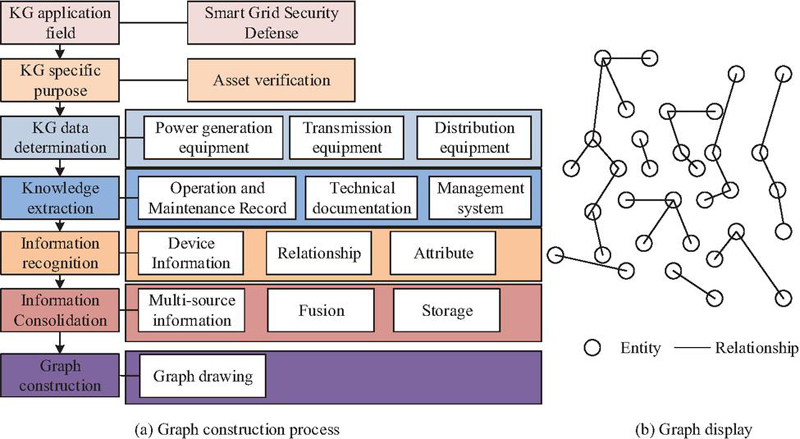
Figure 1 KG construction process and visualization display.
In Figure 1(a), when constructing a KG, the first step is to define the KG’s application domain and specific purpose. Based on the application scenario, the specific data required for the KG is then identified. The application domain for this study is smart grid security defense. The specific data needed for the KG includes knowledge about various assets such as power generation equipment, transmission equipment, and distribution equipment, along with the relationships between them. Subsequently, knowledge extraction is performed to collect KG-relevant data from multiple sources. Specifically, within the smart grid, this involves obtaining KG-related data from equipment management systems, operation and maintenance records, and technical documentation. Re-identify and extract entities such as generators, transformers, and transmission lines from the data as fundamental elements within the KG. This establishes relationships between entities, describing their connections and interactions. Subsequently, the attribute information of entities is extracted, including details such as generator model and rated power. After information extraction, the retrieved data is merged to consolidate information about the same entity from different data sources. Finally, the collected data is stored in a graph database format. Its storage representation is shown in Figure 1(b). During this process, when performing relation extraction, scores for different label sequences must be computed to identify the sequence with the highest score, thereby determining the relationships between entities within the input sequence. The calculation formula is shown in Equation (1).
| (1) |
In Equation (1), denotes the score of the label sequence. represents the input sequence. is the label sequence. is the transition feature function, indicating the score for transitioning from label to label . is the state feature function, representing the score for labeling input as . denotes the length of the input sequence. Furthermore, to evaluate the constructed KG, its entity coverage must be calculated as shown in Equation (2).
| (2) |
In Equation (2), denotes entity coverage. represents the actual number of entities contained within the KG. indicates the true total number of entities. The completeness of entities within the KG is evaluated through the calculated value. Although the KG can interconnect attributes and information among various entity devices in the smart grid asset ledger, this method cannot cover all entities and relationships, potentially omitting some information. LLM models, based on the Transformer architecture, utilize encoders and decoders to deeply comprehend textual meaning, thereby identifying entity information within text. Furthermore, LLM models can generate new textual information based on existing knowledge to supplement missing content in the KG, thereby addressing its incompleteness. The basic structure of LLM and the schematic diagram of LLM model-enhanced KG are shown in Figure 2.
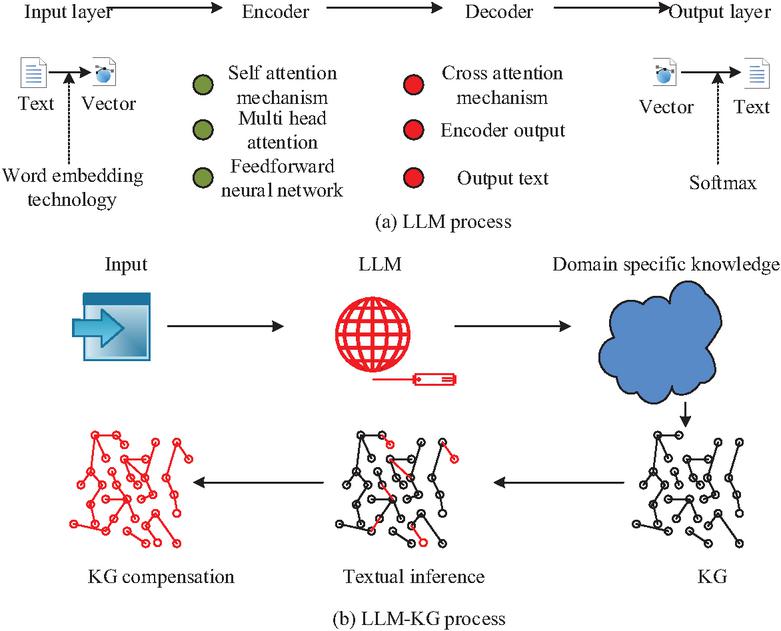
Figure 2 Basic structure of LLM and LL-KG process.
In Figure 2(a), the LLM consists of an input layer, an encoder, a decoder, and an output layer. In the input layer, text is converted into vectors using word embedding techniques. The encoder employs a Transformer architecture to extract semantic features, with its core comprising self-attention mechanisms, multi-head attention, and feedforward neural networks. The self-attention mechanism maps each position in the input sequence to three vectors, Query, Key, and Value, through linear transformations. The attention score is computed by calculating the dot product between the query and key. After applying softmax normalization, the values are weighted and summed to generate the context vector for the current position. The generation of query, key, and value is shown in Equation (3).
| (3) |
In Equation (3), denotes the input sequence. denotes the query matrix. denotes the key matrix. denotes the value matrix. The calculation of the attention score is shown in Equation (4).
| (4) |
In Equation (4), denotes the scaling factor. represents the attention score. The expression for generating the context vector is shown in Equation (5).
| (5) |
In Equation (5), represents the generated context vector. denotes the activation function. Multi-head attention projects the input sequence’s Query, Key, and Value into distinct subspaces through multiple independent linear transformations. Each head independently computes its self-attention. Finally, concatenating the outputs from all heads captures diverse features across different subspaces, enhancing the model’s expressive power. To compensate for the linear combination limitations of the attention mechanism, the feedforward neural network employs two linear transformations and a ReLU activation function to augment feature representation. Its mathematical expression is shown in Equation (6).
| (6) |
In Equation (6), denotes the input vector. and represent the weight matrices. and denote the bias vectors. denotes the ReLU activation function. LLM enables the model to simultaneously focus on features across different subspaces through self-attention and multi-head attention, while the feedforward neural network refines the global features captured by the self-attention mechanism via nonlinear transformations. The decoder progressively generates text by integrating the encoder’s outputs through cross-attention mechanisms. The output layer converts the vector into specific textual content via the Softmax function. In Figure 2(b), when optimizing the KG using the aforementioned LLM architecture, the LLM leverages self-attention and multi-head attention mechanisms to capture implicit entity relationships and logical rules within the text. Combined with the decoder’s cross-attention mechanism and information from the KG, it generates more accurate supplementary content to address the KG’s incompleteness.
1.2 Vulnerability Defense Framework Based on KG and BT
LLM-KG can accurately display various information within smart grid and equipment, including relationships between entities and entity attributes, thereby identifying grid devices potentially affected by vulnerabilities. Once devices are identified, vulnerability defenses must be strengthened. BT incorporates distributed storage, encryption algorithms, and consensus mechanisms to ensure information security and prevent data tampering [21]. This study employs BT to defend against vulnerabilities identified in LLM-KG, thereby safeguarding smart grid information security. The fundamental structure of BT’s encryption algorithm is illustrated in Figure 3.
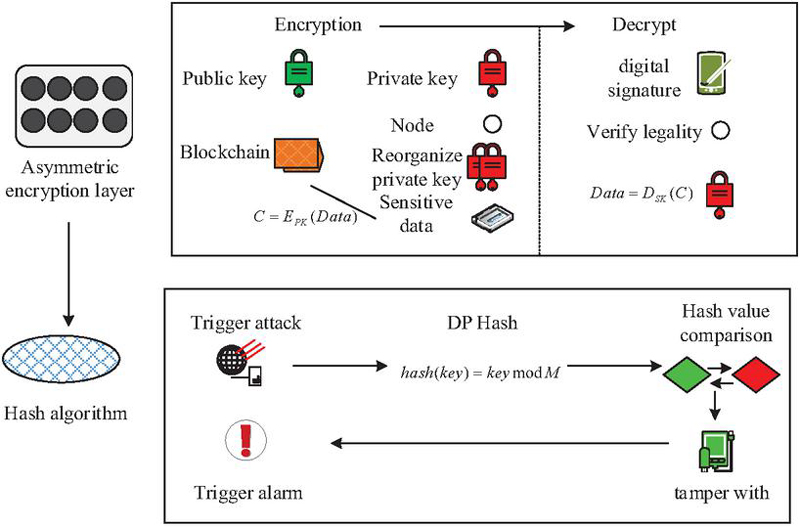
Figure 3 Basic structure of encryption algorithm.
In Figure 3, the encryption algorithm in BT consists of an asymmetric encryption layer and a hash algorithm layer. The asymmetric encryption layer employs the state cryptographic standard (Shang Yong Mi Ma, SM2) SM2 algorithm to prevent data tampering. SM2 key pairs are generated by the State Grid Cryptography Administration, with the public key published on the blockchain. The private key is split into multiple fragments and distributed to authorized nodes via secure channels. Each authorized node stores a fragment locally and dynamically reconstructs the private key using threshold cryptography. Subsequently, data is encrypted and uploaded to the blockchain. Highly sensitive data, such as substation coordinates and high-risk equipment information, undergoes encryption using the SM2 algorithm with the public key from the blockchain to generate ciphertext, as shown in Equation (7).
| (7) |
In Equation (7), denotes the generated ciphertext. represents the encryption algorithm. denotes the blockchain public key. denotes highly sensitive data. The ciphertext is then combined with the data label and transmitted to the blockchain for storage. When a node requests decryption, it must provide a digital signature, which the blockchain verifies for legitimacy. The node performs decryption using the SM2 algorithm, as expressed in Equation (8).
| (8) |
In Equation (8), represents the decryption algorithm, and denotes the key after sharding and reassembly. However, certain attacks cannot be entirely prevented. The hash algorithm layer can detect compromised points within the blockchain and verify them. When a blockchain node triggers an event, the hash algorithm calculates the hash value of the current blockchain. It then compares this current hash value with the hash value input by the device to determine if the data has been tampered with. If tampering is detected, an alarm is triggered. The formula for calculating the hash value is shown in Equation (9).
| (9) |
In Equation (9), denotes the hash value obtained by performing a hash operation on the given . represents the corresponding original data value. denotes a positive integer set by the cosine function. After discovering a vulnerability in BT’s encryption algorithm, the vulnerability must be patched. This patching process requires leveraging BT’s consensus mechanism. The vulnerability patching flow for the consensus mechanism is illustrated in Figure 4.
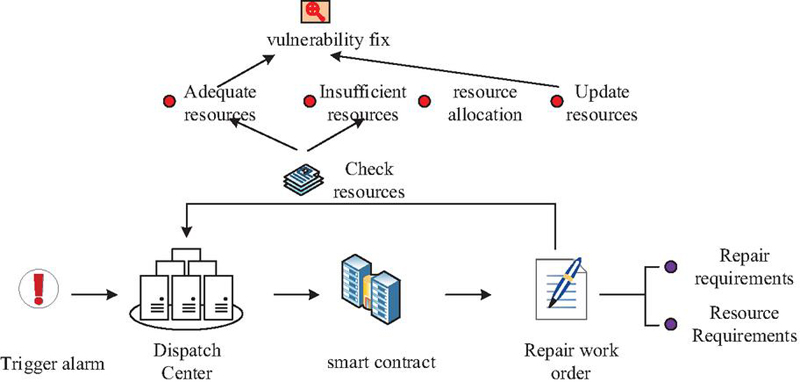
Figure 4 Consensus mechanism repair process.
In Figure 4, upon triggering an alert, the blockchain dispatch center writes vulnerability information to the blockchain, activating a smart contract. The smart contract generates a repair work order based on predefined rules. This work order contains details of all affected devices, along with vulnerability remediation requirements and resource demands. The smart contract stores the work order on the blockchain. Upon receiving the work order, the dispatch center checks its contents to determine if corresponding resources exist in local storage. If regional resources are insufficient, the blockchain’s edge layer allocates resources across regions and updates the resource path within the work order. The vulnerability is then repaired. Through the above process, the vulnerabilities of the smart grid are repaired. When the proposed vulnerability collaborative defense framework is used for the verification of the asset ledger, the specific process is shown in Figure 5.
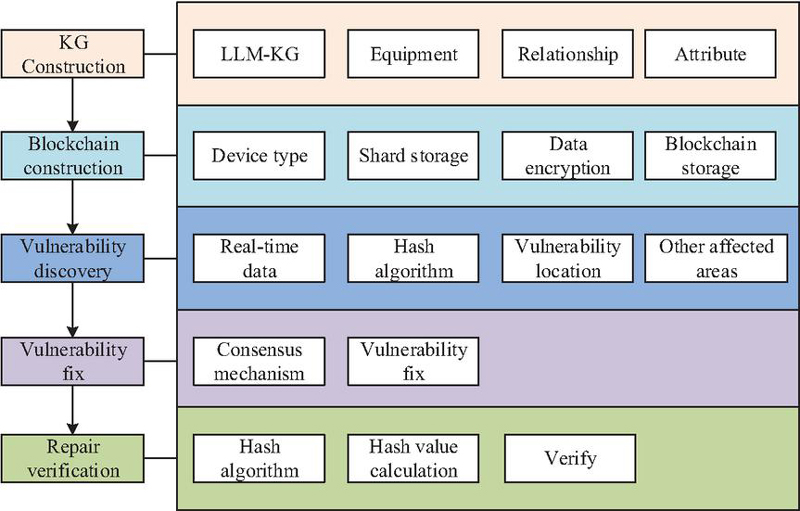
Figure 5 Basic process of vulnerability repair.
In Figure 5, vulnerability defense within the smart grid asset ledger verification process comprises five steps: asset ledger graph construction, blockchain construction, vulnerability discovery, vulnerability remediation, and remediation verification. In the KG construction process, LLM-KG technology is first employed to model the relationships and attributes of equipment within the smart grid asset ledger, thereby establishing a KG for the smart grid ledger assets. This KG is then partitioned into regional segments based on equipment types. Utilizing blockchain’s distributed storage capabilities, these KG segments are stored on the blockchain, forming a distributed storage KG on the blockchain. Furthermore, BT’s asymmetric encryption ensures data security by encrypting the information. Vulnerability detection is achieved by blockchain nodes collecting real-time device operation data. Combined with hash algorithms, this enables real-time vulnerability detection within nodes, pinpointing the location of vulnerabilities. Furthermore, based on the constructed KG, it identifies potential vulnerabilities in other devices associated with ledger assets. Next, the detected vulnerabilities and potential vulnerabilities are addressed using the consensus mechanism within the blockchain. Finally, the vulnerabilities in the asset ledger verification process are re-examined using the hash algorithm to validate the results of the remediation. Moreover, to reduce false positives and false negatives during detection, the study adopts a multiple-validation approach. The same vulnerability is confirmed five times. It is determined to be a vulnerability only when it is confirmed three or more times. This controls the false alarm rate and false alarm rate of the defense framework. In this process, KG models smart grid asset devices as a triple structure of entity relationship entity to achieve vulnerability correlation analysis. The analysis process is as follows: based on the hash algorithm, the attacked node is identified and the initial vulnerability is located. Then, KG searches for devices directly connected to the attacked node, assigns different impact weights based on the connection type, and tracks the vulnerability propagation path according to the connection relationship. Finally, it collects the device criticality score and outputs a risk list.
2 Analysis of the Effectiveness of Vulnerability Collaborative Defense Framework
2.1 Effects of Integrating Blockchain and KG
To evaluate the practical effectiveness of the proposed vulnerability defense framework, this study first analyzes the performance of the LLM-KG-BT model using the IEEE 118 Bus Test System dataset as the experimental dataset. This dataset simulates the topological relationships and operational parameters of power grid equipment, enabling the construction of a KG-based equipment relationship model to validate the model’s reasoning capability for equipment-related vulnerabilities. The experimental environment configuration is shown in Table 1.
Table 1 Experimental environment configuration
| Project | Index | Allocation |
| Hardware environment | CPU | Intel Core i7-12700K |
| GPU | NVIDIA RTX 3090 | |
| RAM | 64GB DDR4 | |
| OS | Windows 10 | |
| Software environment | Deep learning framework | PyTorch 1.12 |
| ML library | Scikit-learn 1.1 | |
| Data analysis software | Python 3.9 |
During experimentation, the parameters for LLM-KG-BT are set as follows: the maximum context length for the LLM model is set to 8192, kernel sampling is set to 0.9, the learning rate is set to 1e-5, and the batch size is set to 16. The embedding dimension for the KG is set to 128. The experimental dataset comprises 100 instances each of node data, branch data, generator data, and load data from the IEEE 118 Bus Test System dataset. This dataset is divided into training and testing sets in an 8:2 ratio. An ablation study is first conducted on the node dataset using LLM-KG-BT. The results are shown in Figure 6.
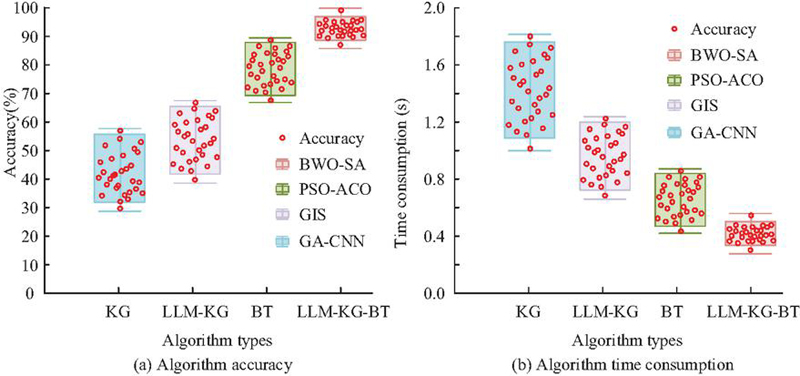
Figure 6 Results of ablation experiment.
In Figure 6(a), the computational accuracy of KG fluctuates between 30% and 60%. Its average accuracy is 49.7%, while LLM-KG, BT, and LLM-KG-BT achieve computational accuracies of 56.7%, 82.6%, and 93.7%, respectively. In Figure 6(b), the computation durations for KG, LLM-KG, BT, and LLM-KG-BT are 1.4 s, 1.1 s, 0.6 s, and 0.4 s, respectively. In summary, LLM-KG-BT optimizes both standalone KG and BT, enhancing KG computational accuracy while reducing processing time. The amount of reduction in data tampering rate achieved by the LLM-KG-BT model across different datasets is further analyzed. The results are shown in Figure 7.
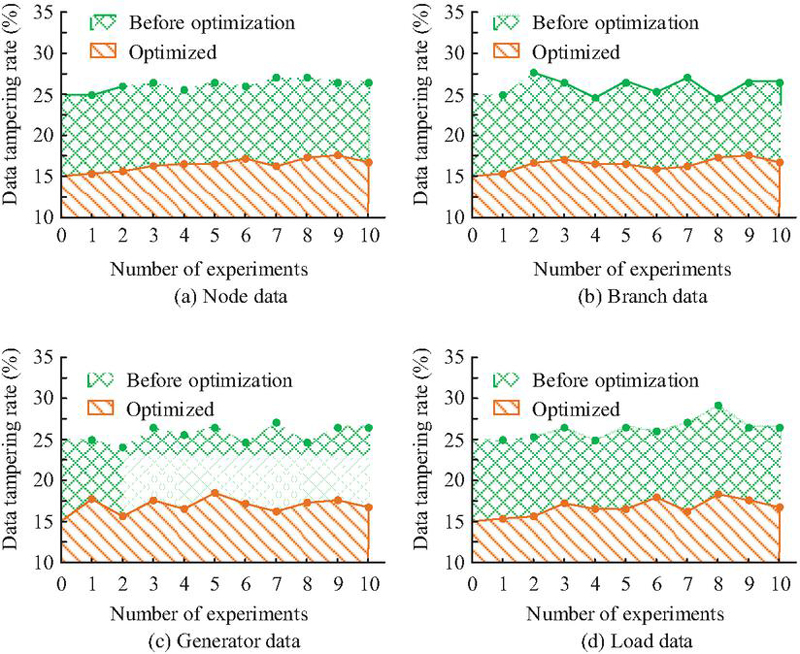
Figure 7 Changes in data tampering rate.
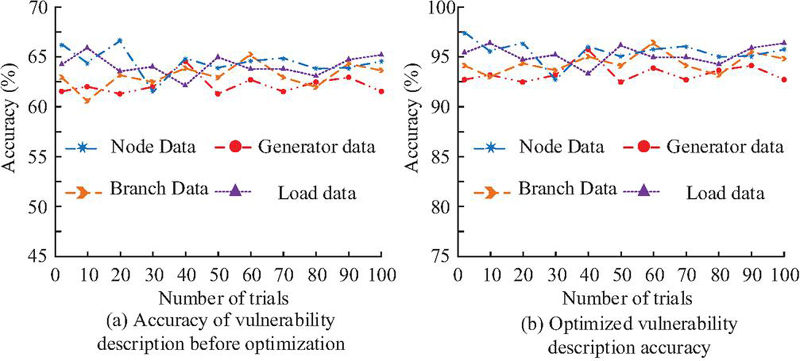
Figure 8 Change in accuracy of vulnerability description.
In Figure 7(a), LLM-KG-BT reduces the data tampering rate from 25.8% to 14.4%, achieving an 11.4% decrease. In Figures 7(b), 7(c), and 7(d), LLM-KG-BT maintains a data tampering rate below 16% when protecting branch data, generator data, and load data, respectively. The average reduction across the four data types is 11.4%. Finally, the accuracy of the model in identifying vulnerability descriptions within the graph is analyzed, with results shown in Figure 8.
According to Figure 8(a), before using LLM-KG-BT technology, the accuracy of describing vulnerabilities in node data, branch data, generator data, and load data is 65.2%, 63.2%, 61.7%, and 64.3%, respectively, with an average of 63.6%. The accuracy of describing vulnerabilities is relatively low. In Figure 8(b), after LLM-KG-BT optimization, the model’s accuracy in describing vulnerabilities in the four types of data is 96.8%, 96.1%, 95.2%, and 94.7%, respectively, with an average of 95.7%. The accuracy of its description increases by 32.1% compared to before using LLM-KG-BT. In summary, the proposed LLM-KG-BT approach reduces the risk of data tampering and enhances vulnerability description accuracy, thereby supporting subsequent vulnerability remediation efforts.
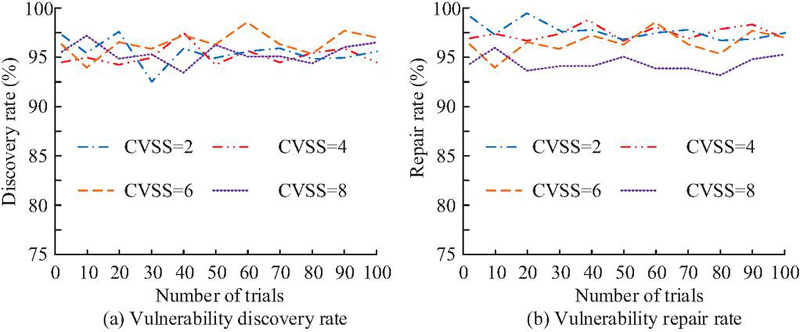
Figure 9 Vulnerability discovery rate and vulnerability repair rate.
2.2 Analysis of the Actual Effectiveness of the Defense Framework
After verifying the performance of the LLM-KG-BT model, taking the verification of asset ledgers in the smart grid as an example, the actual performance of the model is analyzed. CVE/NVD is selected as the dataset for this analysis, which contains publicly disclosed vulnerability information for grid equipment. This dataset can be used to verify the framework’s ability to detect and remediate known vulnerabilities. The CVE/NVD dataset includes common vulnerability scoring system (CVSS) ratings. The dataset contains vulnerabilities with varying severity levels. This study selects vulnerabilities with CVSS scores of 2, 4, 6, and 8 for testing. Each vulnerability category uses 300 test cases. First, the discovery rate and repair rate of LLM-KG-BT for vulnerabilities with different CVSS scores are analyzed. The results are shown in Figure 9.
In Figure 9(a), when diagnosing vulnerabilities with CVSS 2, CVSS 4, CVSS 6, and CVSS 8, the vulnerability discovery rate of the LLM-KG-BT defense framework is 95.4%, 96.0%, 95.6%, and 95.8%, respectively. Its average vulnerability discovery rate reached 95.7%. In Figure 9(b), after applying the LLM-KG-BT defense framework to repair vulnerabilities, the framework achieves a repair rate exceeding 95% for all vulnerability types. The false positive rate and vulnerability discovery time of the LLM-KG-BT defense framework are further analyzed. The results are shown in Figure 10.
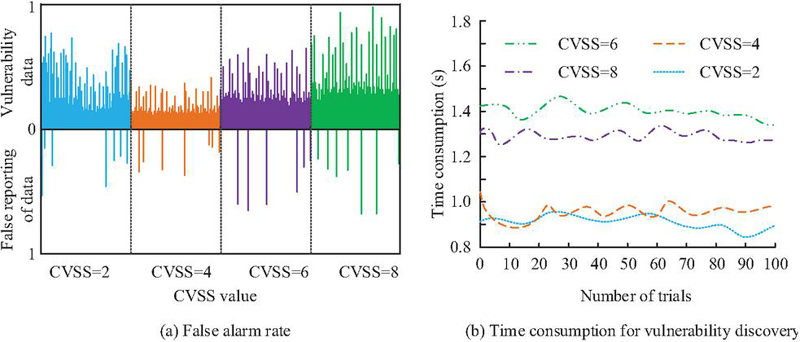
Figure 10 False alarm rate and discovery time of vulnerabilities.
The false positive rate of vulnerabilities is the proportion of defense frameworks that incorrectly identify normal behavior as attack vulnerabilities. This rate can reflect the system’s accuracy. The calculation method is the ratio of the number of false alarms to the total number of alarms. In Figure 10(a), the LLM-KG-BT vulnerability defense framework demonstrates low false positive rates when querying different types of vulnerabilities in smart grids. In Figure 10(b), vulnerability diagnostics within smart grids using this approach consistently complete within 2 s. When diagnosing vulnerabilities with CVSS 2, CVSS 4, CVSS 6, and CVSS 8, the average diagnostic durations are 0.97 s, 1.02 s, 1.32 s, and 1.42 s, respectively. These results demonstrate that the LLM-KG-BT vulnerability defense framework can accurately detect vulnerabilities. Finally, the LLM-KG-BT defense framework is compared with defense frameworks based on regular expression-support vector machine (RE-SVM), path sorting algorithm-knowledge graph (PSA-KG), and random forest-knowledge graph (RF-KG). The results are shown in Table 2.
Table 2 Comparison of defense framework performance
| Vulnerability | Vulnerability | |||||
| Algorithm | Discovery Rate | False Positive Rate | Time-consuming | Repair Rate | ||
| RE-SVM | 91.7 0.7% | 10.4 1.1% | 4.9 0.1s | 91.3 1.6% | ||
| PSA-KG | 89.4 0.3% | 8.1 1.4% | 4.1 0.5s | 89.7 3.1% | ||
| RF-KG | 87.3 1.2% | 6.5 0.9% | 3.2 0.3s | 87.3 1.9% | ||
| LLM-KG-BT | 95.7 0.5% | 4.8 0.7% | 1.4 0.2s | 96.8 0.4% | ||
Table 2 compares the actual effectiveness of the LLM-KG-BT defense framework against other vulnerability defense frameworks. Results show that the LLM-KG-BT defense framework achieves a vulnerability discovery rate of 95.7% in smart grids, surpassing RE-SVM’s 91.7%, PSA-KG’s 89.4%, and RF-KG’s 87.3%. Furthermore, the LLM-KG-BT defense framework achieves a vulnerability repair rate of 96.8%, which also surpasses the repair rates of other vulnerability defense frameworks. Meanwhile, LLM-KG-BT demonstrates lower vulnerability false positive rates and reduced processing time compared to the other three vulnerability defense frameworks in smart grid asset ledger verification. In summary, the proposed LLM-KG-BT vulnerability defense framework can promptly detect various vulnerabilities within smart grids and accurately repair them.
3 Discussion and Interpretation
To enhance the resilience against cyberattacks in smart grids and ensure data integrity, this research exploited LLM to optimize KG. The optimized LLM-KG was then integrated with BT, aiming to diagnose vulnerabilities in smart grids through the combined LLM-KG-BT framework and promptly address these vulnerabilities. The study first evaluated the performance of the LLM-KG-BT method. Results indicated that when tested on various data within the IEEE 118 Bus Test System dataset, LLM-KG-BT reduced data tampering rates by 11.4%. Additionally, the model’s accuracy in characterizing data vulnerabilities improved from 65.2%, 63.2%, 61.7%, and 64.3% to over 90%, respectively, following optimization using this method. This was a 32.1% improvement on average. Additionally, ablation experiments showed that LLM-KG-BT reduces computational time while improving computational accuracy when compared to standalone LLM and BT.
This result is roughly consistent with the experimental results of Rajeyyagari S et al. [22]. However, in Rajeyyagari S et al.’s experiment, when using a combination of convolutional neural networks, African vulture optimization algorithms, and BT technology to protect data, the method only reduced the data tampering rate by 4.5%, which is lower than the LLM-KG-BT method used in this study. By using LLM to compensate for the KG’s incompletely defined entity data, LLM-KG-BT allowed the model to more accurately depict relationships and attributes among different entities, according to an analysis of the two methods. This feature decreased the possibility of data tampering by enabling the model to accurately identify data vulnerabilities.
Taking the verification of asset ledgers in the smart grid as an example, the actual effectiveness of the vulnerability defense framework based on LLM-KG-BT was analyzed. According to the analysis’s findings, this defense framework could be applied to protect against a number of smart grid vulnerabilities. The findings demonstrated that the framework had a 95.7% vulnerability detection rate. Additionally, the framework showed comparatively short vulnerability detection times when diagnosing vulnerabilities with CVSS scores of 2, 4, 6, and 8, finishing detection in 0.97 s, 1.02 s, 1.32 s, and 1.42 s, respectively. This framework was also contrasted with other frameworks for vulnerability defense. According to the findings, the LLM-KG-BT vulnerability defense framework was able to diagnose vulnerabilities with a vulnerability discovery rate of 95.7% and a vulnerability false positive rate as low as 4.8%. These results showed parallels to the study by Li P et al. However, Li P et al.’s vulnerability discovery rate of 90.6% was marginally less than the approach suggested in this study. Because Li P et al.’s vulnerability detection method only used BT to scan for vulnerabilities in the smart grid asset inventory without using KG to map relationships among assets, a comparison of the two approaches showed that it was flawed [23]. On the other hand, this problem was resolved by the study’s suggested LLM-KG-BT framework, which allowed the defense framework to precisely identify vulnerabilities. According to the test results, the LM-KG-BT framework performs well in the validation of the CVE/NVD dataset, with discovery rates of 95.4%, 96.0%, 95.6%, and 95.8% for CVSS 2/4/6/8 vulnerabilities, respectively. The vulnerability repair rates are all over 95%, and the average detection time is 1.18 seconds with a false positive rate of less than 2%. Among them, CVSS 4 has the best detection effect for critical vulnerabilities (discovery rate of 96.0%, time of 1.02 s). After analysis, it is found that the best technical match was formed between its local attack characteristics and KG topology tracking, BT configuration verification, and LLM semantic understanding. Although the detection rate of the CVSS 8 severe vulnerability is relatively low (95.8%), the time it take to detect it increased by 46%. This is mainly due to the overhead of multi-stage attack chain reconstruction and the emergency consensus mechanism.
In summary, the proposed LLM-KG-BT framework can defend against vulnerabilities in AI-driven asset ledger verification within smart grids.
4 Summary
This study used LLM technology to enhance the KG, in order to solve the problem of weak defense capabilities of smart grids and data tampering. To identify and promptly fix the vulnerabilities of the smart grid, this study constructed a KG specifically for the smart grid and combined it with BT technology. According to the research results, the vulnerability defense framework based on LLM-KG-BT achieved a good detection rate for vulnerabilities, and the LLM-KG-BT method had high accuracy in describing vulnerability data. Furthermore, in the practical application of the intelligent grid asset ledger verification, this framework also demonstrated excellent performance. Based on these results, this study concluded that the proposed vulnerability defense framework could protect against vulnerabilities in smart grid asset ledgers. It was also suitable for scenarios involving multi-source, heterogeneous data fusion in smart grids and data tampering in asset ledgers, such as those containing key equipment parameters, maintenance records, and logs. However, the ongoing growth of smart grids and the quick rise in data volume could jeopardize the current LLM-KG-BT model’s real-time performance when handling massive datasets, despite the fact that it shows comparatively short vulnerability detection times. To address this issue, future approaches can employ model compression techniques to streamline the model, thereby enhancing its cloud operational efficiency. Moreover, this study can also try to use distributed architectures such as edge computing and federated learning to improve the real-time performance of the algorithm. It can also be combined with AI vulnerability prediction models and dynamic KG update strategies.
Acknowledgement
This research is supported by the Southern Power Grid Corporation Technology Project Funding (Project No.030000KC23120108(GDKJXM20231533)
References
[1] Awadallah A, Eledlebi K, Zemerly MJ, Puthal D, Damiani E, Taha K, Kim TY, Yoo PD, Choo KK, Yim MS, Yeun CY. Artificial intelligence-based cybersecurity for the metaverse: Research challenges and opportunities. IEEE Communications Surveys & Tutorials. 2024, 27(2): 1008–1052. DOI: 10.1109/COMST.2024.3442475.
[2] Liu M, Teng F, Zhang Z, Ge P, Sun M, Deng R, Cheng P, Chen J. Enhancing cyber-resiliency of der-based smart grid: A survey. IEEE Transactions on Smart Grid. 2024, 15(5): 4998–5030. DOI: 10.1109/TSG.2024.3373008.
[3] Almasabi S, Shaf A, Ali T, Zafar M, Irfan M, Alsuwian T. Securing smart grid data with blockchain and wireless sensor networks: A collaborative approach. IEEE Access. 2024, 12(8): 19181–19198. DOI: 10.1109/ACCESS.2024.3361752.
[4] Tomar A, Tripathi S, Arivarasan K. A blockchain-based certificateless aggregate signature scheme for fog-enabled smart grid environment. IEEE Transactions on Green Communications and Networking. 2023, 7(4): 1892–1905. DOI: 10.1109/TGCN.2023.3265608.
[5] Mishchenko D, Oleinikova I, Erdődi L, Pokhrel BR. Multidomain cyber-physical testbed for power system vulnerability assessment. IEEE Access. 2024, 12(11): 38135–38149. DOI: 10.1109/ACCESS.2024.3375401.
[6] Luo Y, Hu Q, Zou B, Zhang Y, Chen T, Wang Q. External vulnerability assessment of power system under attack based on attack-defense game. IEEE Transactions on Power Systems, 2025, 40(5): 4380–4390. DOI: 10.1109/TPWRS.2025.3547067.
[7] Dutta A, Al-Shaer E, Aghaei E, Duan Q, Yasar H. Security Control Grid for Optimized Cyber Defense Planning. IEEE Transactions on Network and Service Management. 2024, 22(1): 913–929, DOI: 10.1109/TNSM.2024.3488011.
[8] Zhang Z, Liu M, Sun M, Deng R, Cheng P, Niyato D, Chow MY, Chen J. Vulnerability of machine learning approaches applied in iot-based smart grid: A review. IEEE Internet of Things Journal. 2024, 11(11): 18951–18975. DOI: 10.1109/JIOT.2024.3349381.
[9] Banik S, Rogers M, Mahajan SM, Emeghara CM, Banik T, Craven R. Survey on vulnerability testing in the smart grid. IEEE Access. 2024, 12(8): 119146–119173. DOI: 10.1109/ACCESS.2024.3449642.
[10] Qi Y, Gu Z, Li A, Zhang X, Shafiq M, Mei Y, Lin K. Cybersecurity knowledge graph enabled attack chain detection for cyber-physical systems. Computers and Electrical Engineering. 2023, 10(108): 108660–108671. DOI: 10.1016/j.compeleceng.2023.108660.
[11] Zhang Y, Chen J, Cheng Z, Shen X, Qin J, Han Y, Lu Y. Edge propagation for link prediction in requirement-cyber threat intelligence knowledge graph. Information Sciences. 2024, 653(5): 119770–11979. DOI: 10.1016/j.ins.2023.119770.
[12] Ren S, Chen S. Large Language Models for Cybersecurity Intelligence, Threat Hunting, and Decision Support. Computer Life. 2025, 13(3): 39–47. DOI: 10.54097/7ysr5k17.
[13] Bayer M, Kuehn P, Shanehsaz R, Reuter C. Cysecbert: A domain-adapted language model for the cybersecurity domain. ACM Transactions on Privacy and Security. 2024, 27(2): 1–20. DOI: 10.1145/3652594.
[14] Ahmad J, Zia MU, Naqvi IH, Chattha JN, Butt FA, Huang T, Xiang W. Machine learning and blockchain technologies for cybersecurity in connected vehicles. Wiley interdisciplinary reviews: data mining and knowledge discovery. 2024, 14(1): 1515–1519. DOI: 10.1002/widm.1515.
[15] Ray RK, Chowdhury FR, Hasan MR. Blockchain applications in retail cybersecurity: Enhancing supply chain integrity, secure transactions, and data protection. Journal of Business and Management Studies. 2024, 6(1): 206–214. DOI: 10.32996/jbms.2024.6.1.13.
[16] Muthulakshmi S, Chitra R. Interplanetary file system and blockchain for secured smart grid networks. Journal of supercomputing, 2024, 80(5): 5900–5922. DOI:10.1007/s11227-023-05680-8.
[17] Jouyban M, Hosseini S. Analytics and measuring the vulnerability of communities for complex network security. International Journal of Data Science and Analytics, 2025, 20(4): 3475–3494. DOI: 10.1007/s41060-024-00673-z.
[18] Luo F, Wang S, Lv Y, Mu R., Fo J, Zhang T. Domain knowledge-enhanced graph reinforcement learning method for Volt/Var control in distribution networks. Applied Energy, 2025, 398(1): 126409–126412. DOI: 10.1016/j.apenergy.2025.126409.
[19] Ren H, Jiang P, Li Q. Machine as a smart service: a hybrid knowledge graph approach. Flexible Services and Manufacturing Journal, 2025, 37(3):750–775. DOI: 10.1007/s10696-024-09558-6.
[20] Liu Q, Jin Y Y, Cao X, Liu X, Zhou X, Zhang Y, Xu X, Qi L. An entity ontology-based knowledge graph embedding approach to news credibility assessment. IEEE Transactions on Computational Social Systems. 2024, 11(4):5308–5318. DOI: 10.1109/TCSS.2023.3342873.
[21] Mohammadi F, Saif M. Blockchain technology in modern power systems: a systematic review. IEEE Systems, Man, and Cybernetics Magazine. 2023, 9(1): 37-47. DOI: 10.1109/MSMC.2022.3201365.
[22] Rajeyyagari S, Saravanan M, Pandey PS, Devi A, Shankar SS. Convolutional Neural network-based African vulture optimization algorithm for the enhancement of cybersecurity in the blockchain-based Smart grid. Multimedia Tools and Applications. 2024, 83(20): 58527–58553. DOI: 10.1007/s11042-023-17805-5.
[23] Li P, Ye D. Vulnerability analysis of distributed state estimator under false data injection attacks. IEEE Transactions on Information Forensics and Security. 2024, 19(5): 5235–5244. DOI: 10.1109/TIFS.2024.3396634.
Biographies

Dongxi Lu (October 1998–), male, graduated from Shanghai Jiao Tong University with a master’s degree. After graduation, I worked as a senior engineer at the Power Dispatch Control Center of Guangdong Power Grid Co., Ltd. My current research direction is engaged in network security work for power distribution monitoring systems.

Chenwei Yang (January 1998–), male, graduated from Tongji University with a master’s degree. After graduation, I worked as an engineer at the Power Dispatch Control Center of Guangdong Power Grid Co., Ltd. My current research direction is engaged in network security work for power monitoring systems.

Yu Liang (August 1999–), male, graduated from Nanyang Technological University in Singapore with a Bachelor’s degree in Electrical Engineering. After graduation, I worked as an engineer at Southern Power Grid Digital Enterprise Technology (Guangdong) Co., Ltd. My current research direction is engaged in network security work for power monitoring systems.
Journal of Cyber Security and Mobility, Vol. 15_2, 391–414
doi: 10.13052/jcsm2245-1439.1525
© 2026 River Publishers