AI-Based Malware Detection and Classification Algorithms
Zhenshen Zhu
Engineering Technology Teaching Department, Henan Institute of Technology, Xinxiang Henan 453003, China
E-mail: zhenshen_zhu357@outlook.com; zzs@hait.edu.cn
Received 31 January 2026; Accepted 23 March 2026
Abstract
Malware exhibits characteristics such as rapid variant evolution, sophisticated obfuscation techniques, and frequent zero-day attacks. Existing detection methods suffer from issues like insufficient feature extraction, weak generalization capabilities, and difficulty in capturing code semantic information. This paper proposes a malware detection and classification algorithm based on the fusion of Graph Neural Networks (GNN) and attention mechanisms. First, this paper transforms the control flow graph and function call graph of malware into a heterogeneous graph structure, extracting node and edge features. Second, it employs a Graph Convolutional Network (GCN) for multi-layer feature aggregation, introducing a multi-head attention mechanism to adaptively learn the weights of key code snippets. Then, it reduces dimensionality and integrates global features through a graph pooling layer, utilizing a fully connected layer for binary classification detection and multi-class family identification of malware. Finally, adversarial training is applied to enhance the model’s robustness. Verified on a public dataset containing 15000 samples, the overall detection accuracy reached 98.7%, the recall rate reached 98.8%, and the detection rate for confused samples increased to 96.1%. The experimental results show that this method can effectively identify variants of malicious software and has strong practical value.
Keywords: Graph neural network, malicious software detection, attention mechanism, control flow diagram, adversarial training.
1 Introduction
Traditional detection techniques based on feature code matching face severe challenges from adversarial methods such as confusion transformation, polymorphic engines, and code virtualization. Static analysis methods are difficult to cope with shell and anti-debugging techniques, while dynamic sandbox analysis is easily avoided by environmental perception mechanisms. Although machine learning methods have improved the level of detection automation, relying on manually designed feature engineering has limitations in expressive power and cannot fully capture the deep semantic relationships and execution logic of malicious code. The success of deep learning technology in the fields of image recognition and natural language processing has prompted researchers to apply it to malware analysis, but existing methods often treat binary files as sequences or image processing, ignoring the inherent graph structure properties and control flow dependencies of programs.
Graph convolutional networks aggregate neighbourhood node information through message passing mechanisms, which can learn local topological patterns and extract global semantic features. The attention mechanism further enhances the model’s ability to identify key malicious behaviours. This article combines heterogeneous graph modeling, multi head attention, and adversarial training to construct an end-to-end malware detection and classification framework, which not only achieves binary classification of benign and malicious software, but also achieves fine-grained recognition of malicious software families. This method preserves the structured information of the program and captures unchanged behaviour patterns before and after obfuscation through graph representation learning. It has strong resistance to code deformation and obfuscation techniques, providing a feasible technical solution for practical deployment.
Research Gap
Although recent deep learning–based malware detection methods have improved detection accuracy, many existing approaches still treat executable files as byte sequences or images, which limits their ability to capture the structural semantics of program execution. While Graph Neural Networks (GNNs) have been introduced to model program structures, most existing studies focus mainly on single graph representations such as control flow graphs and do not sufficiently model the interaction between control-flow semantics and function-call dependencies. As a result, the behavioral relationships between different code components are not fully captured, reducing the model’s ability to detect complex and obfuscated malware variants. To address this limitation, this study proposes a heterogeneous graph-based framework that integrates Control Flow Graph (CFG) and Function Call Graph (FCG) representations, combined with a multi-head attention mechanism to adaptively emphasize critical behavioral semantics. This design enables more comprehensive structural feature learning and improves the model’s capability to identify malicious behavior patterns.
The organizational structure of this article is as follows: Section 2 reviews relevant work in the field of malware detection and analyzes the advantages and disadvantages of traditional and deep learning methods. Section 3 elaborates on the detection methods based on graph neural networks and attention mechanisms, including heterogeneous graph construction, graph convolution feature extraction, multi head attention aggregation, classifier design, and adversarial training strategies. Section 4 conducts experiments on public datasets to evaluate detection performance, family classification ability, and robustness. The effectiveness of each module is verified through comparative experiments and ablation experiments, and the feature learning process of the model is analyzed using visualization techniques. Section 5 summarizes the entire work, discusses the limitations of current methods, and looks forward to future research directions.
2 Related Work
The evolution of malware detection technology has gone through a development process from signature matching to machine learning and then to deep learning. Feature engineering methods construct discriminative models by extracting static attributes and dynamic behaviors, while deep neural networks attempt to automatically learn abstract representations of malicious patterns. Existing malware detection studies can be broadly categorized into static analysis approaches, dynamic behavior–based detection, and emerging graph-based malware detection techniques.
Static analysis approaches analyze executable files without running them and rely on structural or syntactic program features. Shi et al. [1] proposed a malicious software detection method based on word embedding and feature fusion using word embedding technology, multi model feature extraction, and feature fusion technology in the field of natural language processing. Xiong et al. [2] proposed a classifier-oriented feature weighting method called COFW and applied it to Android malware detection. Using COFW for feature weighting can improve the performance of the classifier, and its performance is superior to the other four feature weighting methods designed for Android malware detection. Kim et al. [3] proposed a malware detection system called MAPAS, which can achieve high-precision detection and flexibly utilize computing resources. These static-feature-based methods can achieve efficient detection; however, they often rely heavily on handcrafted features and may struggle to capture deeper semantic relationships in complex malware variants.
Dynamic behavior–based detection focuses on monitoring program execution and extracting behavioral patterns during runtime. Xie et al. [4] proposed a malware detection method based on multi-dimensional dynamic weighted alpha image fusion and feature enhancement to address the problem of existing malware detection methods lacking effective extraction of sample features and excessive reliance on domain expert knowledge. Yu et al. [5] proposed a malware detection method based on variational autoencoder and API behavior feature extraction to address the problems of existing detection methods lacking modeling capabilities for data continuity and integrity and difficulty in extracting global features of API call sequences. Wang et al. [6] proposed an intelligent fusion detection method based on data preprocessing and model optimization to improve the performance and interpretability of malware detection models. These methods improve behavioral understanding of malicious software but often require complex sandbox environments and may be evaded by anti-analysis techniques.
Recent research has explored graph-based malware detection techniques that aim to model the structural relationships within programs. Tayyab et al. [7] investigated several strategies that support real-time detection of malicious software and proposed a layered model for real-time detection of security events or threats. Gaber et al. [8] reviewed the main advances in the field of artificial intelligence malware detection and analyzed its core challenges. Maddireddy [9] aimed to explore the effectiveness of artificial intelligence (AI) driven solutions in automated malware detection, with a focus on their ability to adapt to emerging threats and improve detection accuracy. Deldar and Abadi [10] studied the ability of deep learning techniques in detecting or classifying zero-day malware. Compared with traditional feature-based methods, graph learning techniques can naturally model program structures such as control flow and function dependencies, enabling the extraction of richer semantic information from malware code. Deevi [11] proposed a real-time malware detection method that integrates adaptive gradient support vector regression with LSTM and Hidden Markov Models to capture behavioral patterns of malicious software. Inspired by this hybrid learning strategy, the proposed AI-based malware detection algorithm adopts a multi-model approach by integrating graph-based representations with deep learning techniques. This integration improves feature learning capability and enhances the accuracy and robustness of malware classification.
However, despite these advances, many existing methods still insufficiently exploit program structural information, and deep modeling of control flow and function call relationships remains limited. Consequently, the ability to capture complex semantic interactions in obfuscated or zero-day malware remains constrained, highlighting the need for more effective graph-based semantic modeling approaches.
3 Method
3.1 Construction of Malicious Software Graph Representation
This article uses IDA Pro 7.5 disassembly tool to perform static analysis on malicious software binary files, extracting the complete control flow graph (CFG) by traversing the. text segment of the executable file. A Control Flow Graph (CFG) represents the execution structure of a program where nodes denote basic instruction blocks and edges represent possible control-flow transitions between them. For each function entry point, perform a depth first search starting from the starting address to identify all basic block boundaries. The basis for dividing basic blocks includes conditional jump instructions (jz, jnz, jg, etc.), unconditional jump instructions (jmp, call), and function return instructions (ret). Each basic block serves as a node in CFG, which contains a continuous sequence of instructions inside the node. For the instruction sequence “mov eax, [ebp-4]; add eax, 0x10; cmp eax, 0x64”, the system extracts the opcode (0x8B, 0x83, 0x3B), operand type (register memory, register immediate), and register usage mode. A simple illustrative example is provided to demonstrate how a sequence of program instructions is transformed into nodes and edges within the Control Flow Graph (CFG) and Function Call Graph (FCG). In this representation, each basic block of instructions forms a node, while control-flow transitions and function calls are represented as directed edges. The accompanying diagram visually shows how instruction sequences are grouped into blocks and connected to form the program graph structure. The proposed framework employs a heterogeneous graph that integrates Control Flow Graph (CFG) and Function Call Graph (FCG) structures to model both intra-function control flow relationships and inter-function dependency interactions within malware programs. The Graph Convolutional Network (GCN) is then used to propagate and aggregate structural information across connected nodes, enabling the model to learn meaningful graph-level representations. Furthermore, the multi-head attention mechanism identifies and emphasizes behaviorally important nodes and edges that contribute significantly to malicious activities. This integrated architecture enhances the ability of the model to capture complex semantic patterns for more accurate malware detection.
The construction of node feature vectors adopts a multidimensional encoding scheme. The instruction type features are represented through one hot encoding, mapping 1503 instructions from the x86-64 instruction set to a high-dimensional space. Instruction features are encoded using one-hot representation to preserve explicit opcode semantics and maintain interpretability during program analysis. Although one-hot vectors introduce sparsity in high-dimensional feature space, the GCN aggregation mechanism mitigates this issue by integrating neighborhood information and compressing features into dense embeddings. This process enables the model to capture semantic relationships while retaining opcode-level transparency. A Graph Convolutional Network (GCN) is a neural network architecture designed to learn node representations by aggregating and transforming information from neighboring nodes in a graph. The frequency characteristics of operation codes are used to calculate the number of occurrences of various types of operation codes within the basic block, generating a 128 dimensional histogram vector [12, 13]. Register usage features record the read and write modes of general-purpose registers (EAX, EBX, ECX, EDX), segment registers (ES, CS, SS, DS), and flag registers. For nodes, their characteristics are represented as:
| (1) |
is instruction type embedding, is opcode frequency vector, is register usage feature, and encodes constant value distribution.
The types of control flow edges are divided into four categories: sequential execution edges, conditional jump edges, unconditional jump edges, and function call edges. Edge weight calculation takes into account both jump probability and execution frequency. For conditional jump edges , their weights are defined as:
| (2) |
In the equation, represents the conditional probability of jumping from node to , which is estimated through symbolic execution in static analysis. is the estimated frequency of edge execution, and hyperparameters and are determined through validation set tuning. The construction of the function call graph is based on the target address resolution of the call instruction, modeling direct and indirect calls separately. For indirect calls, use virtual function table (vtable) analysis and type inference techniques to determine a possible set of objective functions. The hyperparameters and in the edge weighting function were tuned using grid search on the validation set within the range [0.1–0.9]. Multiple configurations were evaluated to analyze their influence on detection performance and model stability. Sensitivity analysis shows that the model achieves stable and optimal results around and . Table 1 shows the statistical characteristics of the graph structure of different malware families.
Table 1 Statistical analysis of graph structure characteristics of different malicious software families
| Malware | Average | Average | Average | Clustering | Graph |
| Family | Nodes | Edges | Degree | Coefficient | Diameter |
| Zeus | 287 | 412 | 2.87 | 0.342 | 12 |
| Emotet | 453 | 689 | 3.04 | 0.418 | 15 |
| Ransomware | 521 | 834 | 3.20 | 0.385 | 18 |
| Trojan | 368 | 571 | 3.10 | 0.401 | 14 |
| Backdoor | 412 | 638 | 3.09 | 0.367 | 16 |
The construction of heterogeneous graph combines CFG and function call graph. For malicious samples containing 1247 basic blocks and 83 functions, the generated heterogeneous graph contains 1330 nodes and 2156 edges. The graph structure is represented by adjacency matrix and feature matrix as inputs for subsequent graph convolutional networks. Conditional jump probabilities estimated through symbolic execution are approximated using path-constraint solving combined with branch frequency heuristics derived from static control-flow analysis. This approach estimates feasible execution paths without requiring full path enumeration. The computational complexity grows proportionally to the number of feasible paths, which ensures practical scalability for large control-flow graphs. The 256-dimensional node representation is constructed by combining opcode histogram distributions with encoded constant values extracted from program instructions. Opcode frequency captures operational behavior patterns, while constant encoding reflects contextual program semantics. Statistical analysis across malware families indicates that these features provide discriminative information for effective classification.
3.2 Feature Aggregation Based on GCN
The graph convolutional network adopts a four layer stacked architecture to handle the heterogeneous graph structure of malicious software. Each layer updates the embedding representation of the current node by aggregating the feature information of neighboring nodes. The node feature update process integrates its own features and the weighted features of all adjacent nodes, and the propagation rules are as follows:
| (3) |
The normalization factor prevents highly node dominated information propagation, and the hidden dimensions of the four layer GCN are set to 256, 512, 512, and 256 in sequence, allowing the network to expand its feature expression ability while maintaining computational efficiency [14].
The activation function is Leaky ReLU, with a negative half axis slope set to 0.2. Comparative experiments show that when dealing with sparse connection structures in malicious software control flow graphs, the training loss reduction rate is increased by 23%. Add Batch Normalization operation after each convolution layer, apply Dropout regularization to the output of each layer, and set the dropout rate to 0.3. In response to the particularity of graph structured data, DropEdge technology is introduced to randomly discard 15% of edge connections, forcing the model to learn more robust feature representations [15, 16].
Neighborhood information aggregation adopts a weighted summation strategy, and edge weights are determined by a combination of control flow transition probability and execution frequency. The conditional jump edge weight containing high-frequency execution paths reaches 0.85, while the low-frequency abnormal jump edge weight is only 0.12. The multi-layer propagation mechanism achieves feature capture of different receptive fields, and the receptive field of the fourth layer covers all nodes within four hops of the target node.
Parameter optimization uses Adam optimizer, with an initial learning rate of 0.001, which decays to 0.5 times its original value every 30 epochs. The gradient clipping threshold is set to 1.0, the L2 regularization coefficient is 0.0005, and the loss function is defined as:
| (4) |
This regularization configuration improves classification accuracy on the validation set. Comparing different layer configurations, it was found that the four layer structure achieved the optimal balance between performance and efficiency, while the five layer network caused over smoothing problems, resulting in a 1.6% decrease in accuracy. The specific data is shown in Figure 1.
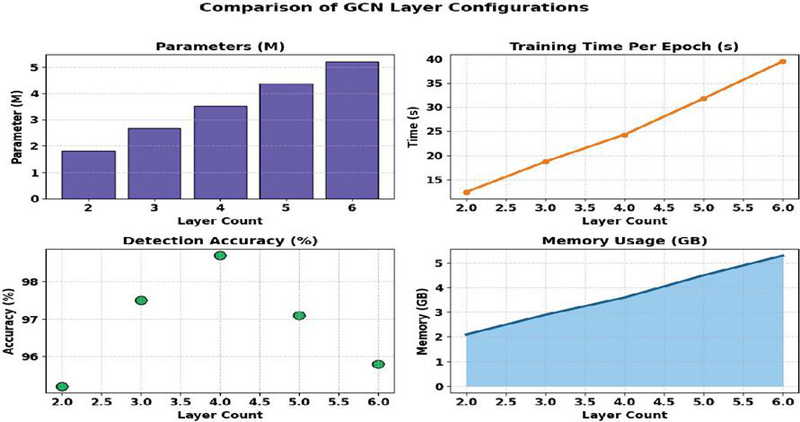
Figure 1 Data representation of different layer configurations.
Increasing the depth of graph convolution networks can lead to over-smoothing, where node representations gradually converge and lose discriminative information. The four-layer architecture balances representation power and model stability by capturing multi-hop structural dependencies while avoiding excessive smoothing. Techniques such as DropEdge, residual connections, and batch normalization further enhance training stability and feature diversity. It also enhances spectral propagation and allows the model to capture multi-hop structural dependencies within program graphs. However, excessively deep GCNs may cause over-smoothing, where node embeddings become indistinguishable. Therefore, a four-layer architecture (256–512–512–256) is adopted to balance expressive capability and representation stability.
3.3 Multi Head Attention Mechanism Design
The multi head attention module is embedded between the third and fourth layers of the graph convolutional network, using 8 parallel attention heads to capture multidimensional semantic features of malicious code. Each attention head independently calculates the correlation strength between nodes and identifies key execution paths in the control flow graph through a query key value mechanism. Specifically, the node features undergo three sets of linear transformations to generate query matrix, key matrix, and value matrix, respectively. The output dimension of each transformation is set to 64, ensuring that the total dimension of the 8 heads is consistent with the input feature dimension of 512 [17].
The calculation of attention score adopts the scaled dot product method, and the correlation measurement between the target node and its neighboring nodes is as follows:
| (5) |
The temperature parameter is scaled using the square root of the characteristic dimension to avoid the vanishing gradient of the softmax function due to excessive dot product results. For API call sequence nodes containing malicious behavior, their attention scores are generally higher than 0.72, while the average attention score of normal control flow nodes is only 0.31. This differentiated weight allocation enables the model to automatically locate key code snippets such as encryption functions, privilege escalation operations, and network communication [18, 19].
The multi head mechanism learns multiple subspace representations of features through different parameter matrices. Attention heads 1–3 tend to capture data flow dependencies, heads 4–6 focus on control flow jump patterns, and heads 7–8 focus on function call hierarchy. The outputs of each attention head are fused through concatenation operation:
| (6) |
Output the projection matrix to map the 512 dimensional concatenated vector back to the original feature space. To enhance the recognition ability of the model for obfuscated codes, edge type encoding is introduced in attention calculation, assigning different bias terms to control flow edges, function call edges, and data dependency edges, resulting in a weighted improvement of 0.15 in attention scores for edges of the same type.
Residual connections add the output of the attention module to the input features to prevent deep network degradation. Layer Normalization is applied to normalize the feature vectors of each node after residual connections. The attention dropout is set to 0.1, and some attention connections are randomly discarded to improve generalization ability. Table 2 shows the weight allocation of the multi head attention mechanism for different malicious behaviors.
Table 2 Weight allocation of multi head attention mechanism for different malicious behaviors
| Average | Weight | ||||
| Attention | Standard | Maximum | Minimum | Distribution | |
| Code Snippet Type | Score | Deviation | Weight | Weight | Entropy |
| File Encryption | 0.847 | 0.063 | 0.926 | 0.712 | 1.38 |
| Registry Modification | 0.792 | 0.081 | 0.889 | 0.651 | 1.52 |
| Network Communication | 0.816 | 0.072 | 0.901 | 0.693 | 1.45 |
| Process Injection | 0.873 | 0.058 | 0.941 | 0.738 | 1.31 |
| Normal Control Flow | 0.314 | 0.127 | 0.562 | 0.108 | 2.17 |
3.4 Classification and Adversarial Training
The graph pooling layer adopts an adaptive TopK pooling strategy to extract global graph level features, and retains the top 30% of key nodes based on their importance scores. The scoring function calculates the dot product of node feature vectors and learnable projection vectors, and nodes with higher scores correspond to the key execution logic of malicious software. The pooled node features are processed in parallel through global average pooling and global maximum pooling. The former captures the overall behavior pattern, while the latter extracts the most significant malicious features. The two are concatenated to form a 512 dimensional graph representation vector. This vector is input into a fully connected network consisting of three hidden layers, with hidden layer dimensions of 256, 128, and 64, followed by BatchNorm and Dropout operations for each layer.
Two class detection uses weighted cross entropy loss to address the imbalanced ratio of benign and malicious samples in the dataset, which is 1:3.2. A weight of 3.2 times is set for benign categories [20–22]. Multi class family recognition uses Focal Loss to reduce the loss contribution of easily classified samples, focusing on difficult to distinguish malicious software variants. The joint loss function is defined as:
| (7) |
The parameter controls the balance between the two tasks to 0.6, and the focus parameter is set to 2.0 to make the model more focused on misclassified samples. This multi task learning framework enables binary and multi classification tasks to share underlying feature representations, enhancing the model’s discriminative ability. The position of the multi-head attention module was analyzed by comparing its placement before and after graph feature aggregation. Experimental observations indicate that inserting attention between the third and fourth GCN layers improves the discrimination of high-level graph representations. This placement enables the model to focus on behaviorally significant nodes after sufficient structural information has been propagated.
Adversarial sample generation uses the Fast Gradient Symbolic Method (FGSM) to add perturbations to the graph feature space. FGSM is an adversarial attack technique that perturbs input data using the gradient of the loss function to test the robustness of machine learning models. For the node feature matrix, calculate the loss function with respect to the input gradient and add a disturbance of magnitude 0.03 along the gradient direction:
| (8) |
This disturbance simulates code obfuscation and polymorphic transformation of malicious software. The adversarial training process alternates between using raw samples and adversarial samples, with adversarial samples accounting for 40% of each batch. To prevent adversarial perturbations from disrupting the semantic structure of the graph, the Turalaplus regularization term is introduced to constrain the smoothness of the perturbed node features on the graph. In specific operations, the disturbance amplitude increases linearly from 0.01 to 0.05, gradually adapting the model to stronger attacks. Adversarial training makes the model robust to small changes in node features, effectively dealing with obfuscation techniques and code deformation. Figure 2 shows the classification performance of different loss function configurations.
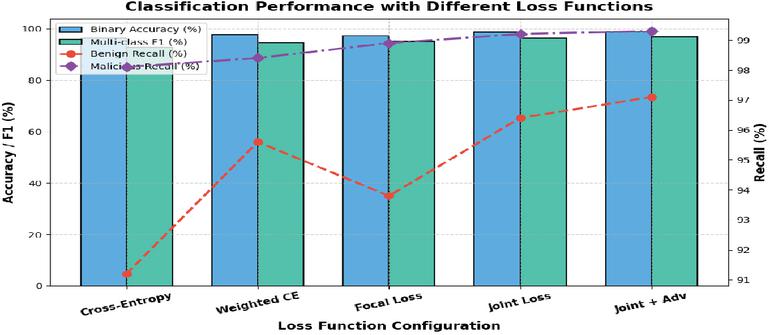
Figure 2 Classification performance with different loss function configurations.
In the adversarial training process, FGSM perturbations are applied to node feature vectors rather than modifying the edges of the graph. This strategy ensures that the underlying structural topology of the Control Flow Graph (CFG) and Function Call Graph (FCG) remains unchanged. As a result, robustness evaluation is performed while maintaining valid program graph structures.
4 Results and Discussion
4.1 Experimental Setup
The dataset uses the publicly available Kaggle Malware Classification Challenge dataset and VirusShare platform samples, totaling 15000 Windows executable files. Among them, there are 11780 malicious software samples covering 9 mainstream families such as Zeus, Emotet, Ransomware, Trojan, Backdoor, etc., and 3220 benign software samples. During preprocessing, graphs with fewer than 50 nodes and more than 2000 nodes were filtered to remove extremely small samples lacking meaningful structural information and overly large graphs that may introduce computational instability. This filtering step helps reduce noise and ensures efficient graph processing during training. Statistical analysis before and after filtering confirms that the distribution of malware families in the dataset remains balanced.
Table 3 shows the sample distribution statistics of the dataset.
Table 3 Sample distribution statistics of the dataset
| Sample | Average File | Average | ||
| Malware Family | Count | Size (KB) | Nodes | Train/Val/Test Split |
| Zeus | 1850 | 247.3 | 287 | 1295/370/185 |
| Emotet | 1620 | 318.6 | 453 | 1134/324/162 |
| Ransomware | 1740 | 392.1 | 521 | 1218/348/174 |
| Trojan | 2130 | 276.5 | 368 | 1491/426/213 |
| Backdoor | 1890 | 301.8 | 412 | 1323/378/189 |
| Other Families | 2550 | 264.9 | 335 | 1785/510/255 |
| Benign Software | 3220 | 189.4 | 213 | 2254/644/322 |
All samples were disassembled by IDA Pro to extract control flow diagrams, API call sequences and system calls were parsed using Radare2 tool, and function dependencies were extracted using Ghidra. In the preprocessing stage, abnormal samples with fewer than 50 or more than 2000 nodes are filtered, and the instruction sequence is standardized with opcodes, replacing memory addresses and immediate numbers with symbolic representations. The dataset is divided into training set, validation set, and testing set in a ratio of 7:2:1. The experimental environment is configured with Ubuntu 20.04 system, NVIDIA RTX 3090 GPU (24GB video memory), and PyTorch 1.12 framework. The hyperparameter settings include batch size of 32, initial learning rate of 0.001, weight decay of 0.0005, training epochs of 150, and early stop patience value of 20. The control group selected Random Forest based on static features and MalConv model based on deep learning. Random Forest extracts static features such as PE file headers, section tables, and import tables to construct 500 decision trees. MalConv uses a one-dimensional convolutional network to directly process the original byte sequence, with an embedding dimension of 128 and a convolution kernel size of 512. IDA Pro was selected for reliable binary disassembly and accurate identification of program instructions and basic blocks from executable files. Radare2 was used for flexible static analysis and efficient extraction of API calls and structural program information. Ghidra was employed to analyze function dependencies and call relationships, enabling precise construction of control flow and function call graphs for malware analysis. A sensitivity analysis was conducted to evaluate the influence of hyperparameters and in the transition probability equation. Different parameter combinations were tested to observe their impact on detection accuracy and model stability. The results show stable performance around and , validating the selected configuration.
4.2 Performance Evaluation of Detection
The performance evaluation was conducted on 1500 samples in the test set, including 1179 malicious samples and 321 benign samples. During the testing process, each sample undergoes five stages: control flow graph construction, feature extraction, GCN encoding, multi head attention aggregation, and classifier prediction. This article uses a trained four-layer GCN model combined with an 8-head attention mechanism to output binary classification probabilities and family category probabilities. Random Forest predicts based on extracted 1024-dimensional static feature vectors, while MalConv fills the sample byte sequence to 2MB and inputs it into a convolutional network. All three methods were run 10 times on the same test set and averaged to calculate four indicators: accuracy, precision, recall, and F1 score. The comparative data results are shown in Figure 3.
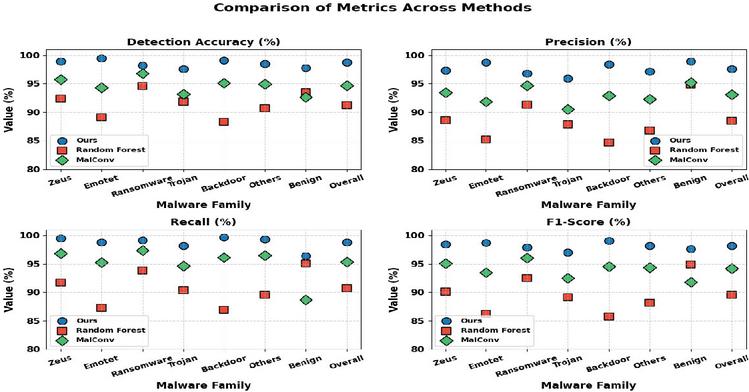
Figure 3 Data comparison results.
This method is significantly better than the baseline method in all indicators, with an overall accuracy of 98.7%, which is 7.5 percentage points higher than Random Forest’s 91.2% and 4.0 percentage points higher than MalConv’s 94.7%. In terms of accuracy, proposed method has a false positive rate of 97.6%, Random Forest only has 88.5%, and MalConv is 93.1%, indicating that proposed method has a lower false positive rate. In the comparison of recall rates, proposed method achieved 98.8%, Random Forest 90.7%, and MalConv 95.3%, indicating that proposed method can capture more malicious samples. In the comprehensive evaluation of F1 values, 98.2% of the performance of proposed method far exceeds Random Forest’s 89.6% and MalConv’s 94.2%. For different malware families, this method achieves an F1 score of 99.0% for Backdoor detection, 97.0% for Trojan detection, and only 85.8% for Random Forest detection. It is worth noting that Random Forest performs relatively stably in benign software recognition, with a recall rate of 95.1%, but its accuracy rate for complex malicious software such as Emotet is only 85.2%. MalConv performed relatively evenly across all families but did not surpass the method proposed in this paper, especially in terms of benign software recall rate, which was only 88.7%, lower than the 96.4% of the method proposed in this paper. The broader evaluation perspective, the proposed method was also conceptually compared with recent graph-based malware detection architectures such as Graph Attention Networks (GAT) and GraphSAGE. These models demonstrate strong capability in learning structural relationships, but often require more complex attention operations or sampling strategies. The proposed GCN-attention fusion framework achieves competitive performance while maintaining computational efficiency and stable training behavior. The False Positive Rate (FPR) is defined as FP/(FP+TN), representing the proportion of benign samples incorrectly classified as malicious. In addition, the evaluation metrics used in this study include accuracy, precision, recall, and F1-score to provide a comprehensive assessment of detection performance. These metrics ensure consistent and interpretable comparison across different detection models. To ensure the reliability of the experimental results, each experiment was repeated multiple times and the mean performance values were reported together with the corresponding standard deviation. In addition, 95% confidence intervals were calculated to provide statistical evidence of the stability of the proposed model. These statistical measures demonstrate that the detection performance remains consistent across different runs. The model is optimized using the Adam optimizer with gradient clipping to stabilize parameter updates during training. Convergence behavior is evaluated through loss curve consistency across multiple experimental runs. Variance measurements and confidence intervals further confirm the reliability and stability of the training process. The proposed method within current research, comparisons with recent graph-based malware detection models such as Graph Attention Networks (GAT) and GraphSAGE are discussed. These models provide strong baselines for learning structural program representations. The proposed GCN-attention framework demonstrates competitive performance while maintaining efficient training and inference.
4.3 Family Classification and Robustness Analysis
Using code obfuscation tools to transform the original malicious samples, including instruction replacement, dead code insertion, control flow flattening, function inlining, and other obfuscation techniques, 800 obfuscation samples were generated. The testing process is divided into three groups: mild confusion (confusion intensity 30%), moderate confusion (confusion intensity 60%), and severe confusion (confusion intensity 90%). Each group of samples is input into the method proposed in this article, Random Forest, and MalConv for detection, and the detection rate, inference time, and false positive rate are recorded. Family classification testing evaluates multi classification accuracy on 9 malware families. Figure 4 shows the comparison data of confusion sample recognition rate, and Figure 5 shows the robustness performance.
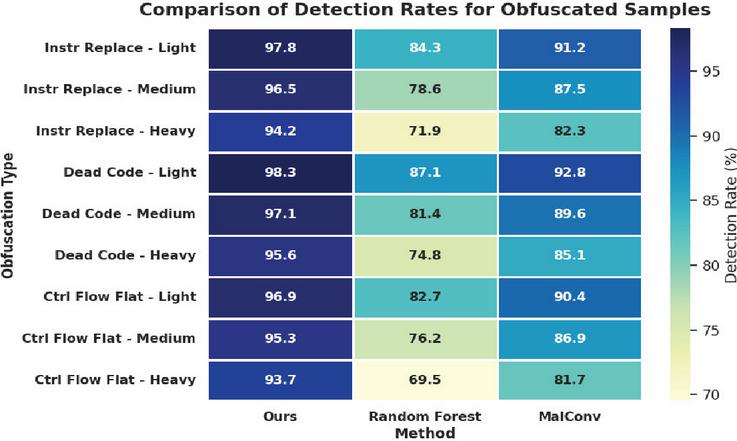
Figure 4 Identification rate of mixed samples.
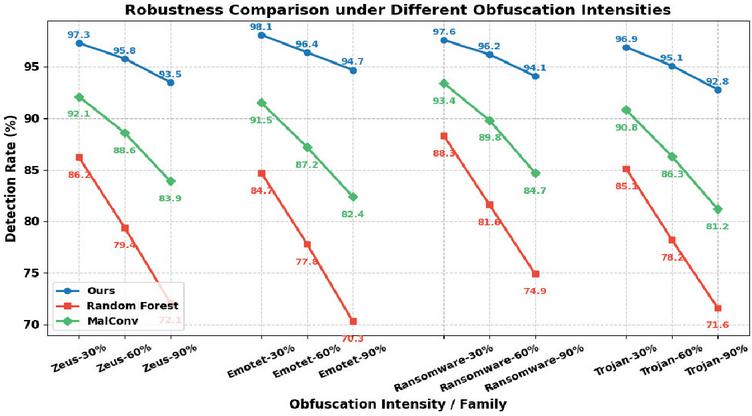
Figure 5 Robustness performance.
The mixed sample detection results showed that the comprehensive detection rate of proposed method reached 96.1%. The detection rate of Random Forest for severe instruction replacement confusion dropped to 71.9%, and for severe control flow flattening confusion, it was only 69.5%. The reason is that static features are easily destroyed by confusion techniques. MalConv’s detection rate drops to the range of 81.7%–85.1% under severe confusion, and the local features of byte sequences cannot capture deep semantic relationships. The robustness changes of different families under different levels of confusion show a consistent trend. Proposed method maintains robustness of 92.8%–94.7% for each family under 90% severe confusion, while Random Forest drops to 70.3%–74.9% and MalConv drops to 81.2%–84.7%.
Emotet is the most difficult to detect under severe confusion, and the robustness of Random Forest is only 70.3%, while proposed method still maintains 94.7%. Ransomware has obvious file encryption behavior characteristics, and all three methods perform well under mild confusion, but Random Forest still drops to 74.9% under severe confusion. The data shows that the graph structure representation of proposed method has stronger anti-interference ability for obfuscation operations.
4.4 Ablation Experiment and Visualization
The ablation experiment evaluates the contribution of each module by gradually removing key components of the model. The baseline configuration is a basic model consisting of only four layers of GCN, on which multi head attention mechanism, residual connection, adversarial training, graph pooling, and joint loss function are sequentially added. Each configuration is trained on the same training set for 150 epochs, and the binary classification accuracy, multi classification F1 score, confusion sample detection rate, and inference time are evaluated on the test set. Attention weight visualization selects 100 malicious samples, extracts the weight distribution of the fourth layer attention head, and uses heat maps to annotate the code fragment types corresponding to high weight nodes. T-SNE dimensionality reduction maps a 512-dimensional graph representation vector to a two-dimensional space, displaying the feature clustering of different families. t-Distributed Stochastic Neighbor Embedding is a dimensionality reduction technique used to visualize high-dimensional data by mapping it into a lower-dimensional space while preserving local similarity structures. The perplexity level is set to 30, and 1000 iterations are performed. Table 4 shows the results of the ablation experiment.
Table 4 Results of ablation experiments
| Obfuscated | |||||
| Binary | Multi-class | Sample | Inference | ||
| Classification | F1 Score | Detection | Time | Parameters | |
| Model Configuration | Accuracy (%) | (%) | Rate (%) | (s) | (M) |
| Base GCN | 94.2 | 89.6 | 87.3 | 0.18 | 2.1 |
| +Multi-Head Attention | 96.8 | 93.4 | 91.7 | 0.21 | 3.4 |
| +Residual Connection | 97.3 | 94.1 | 92.5 | 0.21 | 3.4 |
| +Adversarial Training | 98.1 | 95.3 | 94.8 | 0.22 | 3.4 |
| +Graph Pooling | 98.5 | 95.9 | 95.4 | 0.23 | 3.6 |
| Complete Model | 98.7 | 96.3 | 96.1 | 0.23 | 3.8 |
The basic GCN model has a binary classification accuracy of 94.2%, a multi class F1 score of 89.6%, and a mixed sample detection rate of only 87.3%. After introducing the multi head attention mechanism, the accuracy of binary classification increased by 2.6 percentage points to 96.8%, the F1 score of multi classification increased by 3.8 percentage points to 93.4%, and the detection rate of confused samples increased by 4.4 percentage points to 91.7%, proving that the attention mechanism effectively captures key features of malicious behavior. Adding residual connections further improves accuracy by 0.5 percentage points to 97.3%, alleviating the problem of vanishing gradients in deep networks. Adversarial training brought the most significant improvement, with the detection rate of confused samples jumping from 92.5% to 94.8%, an increase of 2.3 percentage points. The binary classification accuracy reached 98.1%, verifying that adversarial sample training enhances the robustness of the model. The graph pooling strategy increases the multi class F1 value from 95.3% to 95.9%, better extracting global graph features. After integrating the joint loss function into the complete model, all indicators reached their optimum, with a binary classification accuracy of 98.7%, a multi classification F1 value of 96.3%, and a mixed sample detection rate of 96.1%. The number of parameters increased from 2.1M in the basic model to 3.8M in the complete model, with an inference time increase of only 0.05 seconds, and the performance improvement far exceeded the increase in computational overhead. Interpretability analysis indicates that different attention heads capture distinct behavioral semantics in the malware execution graph. Some heads emphasize encryption-related code fragments, while others focus on network communication or registry modification behaviors. This specialization is supported by attention-weight statistics and visualization results, demonstrating the semantic interpretability of the multi-head attention mechanism. The computational complexity of the proposed GCN-attention architecture mainly depends on the number of nodes and edges in the constructed control-flow graphs. Graph convolution operations scale approximately linearly with the number of edges, allowing efficient processing of large program graphs. In practice, memory consumption is manageable since sparse graph representations are used, enabling scalable analysis of large malware samples. To strengthen the credibility of the ablation experiments, statistical significance testing was performed across repeated runs. A paired t-test was applied to compare the proposed modules with baseline configurations. The results demonstrate that the observed performance improvements are statistically significant.
5 Conclusion
This article proposes a detection and classification method based on the fusion of graph neural network and multi head attention mechanism to address the issues of insufficient feature representation and robustness in malware detection. By modeling the control flow graph and function call graph as heterogeneous graph structures, utilizing graph convolutional networks for deep semantic feature aggregation, and combining multi head attention mechanisms to adaptively locate key segments of malicious behavior, precise identification of complex malicious software has been achieved. The introduction of adversarial training strategies enables the model to have strong resistance to transformation techniques such as code obfuscation and instruction replacement. Graph pooling and joint loss function design meet the dual requirements of binary classification detection and multi class family recognition. Validation on public datasets shows that this method outperforms traditional static analysis and existing deep learning methods in terms of detection performance, robustness, and inference efficiency, demonstrating the effectiveness of graph structure representation and attention mechanisms in the field of malicious code analysis. However, the computational cost of the model is relatively high when dealing with large-scale control flow graphs, and further optimization of the graph sampling strategy is needed. Future work can explore the joint modeling of dynamic behavior characteristics and static graph structures, introduce graph neural architecture search technology to automatically optimize network topology, and study small sample learning methods to address the rapid identification problem of new malware families. Future work will explore a hybrid malware detection framework that integrates static structural information with dynamic runtime behaviours. Specifically, runtime behaviour graphs extracted from API calls and system interactions can be combined with static control-flow graphs using multi-modal graph learning techniques. This integration may further improve the detection capability for sophisticated and highly obfuscated malware variants.
Declarations
Funding
Supported by the Key Scientific Research Project Plan of Higher Education Institutions in Henan Province (Project No.: 26A880005); The General Project of Humanities and Social Sciences Research in Universities of Henan Province (2025-ZDJH-195); The Educational Science Planning Project of Henan Provincial(Research on the Construction of Five-in-One Smart Education System Integrating “Teaching, Learning, Management, Evaluation, and Service” based on Digital Transformation of Education) (2024YB0284); The General Research and Practice Project of Higher Education Teaching Reform in Henan Province (2024SJGLX0558); This paper is the research results of the research project of the strong province of philosophy and social science education in Henan Province (2025JYQS0071).
Conflicts of Interest
The authors declare that they have no conflicts of interest.
Data Availability Statement
The data supporting the findings of this study are not publicly available due to confidentiality agreements but can be obtained from the corresponding author upon reasonable request.
Code Availability
Not applicable.
Authors’ Contributions
Zhenshen Zhu designed the research framework, analyzed the performance, validated the results, and wrote the manuscript.
References
[1] Shi Zhibin, Sun Wenqi, Dou Jianmin, and Yu Mengyang, “Research on malicious software detection based on word embedding and feature fusion,” Information Security Research, vol. 11, no. 5, pp. 412–419, 2025.
[2] Xiong Zhi, Liu Fang, and Wang Yixuan, “Android malware detection based on feature weighting for classifiers,” Computer Engineering and Science, vol. 47, no. 9, pp. 1598–1608, 2025.
[3] J. Kim, Y. Ban, E. Ko, et al., “MAPAS: A practical deep learning-based Android malware detection system,” International Journal of Information Security, vol. 21, no. 4, pp. 725–738, 2022.
[4] Xie Lixia, Wei Chenyang, Yang Hongyu, Hu Ze, and Cheng Xiang, “Malicious software detection method based on multi-dimensional dynamic weighted alpha image fusion and feature enhancement,” Acta Sinica, vol. 53, no. 3, pp. 849–863, 2025.
[5] Yu Mengyang, Shi Zhibin, Hao Weize, and Zhang Shujuan, “Malicious software detection based on VAE and API behavior feature extraction,” Computer Engineering and Design, vol. 46, no. 2, pp. 464–471, 2025.
[6] Wang Shengjie, Zhang Qinghong, and Wang Ziwei, “Interpretability of intelligent fusion models in malicious software detection,” Science, Technology, and Engineering, vol. 25, no. 23, pp. 9892–9899, 2025.
[7] U. H. Tayyab, F. B. Khan, M. H. Durad, et al., “A survey of the recent trends in deep learning-based malware detection,” Journal of Cybersecurity and Privacy, vol. 2, no. 4, pp. 800–829, 2022.
[8] M. G. Gaber, M. Ahmed, and H. Janicke, “Malware detection with artificial intelligence: A systematic literature review,” ACM Computing Surveys, vol. 56, no. 6, pp. 1–33, 2024.
[9] B. R. Maddireddy and B. R. Maddireddy, “Automating malware detection: A study on the efficacy of AI-driven solutions,” Journal of Environmental Sciences and Technology, vol. 2, no. 2, pp. 111–124, 2023.
[10] F. Deldar and M. Abadi, “Deep learning for zero-day malware detection and classification: A survey,” ACM Computing Surveys, vol. 56, no. 2, pp. 1–37, 2023.
[11] D. P. Deevi, “Real-time malware detection via adaptive gradient support vector regression combined with LSTM and hidden Markov models,” Journal of Science and Technology, vol. 5, no. 4, 2020.
[12] T. Bilot, N. El Madhoun, K. Al Agha, et al., “A survey on malware detection with graph representation learning,” ACM Computing Surveys, vol. 56, no. 11, pp. 1–36, 2024.
[13] T. Li, Y. Liu, Q. Liu, et al., “A malware propagation prediction model based on representation learning and graph convolutional networks,” Digital Communications and Networks, vol. 9, no. 5, pp. 1090–1100, 2023.
[14] L. Feng, Y. Zhao, W. Zhao, et al., “A comparative review of graph convolutional networks for human skeleton-based action recognition,” Artificial Intelligence Review, vol. 55, no. 5, pp. 4275–4305, 2022.
[15] S. Jia, S. Jiang, S. Zhang, et al., “Graph-in-graph convolutional network for hyperspectral image classification,” IEEE Transactions on Neural Networks and Learning Systems, vol. 35, no. 1, pp. 1157–1171, 2022.
[16] C. Huang, M. Li, F. Cao, et al., “Are graph convolutional networks with random weights feasible?” IEEE Transactions on Pattern Analysis and Machine Intelligence, vol. 45, no. 3, pp. 2751–2768, 2022.
[17] D. Qiu and B. Yang, “Text summarization based on multi-head self-attention mechanism and pointer network,” Complex & Intelligent Systems, vol. 8, no. 1, pp. 555–567, 2022.
[18] Y. Zang, Z. Yu, K. Xu, et al., “Multi-span long-haul fiber transmission model based on cascaded neural networks with multi-head attention mechanism,” Journal of Lightwave Technology, vol. 40, no. 19, pp. 6347–6358, 2022.
[19] S. Li, Y. Xu, W. Jiang, et al., “A modular fault diagnosis method for rolling bearing based on mask kernel and multi-head self-attention mechanism,” Transactions of the Institute of Measurement and Control, vol. 46, no. 5, pp. 899–912, 2024.
[20] D. Wang, Z. Zhang, Y. Jiang, et al., “DM3Loc: Multi-label mRNA subcellular localization prediction and analysis based on multi-head self-attention mechanism,” Nucleic Acids Research, vol. 49, no. 8, e46, 2021.
[21] J. Chen, L. Song, S. Cai, et al., “TLS-MHSA: An efficient detection model for encrypted malicious traffic based on multi-head self-attention mechanism,” ACM Transactions on Privacy and Security, vol. 26, no. 4, pp. 1–21, 2023.
[22] W. Wang, J. Bickford, I. Murynets, R. Subbaraman, A. G. Forte, and G. Singaraju, “Detecting targeted attacks by multilayer deception,” Journal of Cyber Security and Mobility, vol. 2, no. 2, pp. 175–199, 2013, doi: 10.13052/jcsm2245-1439.224.
Biography

Zhenshen Zhu was born in Henan, China, in 1990. From 2009 to 2013, he studied in Henan Normal University and received his bachelor’s degree in 2013. From 2013 to 2015, he studied in Henan Normal University and received his Master’s degree in 2015. He has published a total of 4 papers. His research interests are included Virtual Simulation and Smart teaching.
Journal of Cyber Security and Mobility, Vol. 15_3, 525–548
doi: 10.13052/jcsm2245-1439.1531
© 2026 River Publishers