Blockchain Traceability and Visual Warning Based on Merkle Tree in Enterprise Data Assetization Transformation
Qingtong Meng
Shandong Healthcare Group Big Data Co. Ltd., Jinan, 250101, China
E-mail: qingtong2026111@163.com
Received 25 February 2026; Accepted 14 July 2026
Abstract
Large enterprise groups face issues such as low efficiency in data traceability and a disconnect between security and visualization in their data assetization transformation. Therefore, this paper raises a security threat perception and visualization warning model based on data visualization and blockchain traceability algorithm. This model combines Merkle Tree (MT), double hash chain, attribute encryption, and zero knowledge proof to achieve lightweight on chain auditing and privacy protection. It also collaborates with ForceTars2 and layered edge binding layout to generate dynamic risk topology, supporting full lifecycle trusted auditing and real-time threat perception. The experiment on the self-made enterprise supply chain threat perception dataset shows that the threat detection rate of the model is 98.11%, the false alarm rate is only 0.82%, the visual cognitive efficiency is 96.83%, the trusted data asset utilization rate is 96.82%, and the delay is controlled within 100 ms. Superior to existing mainstream solutions such as lightweight tracking algorithms based on MT and attribute based encryption privacy protection algorithms. The experimental results demonstrate that the model has good accuracy and applicability in enterprise level data security governance, providing an integrated governance solution with high concurrency, low latency, and high trustworthiness for data assetization transformation.
Keywords: Data assetization transformation, visualization, blockchain traceability, lightweight data on-chaining, force-directed layout algorithm.
1 Introduction
Large enterprise groups face core challenges in the process of data assetization transformation, including unclear data ownership, non-transparent circulation, and difficulties in tracing security risks. Building a technical framework that integrates trusted traceability, security management, and visual monitoring becomes the key to supporting the market-oriented allocation of data elements [1]. Current work in this field mainly focuses on blockchain, but systematic solutions that deeply integrate traceability, security, and dynamic visualization are still lacking. Common problems include high overhead of data on-chaining, weak privacy protection, delayed threat perception, and the absence of intuitive presentation [2, 3]. The algorithm, named MT-DHC, combines the Merkle Tree (MT) and an augmented Dual Hash Chain (DHC) for lightweight data on-chaining, achieving efficient and continuous tracing of data versions while reducing storage and computation costs on the chain through batch aggregation verification [4]. The ForceAtlas2 Force-Directed Layout (ForceAtlas2) automatically mines and presents complex community structures and correlations in data circulation and improves the readability of global topology [5]. Therefore, this paper combines these two algorithms to propose a security threat perception and visualization warning model based on data visualization and blockchain traceability algorithms. The innovation lies in the deep integration of blockchain cryptographic traceability mechanisms with visualization-based intelligent analysis technology. It enables full-chain dynamic auditing and real-time risk visualization of the data lifecycle. The goal is to provide enterprises with an integrated governance solution that is trusted, manageable, traceable, and visible, and support the secure release of data value.
The main difference between the ForceArtas2 MDHC model proposed by the research institute and existing blockchain based data traceability systems is that: (1) ForceArtas2 MDHC uses the MDHC Attribute Based Encryption with Zero Knowledge Proof (MDHC AZP) algorithm to achieve lightweight on chain auditing and privacy protection, and combines ForceArtas2 and Hierarchical Edge Binding (HEB) to achieve topology awareness and edge aggregation, thereby synchronously achieving real-time threat detection, full chain traceability, and visual warning in enterprise level data assetization transformation scenarios. (2) Previous studies have mostly focused on tracing or visualizing a single link, while ForceTars2 MDHC achieves real-time threat detection, traceability tracking, and synchronized execution of visual warnings, improving the response and cognitive efficiency of security events in data flow. (3) This model is specifically designed for high concurrency, low latency, and high trustworthiness requirements in the data assetization transformation of large enterprises. It supports multi-level data relationship presentation and global topology analysis, surpassing the visualization scope of general supply chain or food safety traceability.
The remainder of the paper is structured as follows. Section 2 reviews the current research status in the field of blockchain traceability and data asset visualization. In Section 3, a blockchain traceability algorithm based on MT and DHC is designed, as well as a security threat perception visualization warning model based on ForceTars2 and HEB. Section 4 validates the performance advantages of the proposed MDHC-AZP algorithm and ForceTaras2-MDHC model in terms of traceability accuracy, threat detection, and visualization cognitive efficiency through experiments. Section 5 summarizes the research findings and points out future research directions.
2 Related Work
With the development and application of new-generation information technologies, data asset management technologies became more mature, and scholars at home and abroad carried out in-depth work in this area. Ning and Feng proposed a data asset governance framework for the problems of data fragmentation and low efficiency in humanities laboratories of universities. They used theoretical discussion and case evaluation, and promoted data sharing and cross-disciplinary innovation through metadata standardization and technology integration, which supported education reform [6]. Alkhard put forward a metadata integration framework for the problems of scattered facility data and low management efficiency. They developed a standardized metadata management system by utilizing facility data in asset management practices, which improved decision efficiency and operational level of asset management [7]. Jimmy proposed a blockchain-based distributed ledger security model to address the threats to financial data security. He carried out theoretical analysis and case application through encryption principles and distributed ledger technology, which ensured data immutability and secure identity verification, and enhanced the data protection ability of financial institutions [8]. Abayomi et al. proposed a cloud machine learning automated data transformation framework to address the issue of low efficiency in extracting insights from complex enterprise data. They integrated cloud computing and real-time processing technologies through a literature review and multi-industry case analysis, which improved data quality and decision efficiency, and helped enterprises strengthen their data-driven capabilities [9]. Eboigbe et al. proposed a BCBS 239 and DAMA integrated governance model for the difficulties in data governance of financial institutions. They used multi-industry case analysis and incorporated nine years of practice into the framework design. The model enhanced data governance, quality, and metadata management in a customized way, and improved regulatory compliance and data value [10].
Up to now, theories of blockchain traceability and visualization have become relatively mature. Many scholars worldwide have carried out in-depth research and applied it in practice. Panda and Satapathy put forward a blockchain and Internet of Things layered framework based on EOSIO for food safety traceability in smart cities. They compared performance indicators such as block production rate, throughput, and confirmation time between Ethereum and EOSIO platforms. Results showed that EOSIO had significant advantages in block generation speed and confirmation time, which improved the efficiency of traceability and transparency [11]. Liu et al. proposed an effective visualization framework based on Convolutional Neural Networks and temporal pooling to address the low efficiency of tactical behavior analysis in sports videos. They used machine learning methods to extract spatiotemporal features of videos for classification. Experimental results demonstrated an accuracy of 98.7% and a recall of 94.5%, significantly enhancing the accuracy and efficiency of tactical analysis [12]. Wu et al. proposed a parallel search model of maximum matching based on a bipartite graph to address the issue of low time efficiency in blockchain traceability. They modeled records and blocks as a bipartite graph and used the maximum matching algorithm to allocate search tasks. Experiments showed that the time cost decreased by 85.1% and the storage cost was controllable [13]. Ani et al. proposed a blockchain security enhancement model to address the issues of insufficient security and transparency in online business data. They designed and implemented a blockchain-based solution to mitigate identified security risks, and attack simulation tests verified that the model could significantly enhance data security and transparency [14]. Chowdhury put forward a blockchain-enabled transparent traceability model to address insufficient transparency in supply chains. By analyzing cases such as Walmart and TradeLens, they confirmed that blockchain technology can improve supply chain traceability, supporting efficient and reliable management [15].
In summary, existing research has made some progress in blockchain traceability security frameworks and visualization in the transformation of data assetization. However, most studies still faced challenges, including the difficulty of balancing efficiency and privacy, as well as the disconnection between visualization and underlying traceability data. The immutability of blockchain traceability and the situational presentation ability of visualization theory could compensate for these deficiencies. Therefore, this paper raises the ForceAtlas2-MDHC security threat perception and visualization warning model. The model is expected to achieve deep integration of trusted data traceability and real-time threat visualization, to meet enterprise-level needs of high concurrency, low latency, and high trustworthiness in data security governance.
3 Construction of a Visualization Warning Model Based on a Blockchain Traceability Algorithm
To achieve trustworthy traceability and threat visualization of data assets during the circulation process, this study will first design a blockchain traceability algorithm that integrates lightweight on chain and privacy protection. Based on this, force guided layout and edge bundling technology will be introduced to construct a visual warning model, ultimately forming an end-to-end security threat perception and decision support framework.
3.1 Design of Blockchain Traceability Algorithm Based on MT-DHC
Large enterprise groups undergoing data assetization transformation need to establish a trusted traceability system to ensure the secure circulation and effective utilization of data value. Traditional centralized traceability systems have defects such as single-point failure and vulnerability to tampering [16]. Therefore, this paper uses the MT-DHC lightweight data on-chaining algorithm. It employs a DHC and MT structure to reduce blockchain storage costs and verification complexity, thereby improving overall system performance. The operation process of MT-DHC is shown in Figure 1.
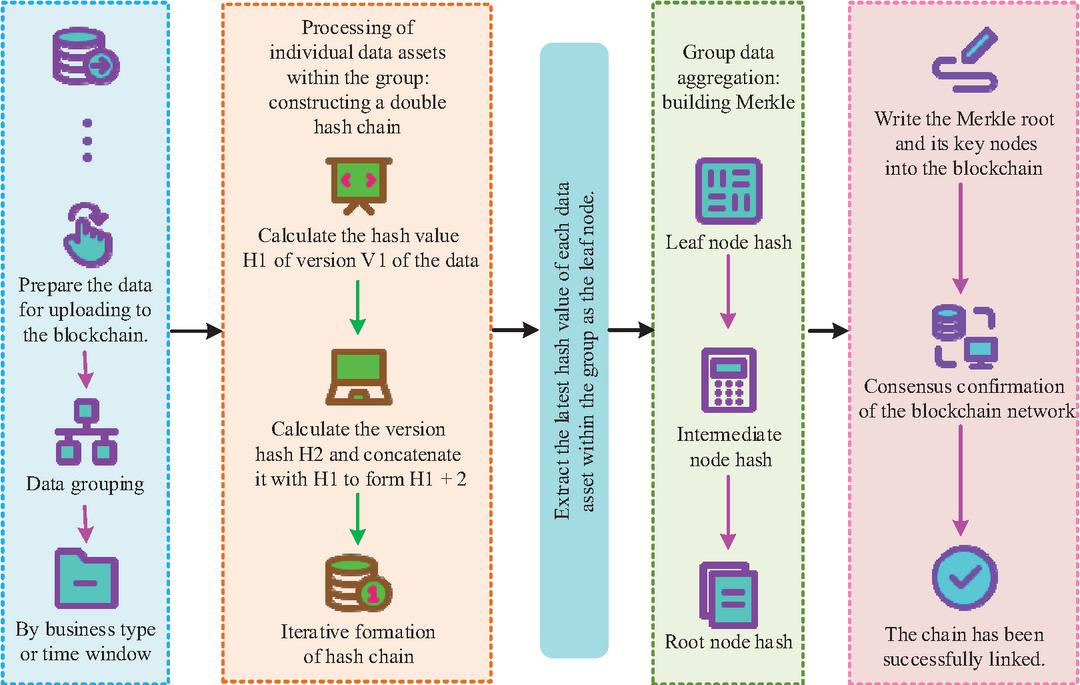
Figure 1 Process of MT-DHC algorithm (https://iconpark.oceanengine.com/home).
As shown in Figure 1, MT-DHC first groups raw data by business or time dimension. Within each group, it builds a DHC for every data asset by calculating the hash of the new version and concatenating it with the hash of the previous version, then hashing again to form an immutable version traceability chain. Then, it extracts the latest version hash of all data in the group as leaf nodes. These are recursively hashed pair by pair from bottom to top to generate an MT. Finally, it obtains the Merkle root, which represents the complete state of the entire batch of data assets. The root hash and key metadata are written into blockchain transactions and, after consensus confirmation, the transaction hash serves as proof of record. In this way, only a small amount of data is put on-chain to support large-scale efficient batch verification and accurate traceability. The equation of hash value generation is shown in Equation (1) [17].
| (1) |
where is the input, and it can be of any length. After the operation by the hash function , the final hash value is obtained. has a fixed length determined by the type of hash function. The hash chain is filled into a matrix according to a mapping relation to generate a hash chain matrix, as shown in Equation (2).
| (2) |
where is the initial value. This paper employs balance testing to verify whether the balance of the random sequence of hash values is reasonable, as illustrated in Equation (3).
| (3) |
where and are the number of “0” and “1” in the statistical sequence. If the calculated value is less than 3.841, the sequence meets the balance standard. MT-DHC achieves efficient traceability and integrity verification, but it lacks a fine-grained privacy control mechanism. The Hybrid Attribute-Based Encryption and Zero-Knowledge Proof (ABE-ZKP) algorithm provides multi-level privacy protection. It hides both access policies and verification content to achieve identity anonymity and unlinked behaviors, and it complements the weakness of MT-DHC. The operation process of ABE-ZKP is shown in Figure 2.
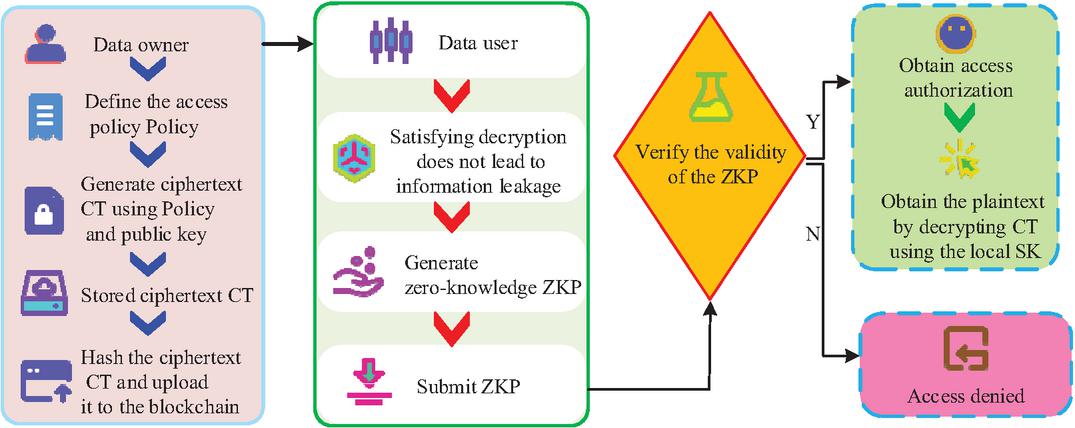
Figure 2 Process of ABE-ZKP algorithm (https://iconpark.oceanengine.com/home).
As shown in Figure 2, ABE-ZKP encrypts data based on access policies by data owners to generate ciphertext, and the ciphertext is stored off-chain. When a data user requests access, the private key and policy are submitted to the on-chain verification contract. The contract only checks the validity of the proof while hiding user attributes and behavior traces. After verification, the smart contract authorizes access. The user then decrypts the off-chain ciphertext and obtains the data. In this way, the algorithm achieves multi-level privacy protection covering data content, identity, and access behavior. The equation of ciphertext generation by attribute-based encryption is shown in Equation (4) [18].
| (4) |
where is the final ciphertext, is a bilinear mapping function used to construct the relation between attributes and keys, represents the attribute associated with plaintext . After the ciphertext is generated, the attribute key is needed for decryption, as shown in Equation (5).
| (5) |
where is the user’s private key, is the attribute set held by the user, is a single attribute of the user. After decryption, the data integrity must be verified. Zero-knowledge proof is introduced to ensure privacy protection, as shown in Equation (6).
| (6) |
where is the zero-knowledge proof credential, is the commitment function, is the privacy data to be verified. Therefore, this paper combines MT-DHC and ABE-ZKP to form a hybrid algorithm named MDHC-AZP. It addresses both efficiency and privacy issues in blockchain traceability during the data assetization transformation of large enterprise groups. The operation process of MDHC-AZP is shown in Figure 3.
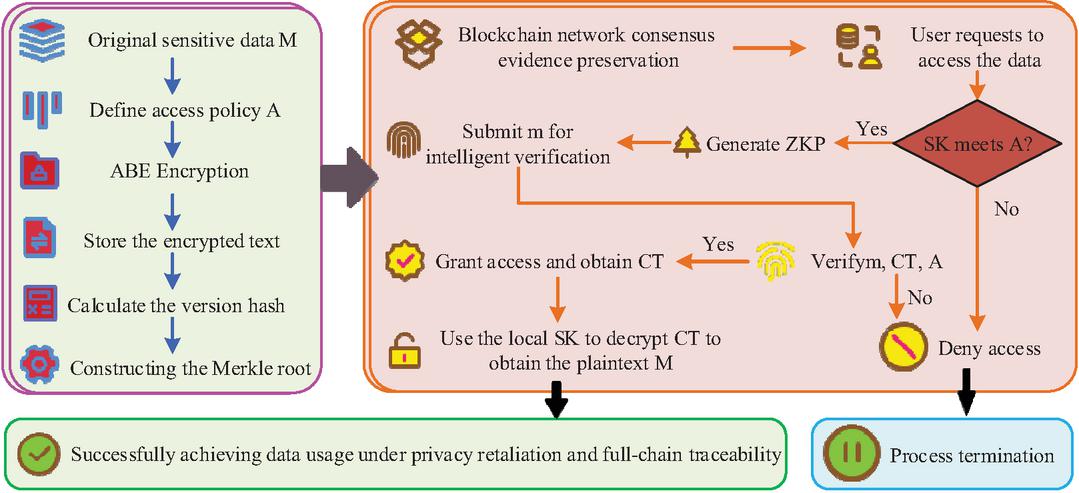
Figure 3 Process of MDHC-AZP blockchain traceability algorithm (https://iconpark.oceanengine.com/home).
As shown in Figure 3, the first stage of MDHC-AZP uses attribute-based encryption to convert raw data into ciphertext and store it in the off-chain system. At the same time, it builds a DHC for the encrypted data, records the version history, and puts the Merkle root of the batch on-chain as audit evidence. This forms a lightweight audit anchor. In the second stage, when accessing data, the user first generates a zero-knowledge proof and submits it to the chain. After the smart contract verifies the proof, it authorizes access to the ciphertext. The user uses a local attribute private key to decrypt the ciphertext and obtain the data. Finally, the integrity of batch data is verified through Merkle proof on-chain, and precise version traceability is achieved with the DHC. In this way, MDHC-AZP provides a complete solution that integrates encrypted storage, anonymous access, behavior hiding, and trusted verification.
3.2 Security Threat Perception and Visualization Warning Model Based on ForceAtlas2-HEB
The study puts forward the MDHC-AZP to achieve data privacy protection and trusted tracing inblockchain provenance. However, it cannot meet the need for intuitive presentation of complex relationships in data visualization. Therefore, ForceAtlas2 is introduced to build a data visualization framework. It simulates physical forces to generate a clear visualization topology, which enables multi-dimensional perception and analysis of data circulation. The flowchart of ForceAtlas2 used for building the visualization framework is shown in Figure 4.
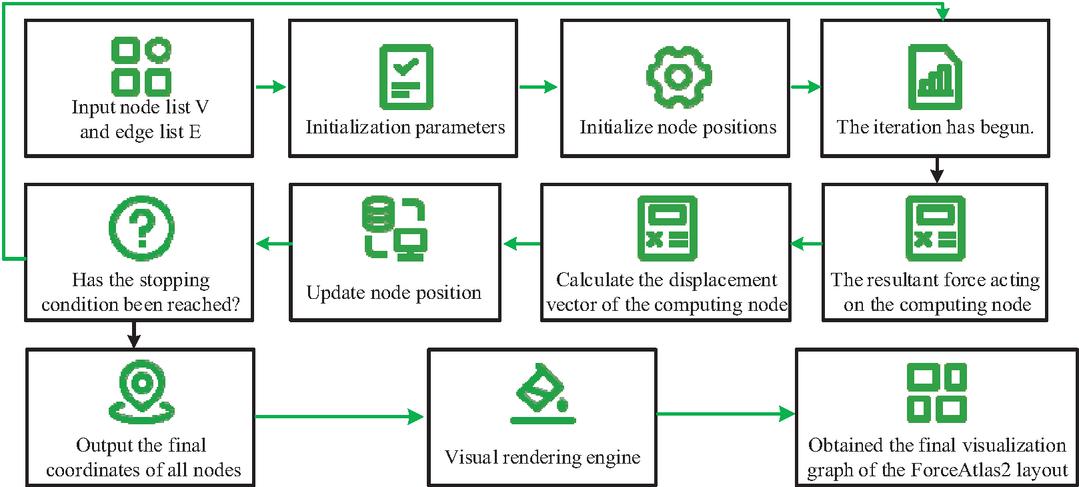
Figure 4 Flowchart of ForceAtlas2 for building the data visualization framework (https://iconpark.oceanengine.com/home).
As shown in Figure 4, ForceAtlas2 undertakes the core layout function in the visualization study of data assetization transformation of large-scale enterprises. It simulates a physical system to transform abstract blockchain provenance data into an intuitive network topology. In the initialization stage, repulsion, attraction, and gravity parameters are configured to match the hierarchical characteristics of enterprise data. During the iteration, repulsion between nodes prevents overlap, attraction between connected nodes forms community clusters, and global gravity maintains layout stability. The generated spatial topology effectively reveals circulation paths, dense communities, and hub nodes among data assets. The repulsive force between nodes is shown in Equation (7) [19].
| (7) |
where represents the repulsive force from node to node is the repulsion coefficient, and represent the mass of nodes and . Repulsion separates nodes, so attraction is needed to maintain connections. The attraction equation is derived and shown in Equation (8).
| (8) |
where is the attraction of node to its adjacent node to maintain the connection, max Degree denotes the maximum degree of nodes in the graph. After obtaining the total force, the node position needs to be updated. The displacement iteration equation is shown in Equation (9).
| (9) |
where represents the visualization position of node in the -th iteration, denotes the time step that controls the displacement in each iteration, represents the total force applied to the node . However, when ForceAtlas2 handles large-scale dense networks, the main connections and flow patterns become difficult to distinguish. HEB aggregates edges that are spatially close and directionally similar, which significantly reduces visual clutter. Therefore, the flowchart of ForceAtlas2-HEB for data visualization is shown in Figure 5.
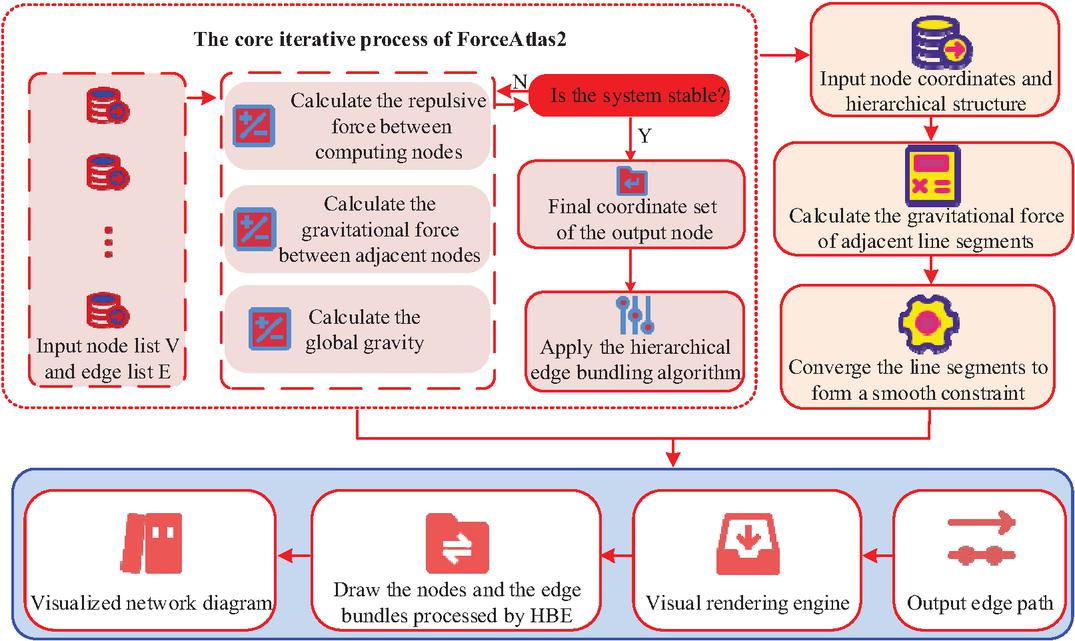
Figure 5 Flowchart of ForceAtlas2-HEB algorithm (https://iconpark.oceanengine.com/ home).
As shown in Figure 5, ForceAtlas2-HEB adopts a two-stage processing architecture. ForceAtlas2 first simulates the physical system to compute node positions and outputs a topology skeleton that reflects data asset relationships and community structures. Then, HEB reduces visual clutter by bundling redundant edges. The final network topology balances structural accuracy and visual clarity, and provides decision support for data lineage tracing, asset cluster distribution, and anomaly association analysis. The total force equation of node layout in ForceAtlas2-HEB is shown in Equation (10) [20].
| (10) |
where represents the total force applied on node , which corresponds to the driving force of enterprise data asset layout, denotes the repulsion between nodes and , is the set of associated edges of enterprise data assets. After the node layout stabilizes, redundant edges need to be aggregated, as shown in Equation (11).
| (11) |
where represents the total energy of edge bundling, which evaluates the aggregation effect of associated edges of enterprise data assets, denotes the balance coefficient, represents the total length of bundled edges. Based on energy evaluation, data chain attribution needs to be divided precisely, as shown in Equation (12).
| (12) |
where represents the probability that subsidiary report data flow belongs to the bundled financial data chain, denotes the temperature parameter, which is dynamically adjusted according to enterprise hierarchy. To achieve the deep integration of data provenance and situational visualization in the data assetization transformation of large-scale enterprises, the study proposes a security threat perception and visualization warning model based on ForceAtlas2-HEB and MDHC-AZP. This model is named ForceAtlas2-MDHC. It realizes real-time monitoring, tracing, and warning of data asset security threats. The flow of ForceAtlas2-MDHC is shown in Figure 6.
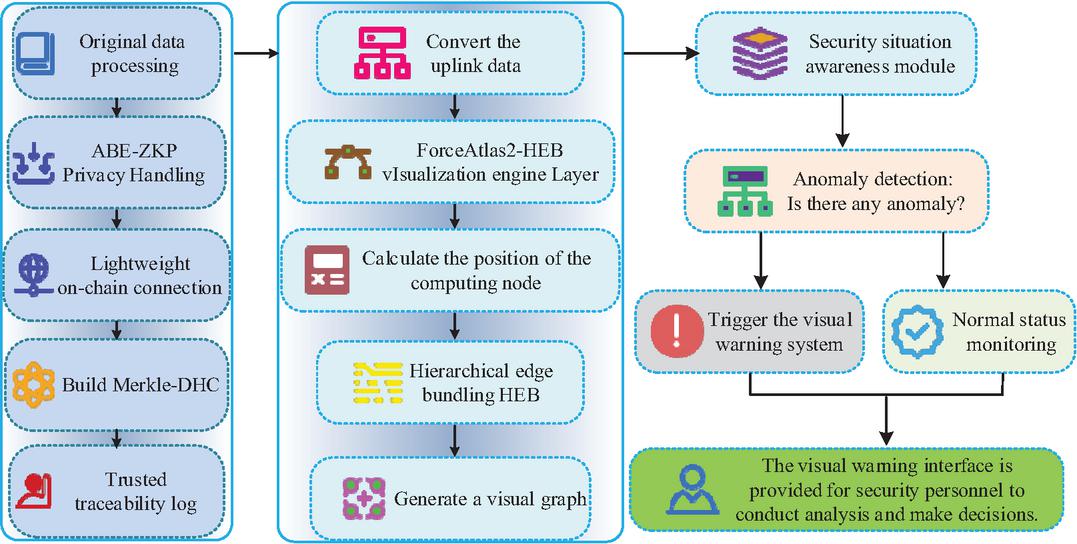
Figure 6 Flow of security threat perception and visualization warning model (https://iconpark.oceanengine.com/home).
As shown in Figure 6, the ForceAtlas2-MDHC model applies MDHC-AZP at the bottom layer to realize encrypted on-chaining and privacy protection of data assets. The ABE-ZKP module ensures the confidentiality of both data content and access behavior. The MT-DHC module achieves lightweight evidence storage and full-link auditing through a DHC and MT. The middle layer converts blockchain provenance data into graph structures through data interfaces and processes them with ForceAtlas2-HEB. The top security perception module monitors dynamic changes in the graph and on-chain events in real time. The final framework integrates trusted tracing, privacy protection, situational presentation, and risk warning, supporting enterprise-level data security and informed decision-making during data assetization transformation. The overall computational complexity of the proposed ForceAtlas2 MDHC model is , where N represents the number of nodes and M represents the number of edges. The main cost comes from the ForceAtlas2 layout iteration and the HEB edge bundling.
4 Performance Analysis of ForceAtlas2-MDHC Model
To further validate the performance of the proposed model, this section will conduct experimental analysis on the effectiveness of the MDHC-AZP blockchain traceability algorithm and the security threat perception and visualization warning model formed by its integration with ForceTaras2-HEB. The superiority of the algorithm will be verified through multidimensional indicator comparison.
4.1 Validation of Effectiveness of MDHC-AZP Blockchain Traceability Algorithm
To verify the superiority of the MDHC-AZP blockchain tracing algorithm, the study compared it with the Merkle Tree-based Lightweight Tracing Algorithm (MT-LTA), the Attribute-based Encryption Privacy Protection Algorithm (ABE-PPA), and the Hybrid Blockchain Tracing Model (HBTM). These algorithms represent the mainstream solutions for traceability, privacy protection, and hybrid storage. The experimental system used Ubuntu 20.04 LTS with Linux Kernel 5.13. The deep learning framework was PyTorch 1.12.1, the optimizer was AdamW, the programming language was Python 3.9, the GPU was NVIDIA RTX 3090, and the memory was 128 GB. To ensure effectiveness and reliability, the experiment utilized a self-built SCTD supply chain tracking dataset (containing 126,000 records, 18,000 nodes, and 223,000 transactions) and an FTD food tracking dataset (containing 84,000 records, 9200 nodes, and 157,000 transactions). Both datasets were generated by simulating the behaviors such as asset registration, version update, and access authorization in the enterprise data assetization scenarios. The accuracy and loss rate of tracing data of MDHC-AZP and the compared algorithms are shown in Figure 7.
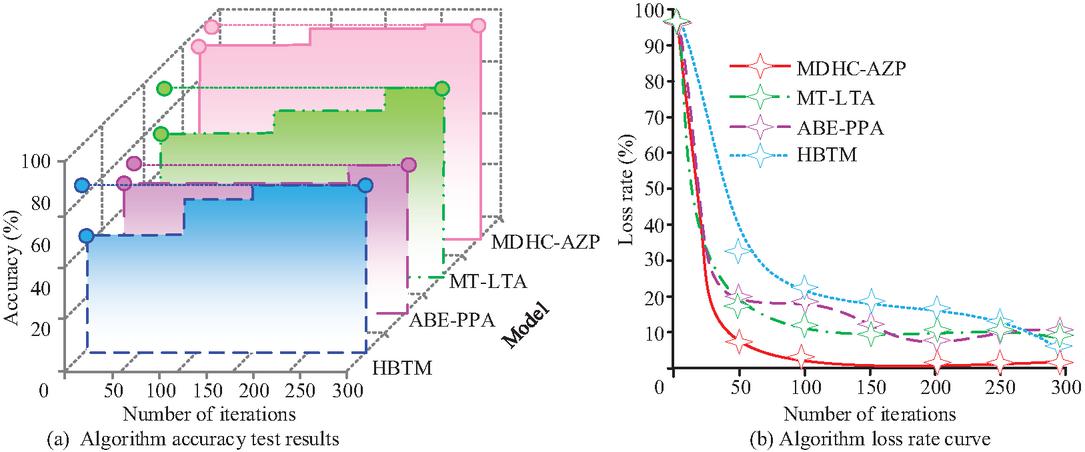
Figure 7 Comparison of accuracy and loss rate of algorithms.
As shown in Figure 7(a), the accuracy of MDHC-AZP reached 98.71% after 300 iterations, which was significantly higher than 92.12% of MT-LTA, 76.65% of ABE-PPA, and 83.78% of HBTM. This advantage stemmed from the DHC structure, which ensured data integrity, and the MT, which enabled efficient verification. As shown in Figure 7(b), the loss rate of MDHC-AZP was only 0.82%, which was significantly lower than the compared algorithms, and it converged the fastest. This verified that its lightweight design effectively reduced information loss during data processing. The results showed that MDHC-AZP significantly reduced system loss while maintaining high accuracy, providing reliable technical support for enterprise data assetization transformation. To further verify the superiority of MDHC-AZP, the study compared the precision-recall curves of the proposed and compared algorithms on different datasets, as shown in Figure 8.
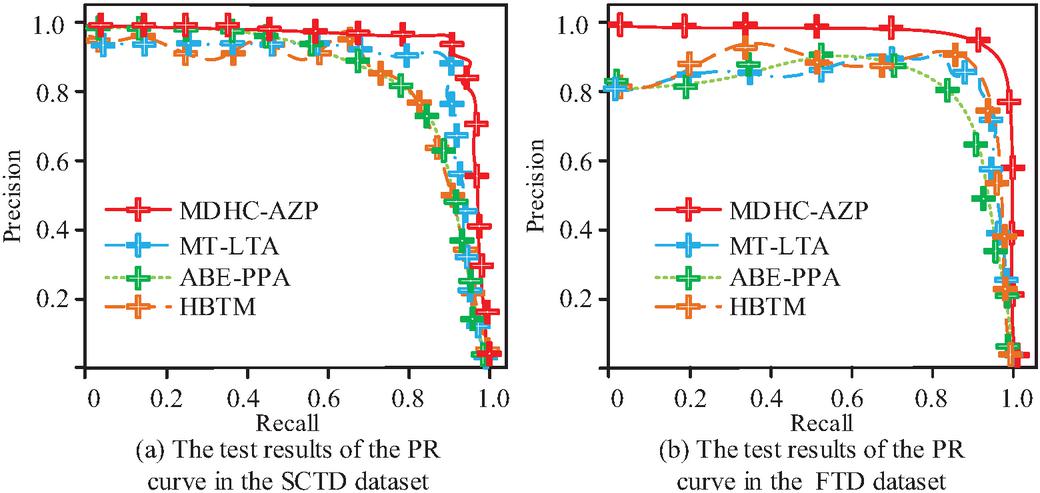
Figure 8 Precision-recall results on different datasets.
As shown in Figure 8(a), in the SCTD dataset, the area under the PR curve of MDHC-AZP was the largest. It achieved 0.96 precision at 0.80 recall, indicating that the proposed algorithm provided the best trade-off between precision and recall. The PR curves of ABE-PPA and HBTM were relatively lower, and their areas were smaller, which indicates that their tracing precision was lower under the same recall. As shown in Figure 8(b), in the FTD dataset, MDHC-AZP also maintained the advantage with the largest area under the curve, which was significantly better than the compared algorithms. These results demonstrated that MDHC-AZP achieved a better balance between precision and recall compared to the other three algorithms. Across the two datasets, MDHC-AZP significantly improved the reliability of tracing data with DHC integrity checking and MT verification. To further verify its superiority, the study compared the hash collision rate and node consensus efficiency of the proposed and compared algorithms, as shown in Figure 9.
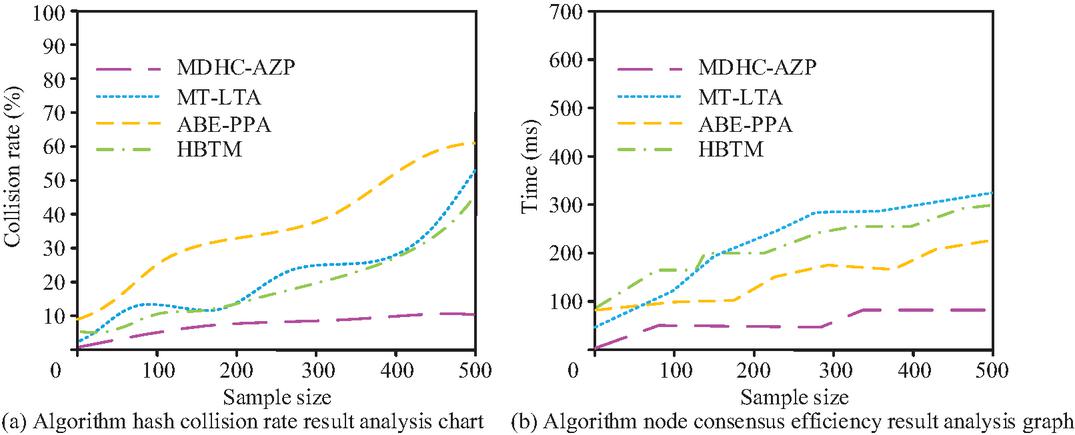
Figure 9 Hash collision rate and node consensus efficiency results.
In Figure 9(a), in the hash collision rate test of tracing data, MDHC-AZP performed significantly better than the compared algorithms. When the sample size reached 500 , the collision rate was only 10.21%, which was much lower than the others. As shown in Figure 9(b), in terms of node consensus efficiency, MDHC-AZP achieved consensus in 88.45 ms at a scale of 500 nodes, whereas HBTM required 303.65 ms. These results showed that the advantage of MDHC-AZP stemmed from its lightweight on-chaining design, which significantly reduced network communication costs while ensuring high security and efficiency. It met the dual requirements of reliability and performance in enterprise-level data assetization. In summary, MDHC-AZP demonstrated excellent blockchain tracing performance in terms of accuracy, loss rate, recall, and hash collision rate tests.
4.2 Application Effect of Security Threat Perception and Visualization Warning Model
After verifying the performance of MDHC-AZP, the study further tested the practical application value of the ForceAtlas2-MDHC security threat perception and visualization warning model. The experiments used the PyTorch 2.0.1 deep learning framework for training. The development environment was JetBrains PyCharm 2023.1, and the simulation environment CPU was Intel Xeon Platinum 8380. The ESCTD enterprise supply chain threat perception dataset and the FDATO financial data anomaly operation dataset were utilized for training and testing purposes. The ESCTD dataset contained simulated supply chain data tampering, illegal node access, and compliance violation, containing 215,000 threat logs, 32,000 nodes, and 458,000 transactions. The FDATO dataset included abnormal access and unauthorized operations on sensitive data in financial institutions, including 96,000 abnormal operation records, 11,000 nodes, and 182,000 transactions. The study compared the proposed model with the Dynamic Graph Convolutional Threat Detection Model (DGCTDM), the Bi-LSTM based Anomaly Behavior Analysis Model (BL-ABAM), and the Spatial-Temporal Feature Fusion Visualization Model (STF-VM). These models cover three single dimensions: threat detection, anomaly analysis, and visualization. The proposed ForceArtas2 MDHC integrates all three into one, which facilitates the verification of the comprehensive superiority of the integrated framework. The comparison results of threat detection rate, false alarm rate, and tracking time for the four models are shown in Table 1.
Table 1 Comparison of threat detection rate, false alarm rate, and tracing time
| Threat | False | Threat | Visual | ||
| Detection | Positive | Tracing | Cognitive | ||
| Dataset | Algorithm | Rate (%) | Rate (%) | Time (ms) | Efficiency (%) |
| ESCTD | ForceAtlas2 -MDHC | 98.11 | 0.82 | 120 | 96.83 |
| DGCTDM | 90.52 | 3.21 | 268 | 89.54 | |
| BL-ABAM | 92.10 | 4.86 | 320 | 81.42 | |
| STF-VM | 81.62 | 6.21 | 365 | 75.63 | |
| FDATO | ForceAtlas2 -MDHC | 98.62 | 1.31 | 96 | 95.27 |
| DGCTDM | 85.33 | 3.61 | 251 | 90.17 | |
| BL-ABAM | 81.76 | 5.54 | 365 | 85.42 | |
| STF-VM | 73.42 | 7.28 | 268 | 75.69 |
As shown in Table 1, the proposed model achieved a 98.11% threat detection rate, a 0.82% false alarm rate, a tracing time of 120 ms, and a 96.83% visualization cognition efficiency in the ESCTD dataset. The compared models had significant gaps in all metrics. For example, STF-VM achieved only 81.62% detection rate, a false alarm rate as high as 6.21%, and a tracing time of 268 ms in the ESCTD dataset. These results demonstrated that ForceAtlas2-MDHC provided reliable security governance support for data assetization transformation by integrating blockchain tracing and visualization technology. To further validate its application value, the study compared the utilization rate of trusted data assets and the accuracy of data asset value assessment of the proposed and compared models, as shown in Figure 10.
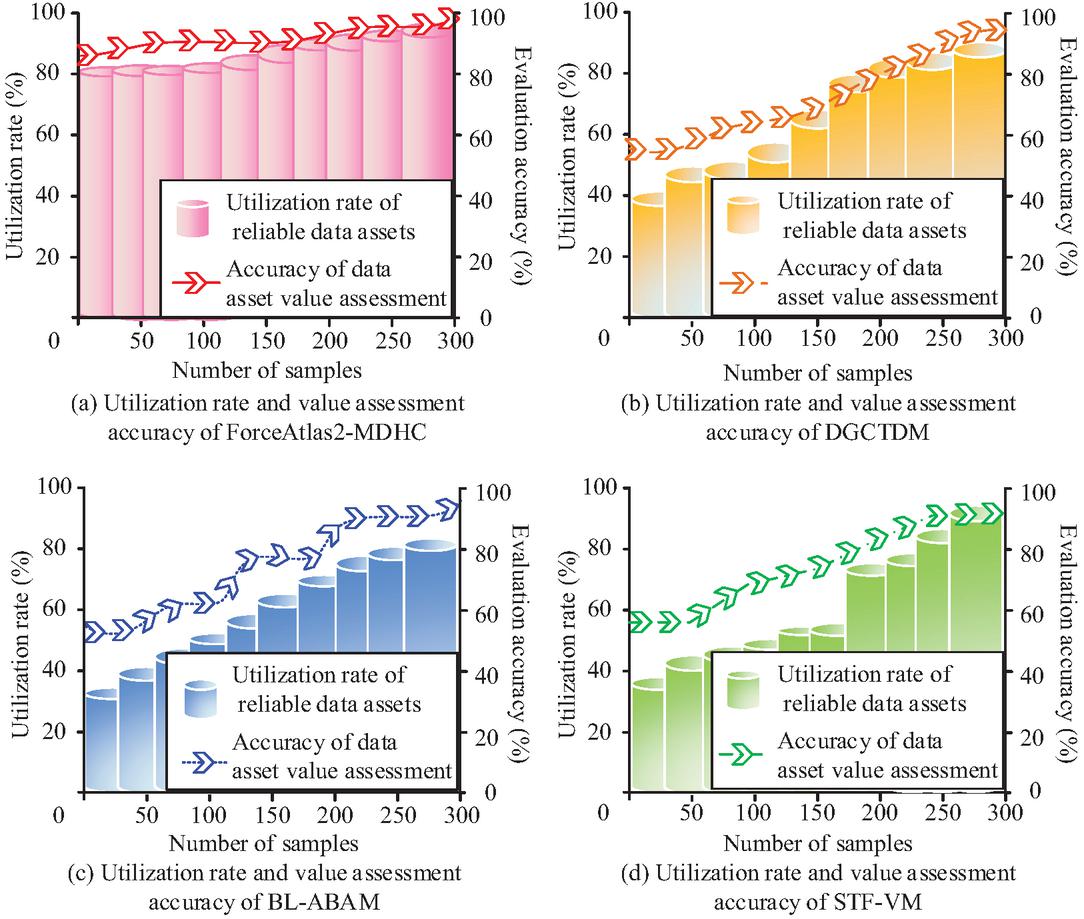
Figure 10 Comparison of utilization rate and value assessment accuracy of data assets.
As shown in Figure 10(a), the utilization rate of trusted data assets for ForceAtlas2-MDHC reached 96.82%, and its value assessment accuracy reached 98.67%, which were significantly higher than those of the other models. This advantage came from its combination of blockchain tracing and intelligent visualization analysis. As shown in Figure 10(c), BL-ABAM achieved only 81.02% utilization and 93.71% accuracy, as its sequential processing mode could not support the analysis of complex asset relationships. As shown in Figures 10(b) and 10(d), DGCTDM and STF-VM had lower utilization than ForceAtlas2-MDHC. These results showed that ForceAtlas2-MDHC achieved coordinated optimization of high utilization and high accuracy in data assetization transformation through an integrated framework. To further evaluate its application value, the study compared the visualization classification accuracy and computation latency of the proposed and compared models, as shown in Figure 11.
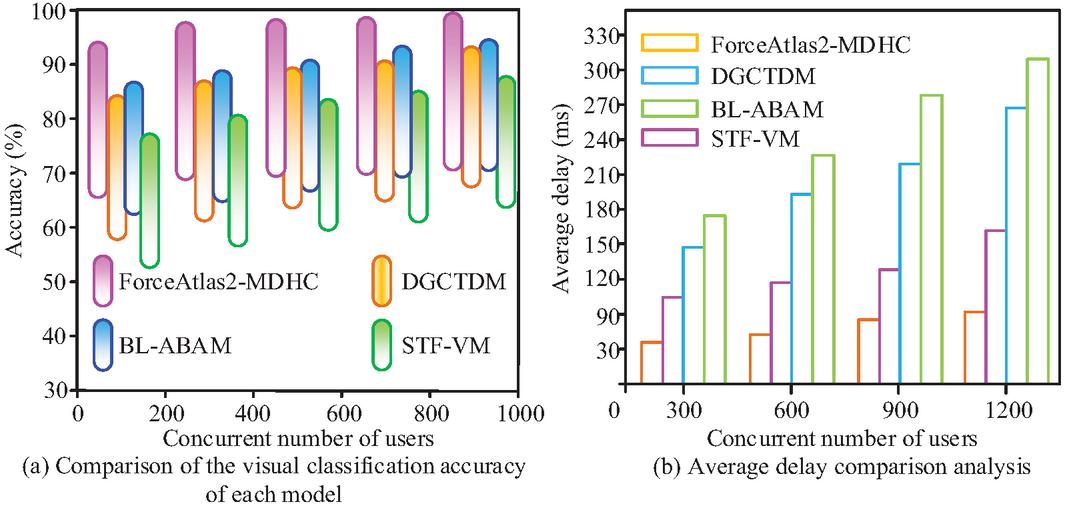
Figure 11 Comparison of visualization classification accuracy and computation latency.
As shown in Figure 11(a), the visualization classification accuracy of ForceAtlas2-MDHC was significantly higher than that of the compared models. At 1000 concurrent users, it reached 99.64%, which was much higher than the compared models. The next best model, BL-ABAM, achieved 94.12%. As shown in Figure 11(b), the average latency of the proposed model was within 100 ms, which was more than 60.56% lower than the compared models. This advantage stemmed from the efficient data retrieval mechanism of MDHC-AZP and the optimized visualization pipeline of ForceAtlas2-HEB, which collaborated to significantly enhance the real-time response capability. In summary, the ForceAtlas2-MDHC model met the requirements of large-scale enterprises for high concurrency and low latency in data assetization transformation, and provided key technical support for building efficient and trusted data security governance systems.
5 Conclusions and Recommendations
In response to the problems of low efficiency of data tracing, lagged threat perception, and poor readability of visualization in the blockchain traceability security framework and visualization of traditional large enterprise group data assetization transformation, this paper puts forward an innovative ForceAtlas2-MDHC security threat perception and visualization early warning model. The model integrated the lightweight on-chaining mechanism of the DHC and the MT with the ForceAtlas2 technology to realize security control and visualization decision support throughout the entire life cycle of data assets. The experimental results showed that in the ESCTD dataset, the threat detection rate reached 98.11%, the false alarm rate was only 0.82%, the threat tracing time was 120 ms, the visualization cognitive efficiency reached 96.83%, the trusted data asset utilization rate reached 96.82%, and the value assessment accuracy reached 98.67%. All delays were controlled within 100 ms, which was significantly better than the comparison algorithms. Overall, the ForceAtlas2-MDHC model had good real-time threat perception, multidimensional data integration, and efficient visualization performance. Its performance met the requirements of enterprise-level data governance with high concurrency, low latency, and high reliability. For large-scale enterprise datasets, the model supports enterprise data graphs with millions of nodes and billions of edges through MDHC lightweight on chain storage, HEB edge bundling, and batch asynchronous layout. The system can be directly deployed in real-time environments. The on chain verification of MDHC-AZP only requires two hash comparisons and one zero knowledge proof verification. The consensus delay is controlled in milliseconds (88.45 ms for 500 nodes), and the threat monitoring module asynchronously processes graph updates in an event driven manner without blocking the main process. It has passed 1000 concurrent stress tests. Although the model performed well in detection accuracy and response efficiency, the study still had some limitations. The cross-chain interaction performance was not validated in an actual large-scale distributed environment, and the adaptability of the visualization module to heterogeneous data still needs to be improved. In the future, it is necessary to explore the integration of federated learning and cross-chain technology, optimize heterogeneous data dynamic rendering algorithms, and continue to improve the generalization and prediction effectiveness of the model.
Conflicts of Interest
The author declares that there is no conflict of interest.
References
[1] Xu T, Shi H, Shi Y, You J. From data to data asset: conceptual evolution and strategic imperatives in the digital economy era. Asia Pacific Journal of Innovation and Entrepreneurship, 2024, 18(1): 2–20.
[2] Maletič D, Marques de Almeida N, Gomišček B, Maletiča M. Understanding motives for and barriers to implementing asset management system: an empirical study for engineered physical assets. Production Planning & Control, 2023, 34(15): 1497–1512.
[3] Yang C, Yan Y. Research on intelligent driven network security situation awareness prediction model and its support application. Journal of Cyber Security and Mobility, 2026, 15(2): 365–390.
[4] Birch K, Ward C. Assetization and the new asset geographies. Dialogues in Human Geography, 2024, 14(1): 9–29.
[5] Jian L, Xiaofan D, Jinlin Z, Yunqing T. The impact of data assets on enterprise innovation investment. Foreign Economics & Management, 2023, 45(12): 18–33.
[6] Ning Y, Feng Q I N. Theoretical interpretation and practical approaches to data asset governance in humanities laboratories. Experimental Technology and Management, 2025, 42(4): 259–266.
[7] Alkhard A. Enhancing asset management through integrated facilities data, digital asset management, and metadata strategies. Construction Economics and Building, 2024, 24(3): 76–94.
[8] Jimmy F. Enhancing data security in financial institutions with blockchain technology. Journal of Artificial Intelligence General Science, 2024, 5(1): 424–437.
[9] Abayomi A A, Uzoka A C, Ubanadu B C. A conceptual framework for enhancing business data insights with automated data transformation in cloud systems. International Journal of Advanced Multidisciplinary Research and Studies, 2024, 4(6): 2076–2084.
[10] Eboigbe E O, Farayola O A, Olatoye F O. Business intelligence transformation through AI and data analytics. Engineering Science & Technology Journal, 2023, 4(5): 285–307.
[11] Panda S K, Satapathy S C. Drug traceability and transparency in medical supply chain using blockchain for easing the process and creating trust between stakeholders and consumers. Personal and Ubiquitous Computing, 2024, 28(1): 75–91.
[12] Liu A, Mahapatra R P, Mayuri A V R. Hybrid design for sports data visualization using AI and big data analytics. Complex & Intelligent Systems, 2023, 9(3): 2969–2980.
[13] Wu H, Jiang S, Cao J. High-efficiency blockchain-based supply chain traceability. IEEE Transactions on Intelligent Transportation Systems, 2023, 24(4): 3748–3758.
[14] Ani N, Millah S, Sunarya P A. Optimizing online business security with blockchain technology. Startupreneur Business Digital, 2024, 3(1): 67–80.
[15] Chowdhury R H. Automating supply chain management with blockchain technology. World Journal of Advanced Research and Reviews, 2024, 22(3): 1568–1574.
[16] Hu J, Wu W, Chuan T, Peng Q. Enterprise internal threat authentication traceability technology based on key authentication system. Journal of Cyber Security and Mobility, 2025, 14(3): 623–652.
[17] Bokolo A J. Data driven approaches for smart city planning and design: a case scenario on urban data management. Digital Policy, Regulation and Governance, 2023, 25(4): 351–367.
[18] Yang L, Ni Y, Ng C T. Blockchain-enabled traceability and producer’s incentive to outsource delivery. International Journal of Production Research, 2023, 61(11): 3811–3828.
[19] Merino J, Xie X, Moretti N. Data integration for digital twins in the built environment based on federated data models. Proceedings of the Institution of Civil Engineers-Smart Infrastructure and Construction, 2023, 176(4): 194–211.
[20] Karkošková S. Data governance model to enhance data quality in financial institutions. Information Systems Management, 2023, 40(1): 90–110.
Biography

Qingtong Meng, born April 1988, male, from Jinan City, Shandong Province, China, Han ethnicity, received a Bachelor’s degree in Communication Engineering from University of Jinan in 2012. He is currently a Senior Engineer and Senior Manager of System Integration at Shandong Healthcare Group Big Data Co. Ltd., His main research areas include blockchain data traceability, data assetization, and secure visualization analysis, with a focus on privacy computing and trusted data governance in large group enterprises. He has led multiple key R&D projects and holds two national invention patents, covering areas such as big data-driven cybersecurity early warning and IoT smart services. He won First Prize for National Innovation Achievement in Modern Management of Building Materials Enterprises and two Innovation Solution awards from the Ministry of Industry and Information Technology. The cybersecurity intelligent early warning platform he developed has been widely applied in dozens of companies, providing important practical validation for data security assetization.
Journal of Cyber Security and Mobility, Vol. 15_5, 1419–1440
doi: 10.13052/jcsm2245-1439.15511
© 2026 River Publishers