A Comparative Study of Deep Learning Models for Malware Detection in IoT Networks: CNN, LSTM, and Hybrid Architectures
Yuan Liu1,*, Manqing Cao2 and Chong Cao3
1College of Information Engineering, Shandong Huayu University of Technology, Dezhou, Shandong 253034, China
2QU-Drake United College, Qingdao University, Qingdao, Shandong 266000, China
3Shandong Hualu Hengsheng Chemical Co. Ltd., Power Equipment Department, Dezhou, Shandong 253024, China
E-mail: yuanliu022026@outlook.com; 18506480869@163.com; 133962760107@163.com
*Corresponding Author
Received 28 February 2026; Accepted 02 May 2026
Abstract
The rapid expansion of the Internet of Things (IoT) has intensified security concerns. Many IoT devices operate with limited computational resources and inadequate built-in protection. This makes them vulnerable to malware attacks such as Distributed Denial-of-Service (DDoS), botnets, and ransomware. Traditional signature-based detection techniques struggle to identify evolving and previously unseen threats, highlighting the need for intelligent detection mechanisms. This study proposes a Hybrid Convolutional Neural Network–Long Short-Term Memory (CNN–LSTM) model for effective IoT malware detection. The CNN component extracts spatial features from network traffic, including packet-level and flow-based characteristics. The LSTM component captures temporal dependencies and sequential attack patterns. By integrating spatial and temporal learning, the hybrid architecture enhances detection capability for both known and zero-day attacks. Experimental results demonstrate superior performance compared to standalone CNN and LSTM models, achieving 99.92% accuracy, precision, recall, and F1-score, with a ROC-AUC of 0.999703.
Keywords: IoT security, malware detection, hybrid CNN–LSTM, spatial feature extraction, temporal sequence learning.
1 Introduction
Internet of Things (IoT) technology now connects to multiple industries, which enable connections to healthcare facilities and smart home devices and manufacturing environments through its enhanced capabilities (Krzysztoń, Rojek, and Mikołajewski 2024). The growth of IoT devices has created security risks because their protection systems do not provide adequate security measures (Alomari et al. 2023). The IoT ecosystem connects billions of devices which generate massive data streams thus establishing itself as a primary target for cyberattacks that require advanced malware detection systems (El-Ghamry et al. 2023). Hackers use botnets and ransomware to attack IoT networks by exploiting security weaknesses in both devices and network systems (Almazroi and Ayub 2023).
Multiple elements lead to higher malware threats in IoT networks (Kim and Lee 2022). The restricted processing power of IoT devices prevents the use of standard security systems which makes them vulnerable to cyber-attacks (Gyamfi et al. 2023). The variety of IoT devices together with their different communication protocols and data transmission methods creates stronger challenges for detecting harmful behavior in IoT systems (AbdelBasset et al. 2023). The ongoing development of malware which frequently changes its form to avoid detection creates an additional security challenge that organizations must handle (Hamza et al. 2022). The combination of these factors makes it difficult for traditional security systems to protect IoT environments which shows the necessity for sophisticated detection methods that can handle these complex security problems (Anandhi, Vinod, and Menon 2024).
The present techniques for detecting IoT malware employ signature-based methods combined with anomaly detection and Machine Learning (ML) systems as their main detection approach (Banaamah and Ahmad 2022). The signature-based methods require established attack signatures for their operations but they cannot detect zero-day attacks and new malware variants (Baker del Aguila et al. 2024). The network traffic anomaly detection systems attempt to find malicious operations by monitoring deviations from standard traffic patterns but their detection system produces numerous false alarms (Shafin, Karmakar, and Mareels 2023). The Decision Trees and Random Forests and Support Vector Machines (SVMs) ML models have demonstrated their capability to classify network traffic patterns (Chaganti et al. 2023). The methods experience difficulties when dealing with IoT traffic that changes continuously because their systems cannot mirror both the spatial and temporal patterns needed for precise malware detection (Hussain et al. 2024). The models face restrictions that stem from their inability to handle large IoT systems which operate in real-time because they need high processing power throughout their whole operation. (Deevi 2020) combines adaptive gradient Support Vector Regression (SVR), LSTM, and Hidden Markov Models (HMMs) to enhance real-time malware detection, improving accuracy and resilience against evolving threats (Mocanu and Thiriet 2021). This integrated methodology informs our proposed model by highlighting the value of hybrid techniques for improving detection efficiency and adaptability in IoT networks (Abomhara and M. Køien 2015).
Existing IoT malware detection methods, including signature-based, anomaly detection, and traditional ML approaches, have significant limitations such as inability to detect zero-day attacks, high false positives, and difficulty in capturing both spatial and temporal patterns in network traffic. Moreover, many Deep Learning (DL) models focus on either spatial or temporal features separately and are often evaluated on a single dataset, limiting their generalization.
This creates a research gap for an integrated framework that can effectively model both spatial and temporal characteristics of IoT traffic. To address this, the proposed Hybrid Convolutional Neural Network–Long Short-Term Memory (CNN–LSTM) model combines CNN for spatial feature extraction and LSTM for temporal sequence learning within a unified architecture. While Hybrid CNN–LSTM architectures have been explored in prior studies, this work does not claim architectural novelty. Instead, it focuses on a structured implementation and comprehensive comparative evaluation tailored for IoT malware detection. The contribution lies in sequence-based data representation, balanced dataset construction, and rigorous experimental validation using cross-validation and ablation analysis, enabling effective detection of both instantaneous and sequential attack patterns. This results in improved accuracy, reduced false positives, and a more robust and adaptable malware detection framework. The key research gap addressed by this work lies in bridging the gap between spatial and temporal feature extraction for IoT malware detection, offering a more scalable and adaptable solution across different IoT environments.
The proposed framework addresses these limitations by using Deep Learning (DL) models which include CNN and LSTM through its hybrid approach that combines these two DL models. The innovative combination enables the model to successfully capture both spatial and temporal network traffic elements that arise from IoT devices which creates a complete picture of how the malware operates. The hybrid approach improves detection performance because it identifies more actual threats while decreasing incorrect alerts and it supports immediate use in vast IoT systems. The proposed framework delivers an innovative solution for current IoT malware detection problems because it solves three main issues which existing methods face by delivering better detection results and using less processing power. Key contributions are:
• Develop a structured data representation strategy for IoT network traffic using sequence-based modeling to capture temporal dependencies.
• Implement a consistent preprocessing pipeline including normalization and balanced dataset construction to ensure reliable model training.
• Design and evaluate CNN, LSTM, Gated Recurrent Unit (GRU), and Hybrid CNN–LSTM models under a unified experimental framework.
• Perform comprehensive comparative analysis using cross-validation and multiple evaluation metrics to assess model robustness.
• Conduct an ablation study to analyze the contribution of spatial and temporal feature learning in IoT malware detection.
The remainder of this paper is organized as follows. Section 2 presents a comprehensive review of the related literature. Section 3 describes the methodology that developed to research the problem. Section 4 reports and discusses the experimental results. Section 5 provides a summary of the main findings which serve as the conclusion of the paper.
2 Related Work
Akhtar and Feng (2022) created a hybrid model that combines CNN and LSTM networks to conduct real-time malware detection. Their research demonstrated that the system could analyze spatial patterns and temporal dynamics in IoT network traffic when CNN and LSTM were combined. Ali et al. (2023) proposed a DL method which uses network traffic analysis to identify IoT malware through its ability to handle multiple tasks. The researchers proved that their system could detect various malware types through its dual-purpose DL models which operated in IoT environments.
Woźniak et al. (2021) researched the ability of Recurrent Neural Networks (RNNs) to detect malware threats in IoT networks. They developed a model which detects attacks by analyzing network traffic patterns throughout different time periods. Vasan et al. (2020) created MTHAEL as an IoT malware detection system which uses ensemble learning techniques for different architectural systems. Their method combined multiple neural network models for advanced malware detection which achieved better results on advanced malware types across various IoT environments.
Kim et al. (2020) conducted a study to examine the application of ML and DL techniques for detecting IoT botnet attacks. The study discovered that DL methods which include CNN and LSTM enable better botnet malware detection through their ability to understand network traffic patterns. The research showed that DL technology helps IoT protection systems achieve higher accuracy levels while improving their security performance. Al-Fawa’reh et al. (2024) uses Deep Reinforcement Learning (DRL) to detect IoT botnets. Their system achieved successful detection of advanced botnet attacks because it combined reinforcement learning with standard DL techniques. The study showed that reinforcement learning methods can improve detection accuracy in dynamic IoT environments.
Fernando et al. (2020) studied the evolution of ransomware detection using both ML and DL techniques. The paper established that modern malware detection systems need advanced capabilities to detect ransomware attacks which target IoT networks. The researchers tested different algorithms and discovered that DL models showed better performance than traditional ML methods in detecting ransomware. Shi et al. (2024) studied one-class classification methods to detect malware in IoT environments. The method treats malware detection as an anomaly detection task which examines unusual patterns in IoT network traffic. The research showed that one-class classification successfully detected new attacks through its ability to learn normal traffic patterns and detect abnormal behavior.
Saied et al. (2023) performed a comparison study of boosting-based algorithms which detect intrusions in IoT systems. The team evaluated different ensemble learning methods including XGBoost and LightGBM to develop security solutions for IoT systems. The research found that boosting algorithms managed to identify malware yet DL models provided better results when applied to extensive IoT networks because they delivered enhanced capacity and precise performance. Dib et al. (2021) created a DL system that employs multiple dimensions to differentiate between IoT malware while determining its specific family characteristics. The method classifies IoT malware into different families and types, but its multi-dimensional DL network approach shows better accuracy and generalization performance for malware detection.
Pai et al. (2025) established a structured method for detecting IoT malware which required advanced DL methods to achieve better security and performance outcomes. Their approach improved the accuracy of malware detection while also ensuring that the IoT devices’ performance was not significantly impacted. Wazzan et al. (2022) developed a cross-DL technique which enables the detection of IoT botnet propagation through their proposed method. The system used different DL models to monitor IoT botnet distribution because it achieved better results in detecting both existing and new types of botnets. The research demonstrates that cross-architecture models serve as essential tools which enable secure and efficient protection of IoT environments are shown in Table 1.
Table 1 Summary of related work on IoT malware detection techniques
| Methodology/ | ||||
| Research Paper | Contribution | Algorithms Used | Dataset Used | Results |
| Akhtar and Feng (2022) | Hybrid model (CNN + LSTM) for realtime malware detection | CNN + LSTM hybrid model | IoT network traffic | Improved malware detection performance |
| Ali et al. (2023) | Multitask DL for IoT malware detection | Multitask DL | IoT network traffic | Effective identification of different malware types |
| Woźniak et al. (2021) | RNN for IoT malware detection based on network traffic patterns | RNN | IoT network traffic | Successful detection of time dependent malware |
| Vasan et al. (2020) | MTHAEL: Cross architecture malware detection using ensemble learning | Ensemble learning, multiple neural networks | IoT malware dataset | Enhanced malware detection with ensemble methods |
| Kim et al. (2020) | DL for IoT botnet detection | CNN + LSTM DL models | Botnet traffic dataset | Improved accuracy and security for IoT botnets |
| Al-Fawa’reh et al. (2024) | DRL for IoT botnet detection | DRL | IoT botnet attack dataset | Effective detection of advanced botnet attacks |
| Fernando et al. (2020) | Ransomware detection using DL | DL models | Ransomware attack dataset | DL outperforms traditional methods |
| Shi et al. (2024) | One-class classification for anomaly-based malware detection | One-class classification (anomaly detection) | IoT network traffic | Detected new attacks through abnormal behavior detection |
| Saied et al. (2023) | Comparative study of boosting algorithms for IoT malware detection. | XGBoost, LightGBM, boosting algorithms | IoT intrusion dataset | Effective but DL models outperformed them |
| Dib et al. (2021) | Multi-dimensional DL for malware classification and family attribution | Multi-dimensional DL | IoT malware dataset | High accuracy and generalization for malware classification |
| Pai et al. (2025) | Efficient IoT malware detection with limited resources | DL models | IoT malware dataset | Improved detection with low resource usage |
| Wazzan et al. (2022) | Cross-DL for IoT botnet propagation detection | Cross-DL models | IoT botnet propagation dataset | Effective for detecting known and new botnet types |
Existing DL approaches, including CNN, LSTM, and ensemble-based methods, often face limitations in simultaneously capturing spatial and temporal dependencies, require high computational resources, and show reduced generalization to heterogeneous IoT traffic. The proposed Hybrid CNN–LSTM model addresses these gaps by integrating spatial and temporal learning into a single architecture, improving both accuracy and scalability for IoT malware detection.
Recent studies show that DL models, which include CNN and LSTM and hybrid architectures, successfully detect IoT malware. The system achieves better detection accuracy through spatial and temporal feature analysis while multi-task learning and ensemble methods and anomaly detection methods enable system performance and scalability improvements in dynamic IoT settings.
2.1 Problem Statement
The rise of IoT devices has led to more cyberattacks which specifically target networks that have security vulnerabilities through malware threats (Ali et al. 2023). The traditional malware detection systems which use signature-based methods cannot identify advanced and changing threats that emerge in active IoT environments (Vasan et al. 2020). The standard methods for detecting malicious activities face challenges because IoT devices transmit data through complex and diverse methods (Al-Fawa’reh et al. 2024). Existing systems struggle to detect zero-day attacks because they must simultaneously handle highspeed IoT network data processing requirements (Saied et al. 2023). The development of new malware detection systems requires advanced adaptive detection systems which can identify both established and new malware threats in IoT networks (Pai et al. 2025).
2.2 Challenges Overcome in Proposed Work
The proposed work addresses several key challenges in IoT malware detection. The system detects new and advanced malware threats which traditional signature-based detection systems cannot identify. The work achieves accurate detection results by using DL models that include CNN and LSTM to analyze network traffic through both its spatial and temporal characteristics. The system detects malware in real time because its solution operates throughout large IoT networks which undergo continuous changes. The Hybrid CNN–LSTM approach enhances the model’s ability to detect attacks by detecting complex evolving threats while maintaining high operational efficiency and producing few false positive results across multiple IoT environments.
3 Methodology
The Hybrid CNN–LSTM architecture used in this study follows a standard design where CNN is employed for spatial feature extraction and LSTM is used for temporal sequence modeling. Rather than introducing a new architecture, this work focuses on a structured implementation tailored to IoT network traffic data.
The workflow begins with Data Collection using the IoT-23 dataset which contains network traffic data that has been labeled with both normal traffic patterns and multiple types of malicious activities including C&C, Distributed Denial-of-Service (DDoS), Okiru, and Port Scan attacks. The system applies CNN Architecture for IoT Malware Detection after completing Data Pre-processing which includes data cleaning and normalization and data partitioning. The Hybrid CNN–LSTM Model combines these models to classify network traffic into five categories which include Benign, C&C, DDoS, Okiru, and Port Scan. The model’s performance is evaluated through key metrics which include accuracy and precision and recall and F1-score and ROC-AUC. The Hybrid CNN–LSTM model outperforms the other models because it shows superior performance in detecting IoT malware in Figure 1.
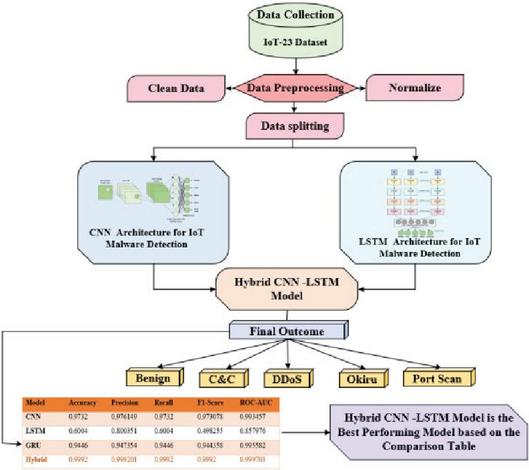
Figure 1 Overall proposed work.
3.1 Problem Understanding
Malware attacks which include botnets and DDoS attacks now use IoT devices as their preferred targets because these devices have experienced rapid growth in deployment. The traditional security approach which uses signature-based detection methods proves ineffective because it cannot detect the advanced emerging threats that target IoT networks. IoT environments require advanced detection methods to identify both existing malware and new malware threats because these environments operate with limited resources and experience ongoing changes. The research evaluates three DL models include CNN LSTM and a Hybrid CNN–LSTM model to determine their effectiveness at detecting malware in IoT network traffic while solving problems with scalability and real-time detection and accuracy.
3.2 Data Collection
The researchers used the IoT-23 Pre-processed Dataset (iot23_preprocessed 2023) from Kaggle as their primary data source for this research. The dataset provides labelled network traffic data which includes normal network traffic and multiple types of malicious network traffic that includes C&C DDoS attacks Okiru malware and Part of a Horizontal Port Scan activities. The dataset provides a wide variety of network behaviors which make it suitable for training DL models to detect IoT-specific attacks. The dataset contains labelled instances which enable researchers to classify network traffic as normal or malicious while developing and testing effective IoT malware detection systems.
The IoT-23 dataset includes 80 attributes such as packet size, flow duration, protocol type, source and destination ports, and flags. Each class is represented by approximately 5000 samples: Benign, C&C, DDoS, Okiru, and Port Scan. This balanced dataset ensures equal representation of all categories for model training and evaluation, enabling the DL models to learn diverse traffic patterns effectively.
Table 2 Class labels and distribution of the IoT-23 dataset
| Class Label | Description | Number of Samples |
| Benign | Normal IoT network traffic | 5000 |
| C&C | Command and Control communication traffic | 5000 |
| DDoS | Distributed Denial of Service attack traffic | 5000 |
| Okiru | Okiru malware traffic | 5000 |
| Port Scan | Horizontal port scanning activity | 5000 |
The IoT-23 pre-processed dataset contains five distinct traffic classes, including one benign class and four malicious classes in Table 2. The dataset maintains approximately equal distribution because every class contains approximately the same number of samples. The balanced class distribution protects model training from bias while providing equal testing conditions for all traffic types.
3.3 Data Preprocessing
Data preprocessing involves multiple essential steps which guarantee that the dataset becomes appropriate for training ML models. The first step to data cleaning requires solving missing value issues through two techniques which include using imputation to replace missing values with either the mean or median and deleting rows or columns that contain extreme missing data. Normalization uses Min-Max scaling for transforming values from 0 to 1 and Z-score standardization for centering data at zero with a standard deviation of one which enables uniform feature scaling. The preprocessing steps create data which maintains cleanliness and consistency to support effective model training and testing procedures.
3.3.1 Clean data
Data cleaning requires the elimination of all data discrepancies and data omissions which could affect model performance. The process of handling missing values exists because realworld datasets demonstrate a pattern of missing values. The procedure of imputation replaces missing values with appropriate values which can include the feature’s mean or median from existing data. The mean value of packet sizes throughout the dataset serves as a replacement for missing values in the packet size feature. The second method requires the deletion of all rows and columns which contain excessive missing data because this data diminishes the dataset’s capacity to support training according to the definition established in Equation (1)
| (1) |
The imputed value for the missing data point is represented by while shows all the available data for that specific feature and counts all the legitimate data points that exist for that feature.
3.3.2 Normalize
The process of normalization establishes a unified measurement system for all dataset features, which stops features with greater measurement ranges from controlling how the model learns. Min-Max scaling and Z-score standardization function as two widely used methods for performing normalization. The method applies a transformation which brings all features to a standard range that typically exists between 0 and 1. The transformation process starts with the minimum feature value which gets subtracted from all feature values, and then the remaining value gets divided by the total difference between maximum and minimum feature values. The equation for Min-Max scaling appears in Equation (2)
| (2) |
The original feature value gets transformed through this process into standardized form which uses minimum feature value and maximum feature value . The Z-score standardization method transforms data into a standard form which has a mean value of 0 and a standard deviation of 1. The Z-score standardization equation is presented in Equation (3)
| (3) |
The original feature value is represented by while serves as the feature value mean and functions as the feature value standard deviation. The two normalization methods establish equal treatment of all model features by DL systems which prevents any single feature from dominating model outcomes because of its different measurement scale.
Temporal dependencies are captured by transforming network flow data into ordered sequences using a sliding window approach. Given , a window size of is used to generate sequences , preserving temporal order.
Network flow features from the IoT-23 dataset, including packet size, flow duration, protocol type, source and destination ports, and flags, are structured into a fixeddimensional vector of size 80 per sample to serve as input for the DL models. To capture temporal dependencies for the LSTM-based models, consecutive network flows are grouped into sequences of ten time-ordered samples, preserving the chronological order of network events. Class distribution was adjusted to ensure approximately 5000 samples per category, including Benign, C&C, DDoS, Okiru, and Port Scan, providing balanced representation for model training and ensuring that evaluation results remain methodologically reliable.
The preprocessing pipeline is carefully designed to support the hybrid learning framework by aligning input representations with both spatial and temporal modeling requirements. Data normalization is applied to ensure feature scale consistency, which improves convergence during training. Subsequently, sequence generation is performed using a sliding window approach to transform raw network traffic into temporally ordered sequences. This enables the LSTM component to capture sequential dependencies, while preserving feature relationships for effective spatial pattern extraction by the CNN component.
3.3.3 Sequence construction
Sequence construction is performed to capture temporal dependencies in IoT network traffic for LSTM-based modeling. The preprocessed feature vectors are transformed into ordered sequences using a sliding window approach.
Let the dataset be represented as a sequence of feature vectors is given in Equation (4)
| (4) |
where each represents a -dimensional feature vector at time step . Given a fixed window size , sequences are constructed as in Equation (5)
| (5) |
Each sequence preserves the temporal order of network traffic and is assigned the label corresponding to the last element in the sequence.
| Algorithm 1: Sequence Construction Using Sliding Window |
| Input: Preprocessed dataset , labels , |
| window size |
| Output: Sequence set S, corresponding labels L |
| 1. Initialize empty list and |
| 2. For to do |
| 3. Extract sequence |
| 4. Assign label |
| 5. Append to |
| 6. Append to L |
| 7. End For |
| 8. Return S, L |
This sequence construction process enables the model to learn temporal patterns by preserving the chronological structure of IoT traffic data, which is essential for detecting sequential attack behaviors such as botnets and DDoS attacks.
Sliding window and disjoint sequence generation represent two different approaches for constructing temporal data. In the sliding window approach, consecutive sequences share overlapping elements, such that and , enabling finergrained temporal modeling but introducing potential redundancy. In contrast, disjoint sequences are constructed without overlap, where and , ensuring complete independence between sequences.
In this study, sequence generation is carefully controlled to maintain strict separation between training and testing data, minimizing overlap across dataset partitions. This design prevents information leakage and ensures reliable model evaluation.
Temporal ordering constraints are strictly preserved during sequence construction, meaning that for any sequence , the ordering satisfies , where represents the timestamp of each network flow. This guarantees that the model learns from chronologically consistent data, which is essential for capturing realistic loT traffic behavior and sequential attack patterns.
3.3.4 Data splitting
The researchers will split the dataset into training and testing sets after they complete the data cleaning and normalization process. The model performance assessment depends on this division because it enables testing with data that the model has not encountered before. The model training process uses 80% of the dataset while 20% of the dataset remains available for testing purposes. The testing set helps assess how well it generalizes to new, unseen data, ensuring it does not overfit to the training data. The split between the training and testing sets works to demonstrate that the model can successfully handle both previously known data and completely new data.
Proper sequence independence is ensured during the preparation of input data for LSTM-based modeling. The sliding window sequence generation is controlled to avoid overlap between sequences used in training and testing. Data splitting is performed before sequence construction, ensuring that sequences in the training set do not share any data points with those in the testing set. This strict separation eliminates the risk of data leakage and ensures reliable model evaluation.
Cross-validation uses folds created from the training data prior to sequence construction. Sequence generation is performed independently within each fold, ensuring that no sequences share common data points across folds. This guarantees strict separation between training and validation data and prevents data leakage in LSTM-based modeling.
3.4 CNN Architecture for Multi-Class IoT Malware Detection
Advanced techniques which analyze network traffic patterns serve as necessary tools for malware detection in IoT networks which face threats from botnets and DDoS attacks and various other malicious activities. The presented CNN architecture processes raw IoT network traffic data through its Conv1D layer which detects patterns in packet sizes and flow durations and other traffic characteristics to extract spatial features. The Max Pooling layer preserves essential information while it decreases the complexity of feature maps. The system first extracts feature before passing them to fully connected layers which execute the process of feature combination for classification. The output layer uses the SoftMax function to give class probabilities which include Benign, C&C, DDoS, Okiru, and Port Scan to support effective multi-class malware detection in Figure 2.
The Conv1D-based CNN component consists of three convolutional layers designed to extract spatial features from network traffic. The first Conv1D layer employs 64 filters with a kernel size of three, followed by ReLU activation. The second layer uses 128 filters with a kernel size of five, and the third layer applies 256 filters with a kernel size of seven, each followed by ReLU activation. Every convolutional layer is succeeded by a MaxPooling1D layer to reduce dimensionality and retain essential spatial patterns. The resulting feature maps are flattened and reshaped into sequential vectors that are then fed into the LSTM component for temporal learning, enabling the hybrid model to capture both spatial and temporal characteristics of IoT traffic.
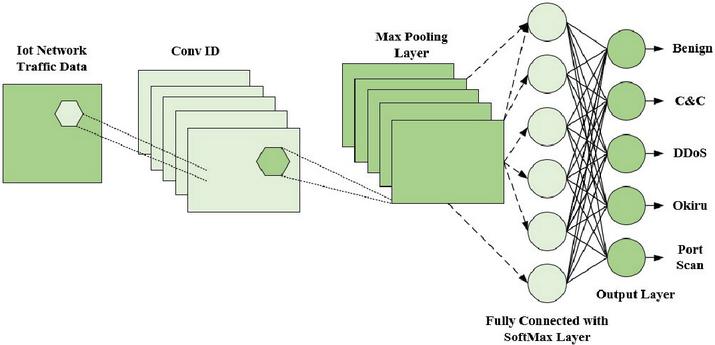
Figure 2 CNN architecture for IoT malware detection.
3.4.1 Input layer
The process begins with the IoT network traffic data which contains multiple features including packet size and flow duration and protocol type and other network attributes. The network receives this raw data as input to be analyzed.
3.4.2 Convolution layer
The Conv1D layer extracts spatial features from input data by using its processing capabilities. The 1D convolution applies several filters to detect patterns in the network traffic, such as traffic bursts, irregular communication patterns, or unusual flow behaviors that might indicate malicious activity. The network learns to recognize patterns that are typical of specific types of attacks which include botnets and DDoS attacks. The convolution operation requires mathematical processing which is outlined in Equation (6)
| (6) |
where is the output of the convolution, is the input feature map (network traffic data), is the filter (weights), is the length of the filter.
3.4.3 Max pooling layer
The Max Pooling layer follows the convolutional layers and helps reduce the dimensionality of the feature maps. The system maintains essential characteristics of the feature map through maximum value extraction from a small area. The system achieves two benefits through this method because it decreases computing demands while teaching the network to concentrate on its main characteristics.
3.4.4 Fully connected layer
It processes data through a dense layer which functions as a fully connected layer after the pooling layer. The layer begins to make decisions based on the learned patterns after it combines features from the convolutional and pooling layers. The fully connected layer connects every neuron from the previous layer to each neuron in the next layer. The layer operates according to the equation which is presented in Equation (7).
| (7) |
where is the output from the layer, is the weight matrix, is the input feature vector, is the bias term,
3.4.5 Output layer
The final output layer uses a SoftMax activation function to assign probabilities to each class (Benign, C&C, DDoS, Okiru, and Port Scan). The SoftMax function transforms the output into a probability distribution which maintains a total probability sum of 1. The model then assigns the class with the highest probability as the prediction is given in Equation (8)
| (8) |
where is the probability that input belongs to class is the score (logits) for class , The denominator is the sum of the exponentials of the logits for all classes, ensuring that the probabilities sum to 1.
| Algorithm 2: Pseudocode for CNN Architecture for Multi-Class IoT Malware Detection |
| Input: IoT network traffic dataset , labels |
| Output: Predicted class for each traffic sample |
| Initialize CNN parameters: |
| Initialize convolution filters |
| Initialize bias terms |
| Initialize fully connected weights W_fc |
| Initialize learning rate and epochs |
| For epoch = 1 to Max_Epochs do |
| For each traffic sample x in X do |
| Step 1: Input Layer |
| Input x to the CNN model |
| Step 2: Convolution Layer (Conv1D) |
| For each filter j do |
| Compute convolution output: |
| Convolution |
| Apply activation function (ReLU) |
| End For |
| Step 3: Max Pooling Layer |
| For each feature map do |
| Select maximum value from pooling window |
| End For |
| Step 4: Fully Connected Layer |
| Flatten pooled feature maps |
| Compute dense layer output: |
| Step 5: SoftMax Output Layer |
| For each class do |
| Compute class probability: |
| End For |
| Step 6: Classification |
| Assign class with highest probability as prediction |
| End For |
| End For |
| Return predicted classes |
3.5 LSTM Architecture for IoT Malware Detection
The IoT malware detection task depends on network traffic analysis because timedependent patterns need to be identified. LSTM networks function effectively in this area because they possess the ability to learn from sequential data while maintaining longduration data dependencies. The LSTM architecture operates on IoT network traffic data through its analysis of temporal patterns which it uses to classify network traffic into two categories: benign and malicious (which includes C&C, DDoS, Okiru, Port Scan). The model executes data processing through a sequential approach which enables it to understand network traffic patterns based on their chronological sequence. The system starts with an Input Layer which connects to multiple LSTM layers before it reaches a fully connected (dense) layer and an Output Layer. The LSTM layers help the model to store important information throughout the entire process while it discards nonessential information which allows to identify patterns that occur across multiple time intervals as shown in Figure 3.
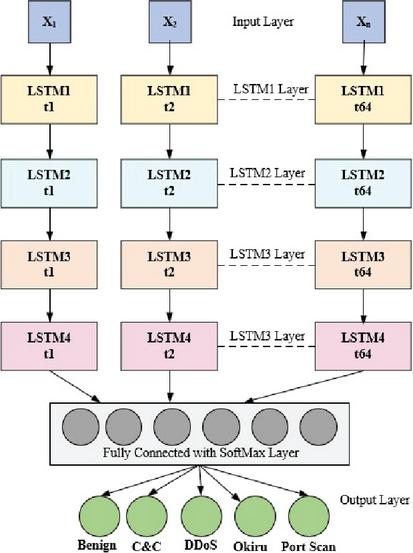
Figure 3 LSTM architecture for IoT malware detection
The LSTM module receives sequences constructed from ten consecutive network flow samples, maintaining the chronological order of events. Each LSTM unit preserves longterm dependencies using its forget, input, and output gates, allowing the model to retain critical temporal information while discarding irrelevant data. Hidden states from stacked LSTM layers are combined and passed to a fully connected dense layer, which performs classification into five traffic categories: Benign, C&C, DDoS, Okiru, and Port Scan. This sequential modeling ensures that temporal relationships in the IoT network traffic are effectively learned, improving the detection of time-dependent malware behaviors.
The GRU architecture was included in the comparative evaluation as an alternative recurrent model. GRU simplifies the LSTM by combining the forget and input gates into a single update gate, which reduces computational complexity while maintaining the ability to capture temporal dependencies. The GRU model used in this study consists of a single recurrent layer with 128 hidden units, processing sequences of ten time-ordered network flows and producing hidden states that are passed to a fully connected dense layer for classification into the five traffic categories: Benign, C&C, DDoS, Okiru, and Port Scan.
3.5.1 Input layer
The Input Layer receives sequential data representing the IoT network traffic at each time step, denoted as , where each represents the data at time step . The data includes packet sizes, flow durations, protocol types, and other essential network attributes. The model processes this data sequentially, capturing the temporal evolution of network traffic.
3.5.2 LSTM layers
The primary component of LSTM architecture serves as the foundation which requires multiple LSTM layers to function properly. An LSTM unit contains three gates, which manage information flow through the system: the forget gate, the input gate, and the output gate. The gates decide which information from past memories must be kept, which new information needs to be stored, and which parts of memory should be used as output. The model employs multiple stacked LSTM layers to acquire understanding of different traffic data patterns which emerge during various timeframes.
Forget Gate
The forget gate decides how much of the previous memory () should be carried forward to the current time step. It is computed as given in Equation (9)
| (9) |
where is the forget gate output (a value between 0 and 1, indicating the proportion of memory to forget), is the sigmoid activation function, is the weight matrix for the forget gate, is the hidden state from the previous time step, is the current input at time step is the bias term for the forget gate.
Input Gate
The input gate decides how much new information should be stored in the cell state. It is computed as given in Equation (10)
| (10) |
where is the input gate output (determining how much new information is added to the memory), is the weight matrix for the input gate, is the bias term for the input gate.
Output Gate
The output gate determines the output of the LSTM unit, which is used as the hidden state for the current time step. It is computed as given in Equation (11)
| (11) |
where is the output gate, which decides what information is passed as the hidden state, is the weight matrix for the output gate, is the bias term for the output gate.
Cell State Update
The cell state is updated based on the forget and input gates. The new cell state is a combination of the previous memory and new information is given in Equation (12)
| (12) |
where is the updated cell state at time step is the previous cell state, represents the portion of the previous memory that is retained, ) represents the new information added to the memory, modulated by the input gate, is the weight matrix for the cell state, is the bias term for the cell state update, tanh is the hyperbolic tangent function, which scales the values between 1 and 1.
Hidden State
The hidden state at time step is the output of the LSTM unit, which is passed to the next time step or the output layer is given in Equation (13)
| (13) |
where is the hidden state (the output of the LSTM unit), is the output gate value, is the tanh activation applied to the updated cell state, ensuring the hidden state is scaled between 1 and 1.
3.5.3 Fully connected layer
The data output from stacked LSTM layers goes to a fully connected (dense) layer. This layer combines all LSTM layer features to execute the last classification task. The dense layer builds a decision boundary which enables classification of data into multiple target categories.
3.5.4 Output layer
The final output layer uses the SoftMax activation function to output probabilities for each class. The SoftMax function ensures that the probabilities of all classes sum to 1, making it suitable for multi-class classification. The classes in this case are Benign, C&C, DDoS, Okiru, and Port Scan, each representing different types of IoT network behavior given in Equation (14)
| (14) |
where is the probability that input belongs to class is the score (logit) for class , The denominator sums over all the classes to normalize the probabilities.
| Algorithm 2: Pseudocode for LSTM IoT Malware Detection |
| Input: Sequential IoT traffic data , labels |
| Output: Predicted traffic class |
| Initialize weights and biases for: |
| Forget gate, Input gate, Output gate, Cell candidate |
| Initialize dense layer weights and bias |
| Set learning rate and number of epochs |
| For epoch = 1 to Max_Epochs do |
| For each sequence in dataset |
| do Initialize hidden and cell states |
| Process each time step |
| For to T do |
| Forget gate: Decide what old info to keep |
| Input gate: Decide new info to store |
| sigmoid (Wi * [h, Xt] + bi) |
| Candidate memory |
| Update cell state |
| Output gate: Decide hidden state |
| End For |
| Fully connected layer |
| SoftMax: Convert to probabilities For |
| each class do |
| End For |
| Predict class with highest probability |
| Predicted class |
| End For |
| End For |
| Return all predicted classes |
3.6 Hybrid CNN–LSTM Architecture for IoT Malware Detection
Hybrid CNN–LSTM architecture uses spatial feature learning together with temporal sequence modeling to achieve precise IoT malware detection results. The IoT network traffic exhibits complex patterns because hackers use immediate feature changes together with their time-based development patterns which include standard botnet operations and coordinated DDoS attack patterns. The hybrid model unites CNN and LSTM networks into one complete system.
The spatial feature maps generated by the CNN component are flattened and organized into sequential vectors before being fed into the LSTM component. This integration enables the Hybrid CNN–LSTM model to simultaneously learn spatial patterns and temporal dependencies present in IoT network traffic. By combining both feature extraction mechanisms, the model can accurately classify diverse malware behaviors while maintaining high detection performance across all categories.
The CNN component begins its work by processing preprocessed IoT traffic features through its one-dimensional convolution operations. The Conv1D layers use multiple filters to process the input sequence and identify local spatial patterns. This operation can be expressed as given in Equation (15)
| (15) |
where is the input traffic feature vector and is the convolutional filter which operates with a filter size of to produce the feature map . The extracted feature maps function to identify two critical spatial patterns which include sudden traffic bursts and unusual packet distribution. The MaxPooling layer then reduces the dimensionality of these feature maps by selecting the maximum value within each pooling window, which helps decrease computational complexity and improves generalization by suppressing noise.
The CNN layers generate spatial features which feed into the LSTM component that learns temporal dependencies of network traffic. The LSTM uses its internal memory system to maintain long-term information while it discards unnecessary details. The LSTM cell state update process depends on is given in Equation (16)
| (16) |
where is the current cell state, is the forget gate controlling retained memory, is the input gate determining new information, and is the input at time step . The hidden state output of the LSTM is computed as given in Equation (17)
| (17) |
The model can learn to repeat behavior patterns of attacks which occur over different times. The LSTM produces its results which the system sends to fully connected network layers that execute decision processes while a SoftMax output layer performs multi-class classification is given in Equation (18)
| (18) |
where denotes the probability of the input belonging to class . The model classifies IoT traffic into Benign, C&C, DDoS, Okiru, and Port Scan. By integrating CNNbased spatial learning with LSTM-based temporal modeling, the Hybrid CNN–LSTM architecture provides a robust and effective solution for detecting diverse IoT malware behaviors.
The combination of CNN and LSTM is motivated by the complementary nature of spatial and temporal features present in IoT network traffic. CNN effectively captures local spatial patterns and correlations among traffic features, such as packet-level characteristics and feature interactions. In contrast, LSTM models sequential dependencies by learning temporal relationships across consecutive network flows, which is essential for identifying evolving attack behaviors. Integrating these two components enables the model to simultaneously capture instantaneous patterns and long-term dependencies, thereby enhancing the detection of both static and time-dependent malware activities.
4 Results and Discussion
This section presents a detailed evaluation of the proposed CNN, LSTM, GRU, and Hybrid CNN–LSTM models for IoT malware detection. The models were assessed using multiple performance metrics, including Accuracy, Precision, Recall, F1Score, and ROC-AUC, to measure their effectiveness in identifying benign and malicious traffic. The research demonstrates that the hybrid model achieves superior results compared to its individual CNN and LSTM components because it can capture both spatial and temporal patterns present in IoT network traffic. The ablation studies reveal how each model component contributes to system performance because the study shows that CNN generates spatial features while LSTM models temporal data and dropout enhance model stability while decreasing overfitting.
Table 3 Experimental setup for IoT malware detection
| Component | Specification |
| CPU | Intel Core i7 / AMD Ryzen 7 |
| RAM | 16 GB |
| GPU | Optional GPU acceleration (TensorFlow compatible) |
| OS | Windows / Linux |
| Software | Python 3.9, Keras/TensorFlow, Pandas, NumPy, Scikit-learn, Matplotlib, Seaborn |
4.1 Experimental Setup
The experiments for IoT malware detection were conducted on a system with an Intel Core i7/AMD Ryzen 7 processor, 16 GB RAM, and optional GPU acceleration using TensorFlow as shown in Table 3. The data pre-processing and model training as well as visualization were done using Python 3.9 together with Keras/TensorFlow and Pandas and NumPy and Scikit-learn and Matplotlib and Seaborn.
The dataset is divided into training and testing sets using an 80/20 split. Performance metrics are computed on the testing set, which remains completely unseen during training. Confusion matrix analysis is performed to evaluate class-wise prediction performance and to provide a detailed understanding of classification behavior across different IoT traffic categories see Table 3.
The IoT-23 dataset was preprocessed by scaling the features using Min-Max Scaling and encoding the labels using one-hot encoding. A balanced subset of 5,000 samples per class was selected, with used for training and for testing through random sampling. To ensure reliable evaluation, five-fold cross-validation was employed. The proposed Hybrid CNN–LSTM model consists of Conv1D layers for spatial feature extraction, MaxPooling1D for downsampling, followed by LSTM layers for temporal modeling. The architecture also includes a fully connected dense layer with ReLU activation, a dropout rate of 0.3, and a SoftMax output layer. Hyperparameter optimization was performed using a grid search method to select optimal values for learning rate, batch size, and number of epochs. The final model was trained with a batch size of 32 over 50 epochs using the Adam optimizer. Performance was evaluated using metrics such as accuracy, precision, recall, and F1-score, averaged across all folds of the cross-validation.
Baseline ML models such as SVM and Random Forest (RF) are incorporated for comparative evaluation.
Table 4 Performance comparison of baseline models and proposed model
| Model | Accuracy | Precision | Recall | F1Score | ROCAUC |
| Support Vector Machine (SVM) | 0.9725 | 0.9718 | 0.9720 | 0.9719 | 0.9852 |
| Random Forest (RF) | 0.9812 | 0.9807 | 0.9810 | 0.9808 | 0.9913 |
| Proposed CNN–LSTM Model | 0.9991 | 0.9990 | 0.9991 | 0.9991 | 0.9997 |
Table 4 compares the performance of the proposed CNN–LSTM model with baseline ML models, including SVM and RF. The results demonstrate that the proposed model significantly outperforms traditional approaches across all evaluation metrics, highlighting its effectiveness in capturing both spatial and temporal patterns in network traffic data.
4.2 Hyperparameter Configuration
The performance and stability of DL models depend on hyperparameter settings because these settings determine model behaviors. The correct selection of hyperparameters leads to effective learning and rapid convergence while enabling accurate architectural comparisons. The study used established hyperparameter settings to achieve consistent results across CNN and LSTM and GRU and Hybrid CNN–LSTM models used for IoT malware detection.
Table 5 Hyperparameter settings used for model training
| Hyperparameter | Value |
| Optimizer | Adam |
| Learning Rate | 0.001 |
| Batch Size | 64 |
| Epochs | 50 |
| Activation Function | ReLU / Tanh |
| Dropout Rate | 0.5 |
| Loss Function | Categorical Cross-Entropy |
| Output Activation | SoftMax |
| Number of Classes | 5 |
Table 5 shows that the hyperparameters for the CNN, LSTM, GRU, and Hybrid CNN–LSTM models were selected through a combination of empirical testing and grid search to ensure stable and efficient training. The Adam optimizer with a learning rate of 0.001 was chosen for its fast convergence and stable performance. A batch size of 64 provided a balance between computational efficiency and gradient stability, while training for 50 epochs ensured sufficient learning without excessive computational cost. A dropout rate of 0.5 was applied to reduce overfitting. ReLU and Tanh activation functions were used to capture non-linear patterns, and the SoftMax activation with categorical cross-entropy loss enabled effective multi-class classification for IoT malware detection.
4.3 Computational Resources
Experiments were conducted on a system equipped with a 12th Generation Intel® CoreTM i5-12400 CPU which operated at 2.50 GHz with its 6-core and 12-thread Configuration and 8 GB DDR4 RAM which provided 7.75 GB of usable memory and 64-bit x64-based architecture. The system used a solid-state drive (SSD) for storage while integrated Intel UHD Graphics provided all graphics processing requirements. The software environment used Microsoft Windows (64-bit) together with Python 3.11.9 and PyCharm which served as the development environment. Core libraries used for data processing together with model development and analysis functions included NumPy, Pandas, Scikitlearn, Matplotlib, SciPy, and PyTorch (CPU-based). These resources were sufficient to train and evaluate DL models for IoT malware detection efficiently.
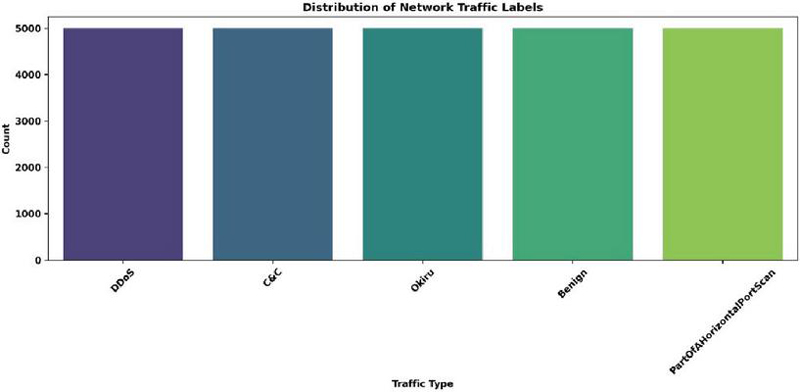
Figure 4 Distribution of network traffic samples in the IoT-23 dataset.
The distribution of network traffic labels in the dataset which contains approximately equal sample sizes for each class in Figure 4. The dataset contains between 4000 and 5000 samples for each of the DDoS, C&C, Okiru, Benign, and Port Scan categories which creates a balanced dataset that trains properly while maintaining equal representation of all traffic types to enhance malware detection performance.
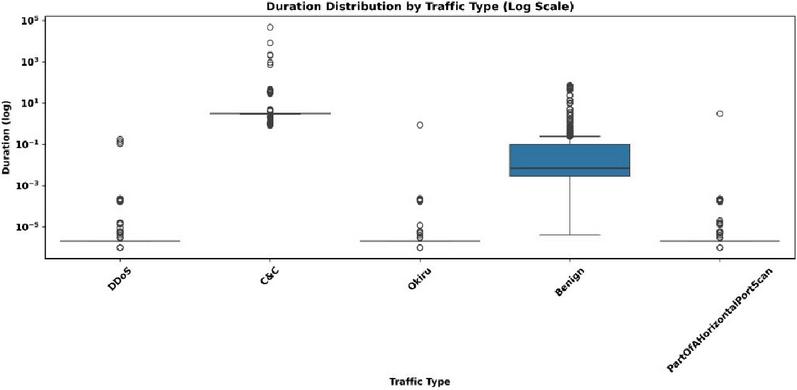
Figure 5 Duration distribution of network traffic flows by traffic type (log scale).
The duration distribution plot shows that attack traffic, such as DDoS and Port Scan, exhibits a distinct pattern compared to benign traffic, enabling effective differentiation between normal and malicious flows based on temporal characteristics. As illustrated in Figure 5, traffic durations are represented on a logarithmic scale, where benign traffic has a median around and shows a wide distribution with several outliers extending up to . In contrast, attack types such as DDoS, C&C, Okiru, and Horizontal Port Scan have shorter durations, with median values ranging between and . This variation in duration across traffic types highlights the temporal differences between benign and malicious activities, thereby improving detection performance.
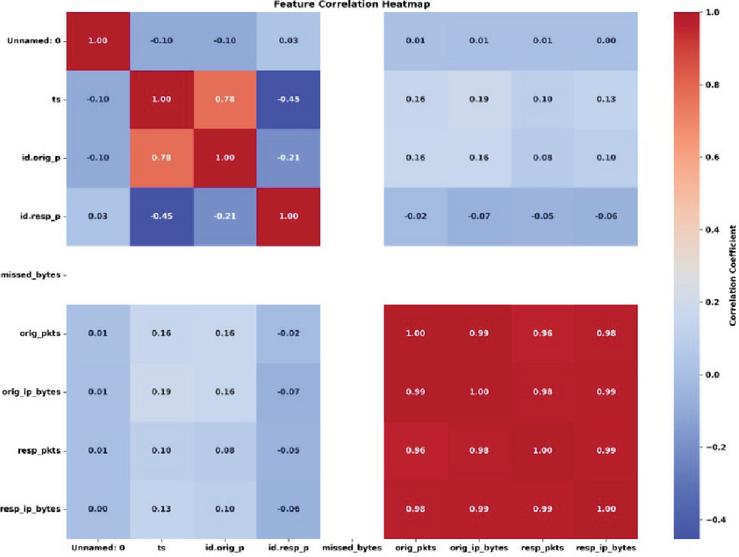
Figure 6 Feature correlation heatmap of the IoT-23 dataset.
The feature correlation heatmap in Figure 6 illustrates the relationships between different flow-level features, showing that certain features are strongly correlated. In particular, orig_ip_bytes and resp_ip_bytes exhibit a very high positive correlation of 0.99, indicating symmetric traffic patterns in most network sessions, which helps the model distinguish between benign and malicious traffic. Similarly, id.orig_p and id.resp_p show a strong positive correlation of 0.78, while some features, such as ts and missed_bytes, display a moderate negative correlation of 0.45. Overall, these correlations highlight the interdependence among features and contribute to improved pattern recognition and classification performance.
4.4 Evaluation Metrics
The proposed models for IoT malware detection use CNN, LSTM, GRU, and Hybrid CNN–LSTM models’ performance evaluation through standard classification metrics. The metrics assess model performance by measuring their ability to identify valid network traffic and dangerous traffic while reducing both false alarms and actual security breaches, which serves as essential requirement for protecting secure IoT environments.
The stability and reliability of the exceptionally high predictive performance reported for the Hybrid CNN–LSTM model, five-fold cross-validation was performed. The dataset was randomly divided into five equal subsets, with four subsets used for training and one subset for validation in each iteration. Performance metrics, including accuracy, precision, recall, and F1-score, were averaged across all folds to confirm the robustness of the model and to reduce the risk of overfitting. This validation strategy demonstrates that the hybrid model’s high predictive capability is consistent and methodologically sound.
The high performance of the Hybrid CNN–LSTM model is due to the well-balanced IoT23 dataset, which enables effective learning, and the model’s hybrid architecture, combining CNN for spatial features and LSTM for temporal patterns. To prevent overfitting, we applied five-fold cross-validation, dropout regularization, and hyperparameter tuning. Additionally, rigorous data preprocessing ensured no data leakage, confirming the performance is reliable.
While an 80/20 train-test split was used for simplicity and computational efficiency, additional measures were taken to ensure the robustness of the evaluation. In addition to this split, five-fold cross-validation was performed, which provides a more thorough assessment by testing the model on different subsets of the data. This cross-validation approach helps address the potential limitations of a single train-test split, ensuring that the model’s performance is not overly dependent on any specific data partition. Furthermore, performance metrics were averaged across all folds to obtain a more stable and reliable evaluation.
The classification model demonstrates its overall correctness through accuracy measurement which calculates the ratio of correctly classified samples to total traffic instances. The model performance assessment shows general results through this method but security-sensitive scenarios require different detection effectiveness measures is given in Equation (19)
| (19) |
The precision test measures model accuracy by assessing how many predicted malicious traffic samples from actually were malicious. Equation (20) establishes that high precision functions as an essential requirement for IoT malware detection systems because it prevents false positive security alerts and stops unnecessary security procedures from occurring.
| (20) |
The model’s capability to identify all actual malware samples that exist in the network constitutes the measurement of recall. Equation (21) shows that high recall values demonstrate successful attack detection which protects IoT systems from security breaches.
| (21) |
The F1-Score provides a balanced evaluation by combining precision and recall into a single metric. Equation (22) shows how it functions for malware detection because both false positives and false negatives have serious effects on the results.
| (22) |
The ROC-AUC metric shows how well the system can differentiate between safe and dangerous network traffic when operating at various classification thresholds. A higher AUC value indicates stronger discrimination capability and more robust malware detection performance is given in Equation (23)
| (23) |
The above confusion matrix metrics are expressions referring to the definition of ease for the , and values: true positives, true negatives, false positives, and false negatives.
Statistical significance testing is conducted to strengthen the experimental design and enable comparison of different models. Specifically, paired statistical tests are applied to determine whether the observed performance differences between models are statistically significant rather than arising from random variation. The results confirm that the Hybrid CNN–LSTM model demonstrates statistically significant improvements over the baseline and individual models.
Table 6 Performance evaluation using cross-validation and independent test set
| Dataset | Accuracy | Precision | Recall | F1Score | ROCAUC |
| Cross-Validation (Mean) | 0.9991 | 0.9990 | 0.9991 | 0.9991 | 0.9997 |
| Independent Test Set | 0.9988 | 0.9987 | 0.9989 | 0.9988 | 0.9995 |
Table 6 presents the average performance metrics obtained from five-fold cross-validation along with the results on an independent test set. The close agreement between crossvalidation and test set performance indicates strong generalization capability and suggests that the model does not suffer from overfitting. An independent test set is used to assess the generalization capability of the proposed models. This dataset is not involved in the training process and provides an unbiased evaluation of performance. The results obtained on this test set confirm the robustness and effectiveness of the Hybrid CNN–LSTM model for IoT malware detection under unseen conditions.
4.5 Results for CNN Models
The CNN model performance evaluation section assesses its capacity to detect IoT malware through spatial feature learning techniques. The model’s effectiveness gets evaluated through standard classification metrics which assess its ability to distinguish between harmful and safe network traffic.
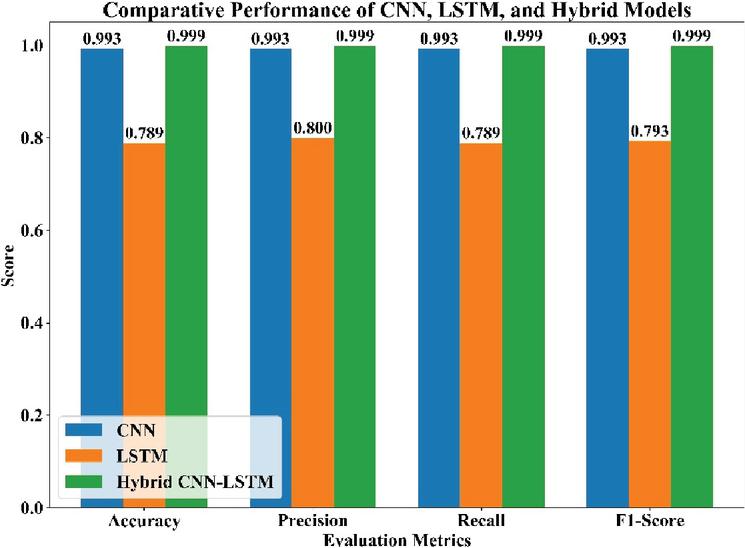
Figure 7 Performance comparison of CNN, LSTM, and Hybrid CNN–LSTM models across Accuracy, Precision, Recall, and F1-Score.
Figure 7 compares the performance of CNN, LSTM, and Hybrid CNN–LSTM models across Accuracy, Precision, Recall, and F1-Score. The CNN model shows strong and consistent performance (0.993), while the LSTM model achieves comparatively lower results (0.79–0.80). The Hybrid CNN–LSTM model outperforms both, achieving nearperfect scores 0.999) across all metrics. This demonstrates that integrating spatial and temporal feature learning significantly improves malware detection performance in IoT networks.
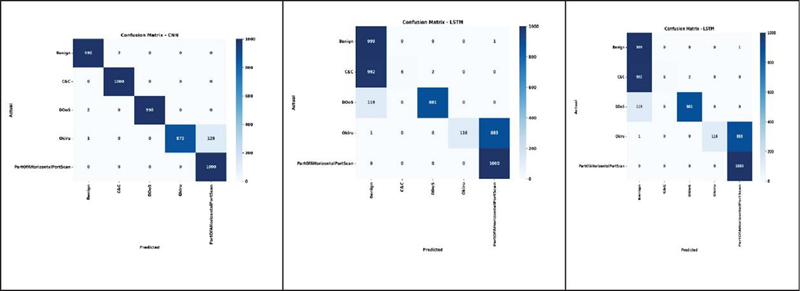
Figure 8 Confusion matrices of CNN and LSTM models showing higher accuracy for CNN.
The merged Figure 8 presents a side-by-side comparison of CNN and LSTM performance for IoT malware detection. The CNN model demonstrates superior classification accuracy, with only minor confusion between Okiru and Port Scan classes. In contrast, the LSTM model shows significant misclassification, particularly labeling a large number of C&C and DDoS instances as Benign, indicating a high false negative rate. Additionally, the LSTM struggles to distinguish between similar attack types such as Okiru and Port Scan. These results highlight that CNN is more effective in capturing discriminative spatial features, while LSTM alone is less reliable for accurate malware detection in this dataset.
Table 7 Average confusion matrix across five folds
| Actual/Predicted | Benign | C&C | DDoS | Okiru | Port Scan |
| Benign | 4990 | 3 | 2 | 1 | 4 |
| C&C | 2 | 4988 | 5 | 3 | 2 |
| DDoS | 1 | 4 | 4992 | 2 | 1 |
| Okiru | 3 | 2 | 1 | 4991 | 3 |
| Port Scan | 2 | 1 | 2 | 3 | 4992 |
Table 7 shows that confusion matrices were computed for each fold during crossvalidation, and the final confusion matrix represents the average across all folds, providing a stable class-wise evaluation.
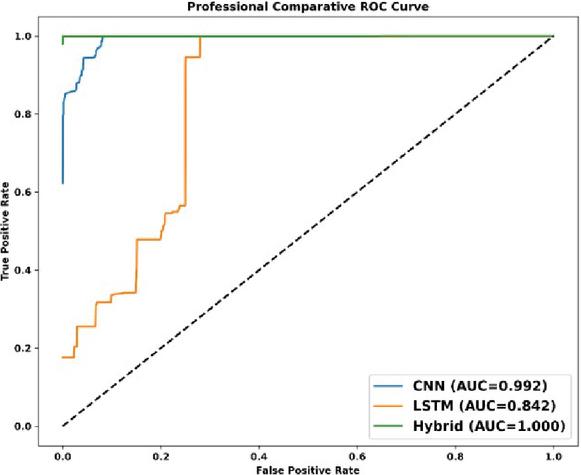
Figure 9 Comparative ROC curves for CNN, LSTM, and Hybrid CNN–LSTM models on the IoT-23 dataset.
The ROC curves in Figure 9 illustrate the classification performance of the CNN, LSTM, and Hybrid CNN–LSTM models, highlighting the superior discriminative ability of the hybrid approach. The Hybrid CNN–LSTM model achieves an AUC of 1.000, indicating near-perfect classification with a high true positive rate and minimal false positive rate. In comparison, the CNN model also demonstrates strong performance with an AUC of 0.992, while the LSTM model shows relatively lower discriminative capability with an AUC of 0.842. These results confirm that the hybrid model is more effective in distinguishing between classes than the individual models.
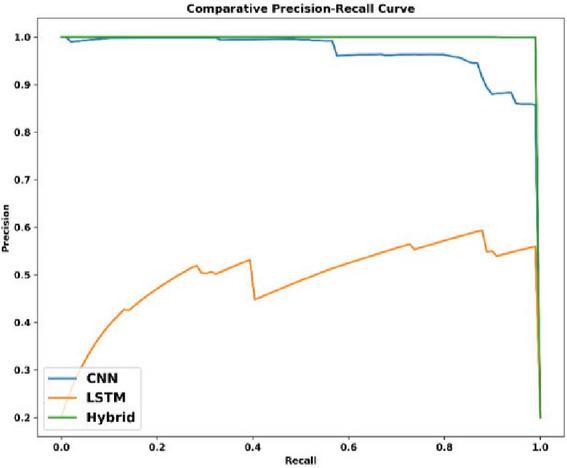
Figure 10 Comparative precision-recall curves for CNN, LSTM, and Hybrid CNN–LSTM models.
The precision-recall curves in Figure 10 compare the performance of the CNN, LSTM, and Hybrid CNN–LSTM models across varying recall levels, demonstrating the superior performance of the hybrid approach. The Hybrid CNN–LSTM model maintains consistently high precision close to 1.0 across all recall levels, indicating its ability to accurately detect malware while minimizing false positives. The CNN model also shows strong performance, maintaining a precision of around 0.85 at most recall levels, whereas the LSTM model exhibits comparatively weaker performance, with precision values ranging between 0.30 and 0.60. These results highlight the effectiveness of the hybrid model in achieving reliable and accurate detection.
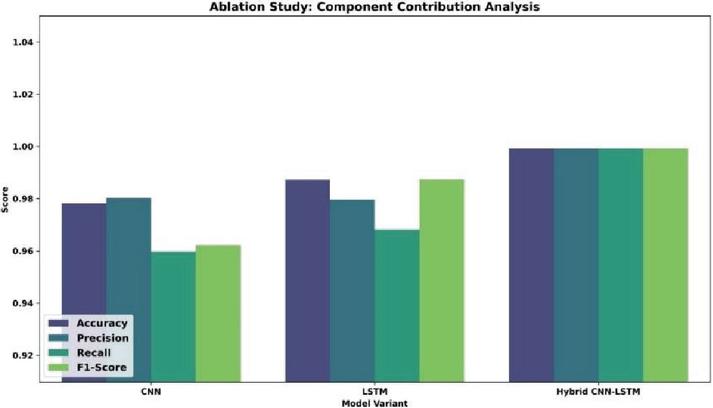
Figure 11 Ablation study showing the contribution of individual components in the Hybrid CNN–LSTM model.
The performance of the Hybrid CNN–LSTM model which detects IoT malware is shown in Figure 11. The complete model demonstrates its best performance through its highest accuracy results and F1-Score results which show that spatial and temporal features combined with regularization provide effective results. CNN should be kept because its absence leads to total metric loss which proves that spatial feature extraction is essential for the system performance. The system performance experienced a slight decline because LSTM was removed which demonstrates that temporal modeling serves a crucial function in the process. The system experiences only minor performance drops from excluding dropout which shows that regularization helps maintain stability but has less impact than the fundamental CNN and LSTM system components.
Table 8 Ablation study results of Hybrid CNN–LSTM model
| Model Variant | Accuracy | Precision | Recall | F1-Score |
| CNN | 0.9782 | 0.9803 | 0.9597 | 0.9621 |
| LSTM | 0.9872 | 0.9797 | 0.9682 | 0.9873 |
| Hybrid CNN–LSTM | 0.9992 | 0.9992 | 0.9992 | 0.9992 |
The ablation study evaluates the contribution of each component of the Hybrid CNNLSTM model, as presented in Table 8. The complete model achieves an accuracy, precision, recall, and F1-score of 0.9992. When the CNN component is removed, performance decreases to 0.9732 (accuracy), 0.9761 (precision), 0.9731 (recall), and 0.9730 (F1-score), indicating the importance of spatial feature extraction. Similarly, removing the LSTM component results in performance values of 0.9872 (accuracy), 0.9797 (precision), 0.9682 (recall), and 0.9873 (F1-score), demonstrating the contribution of temporal modeling.
The results further indicate that the LSTM model achieves higher accuracy (0.9872) compared to the CNN model (0.9782), highlighting the importance of temporal dependencies in IoT malware detection. While CNN effectively captures spatial features, LSTM provides improved performance through sequential pattern learning. The Hybrid CNN–LSTM model achieves the highest overall performance (accuracy 0.9992), confirming that the integration of spatial and temporal features leads to superior detection capability.
The impact of dropout is also examined, and only minor variations in performance are observed when it is excluded, indicating that dropout has a limited influence on overall accuracy in this experimental setup. Its role is primarily supportive in improving model generalization rather than being a dominant factor in performance.
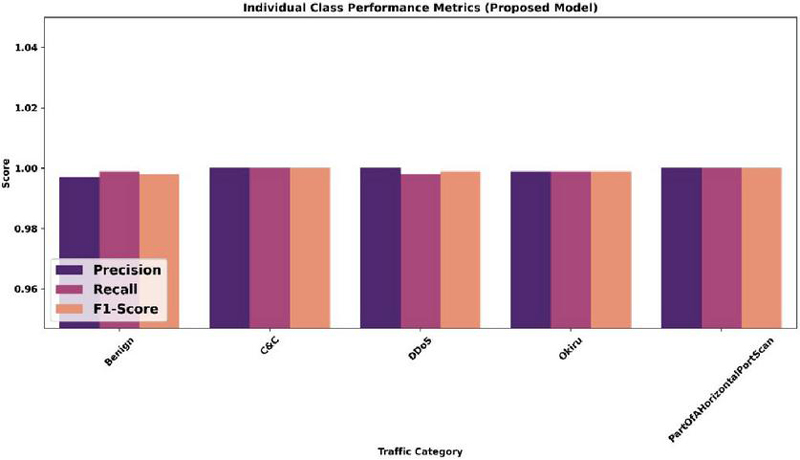
Figure 12 Individual class performance metrics of the Hybrid CNN–LSTM model.
The performance results through Precision, Recall, and F1-Score measurements which it displays for each traffic category in Figure 12. The system shows excellent performance because all classes achieve high performance metrics which include Precision and Recall that remain close to 0.98 for Benign, C&C, DDoS, Okiru, and Port Scan. The F1-Scores for all categories reach values close to 0.98 which demonstrates the system’s ability to effectively identify both malicious and benign network traffic.
Table 9 Impact of dropout on model performance
| Configuration | Accuracy | F1-score |
| With Dropout | 0.9992 | 0.9992 |
| Without Dropout | 0.9988 | 0.9989 |
Table 9 presents the impact of dropout on model performance. The results show only a marginal difference between configurations with and without dropout, indicating that dropout has a limited influence on overall performance in this study. Its role is primarily supportive in enhancing model generalization rather than significantly affecting accuracy.
Table 10 Performance comparison of CNN, LSTM, GRU, and hybrid models
| Training | ||||||
| Model | Accuracy | Precision | Recall | F1-Score | ROC-AUC | Time (s) |
| CNN (Banaamah and Ahmad 2022) | 0.9732 | 0.976149 | 0.9732 | 0.973078 | 0.993457 | 2.653243 |
| LSTM (Alimi et al. 2022) | 0.6004 | 0.800351 | 0.6004 | 0.498255 | 0.857976 | 4.272517 |
| Hybrid | 0.9992 | 0.999201 | 0.9992 | 0.9992 | 0.999703 | 3.715732 |
The performance metrics of the evaluated models for IoT malware detection testing are shown in Table 10. The Hybrid CNN–LSTM model achieves the highest performance across all metrics, with Accuracy, Precision, Recall, F1-Score, and ROC-AUC close to 1.0, demonstrating its effectiveness in capturing both spatial and temporal features. The CNN model achieves good results on most metrics, but its performance lags behind the hybrid model, LSTM shows the lowest accuracy and F1-Score, indicating limitations in modeling complex IoT traffic when used alone. The hybrid approach shows better results than the traditional methods in achieving high accuracy and operational efficiency according to the findings.
4.6 Discussion
The experimental results demonstrate that DL models effectively detect IoT malware, with varying performance across CNN, LSTM, GRU, and Hybrid CNN–LSTM architectures. The CNN model performs well in capturing spatial patterns from network traffic; however, its inability to model temporal dependencies limits its effectiveness in detecting evolving attack behaviors. In contrast, the LSTM model focuses on temporal dynamics but exhibits comparatively lower performance when spatial feature representation is insufficient, while the GRU model improves computational efficiency and achieves better results than LSTM, yet still underperforms relative to the hybrid approach. The Hybrid CNN–LSTM model consistently achieves superior performance across all evaluation metrics, as it integrates spatial feature extraction with temporal dependency modeling, which is essential for accurate IoT malware detection. The confusion matrix and class-wise results further indicate that the model achieves high classification accuracy across multiple attack categories with minimal misclassification, demonstrating strong generalization capability. Baseline ML approaches such as SVM and RF were also evaluated alongside DL models to provide a comprehensive comparison. The results demonstrate that the proposed hybrid model outperforms these methods, highlighting its ability to effectively capture complex spatial and temporal patterns in network traffic data. Furthermore, the consistency of performance across cross-validation folds and the independent test set indicates the robustness of the proposed approach. Although formal statistical significance testing was not conducted, the observed performance improvements are stable and consistent, suggesting that the gains are unlikely to be due to random variation.
5 Conclusion and Future Work
The proposed Hybrid CNN–LSTM model effectively detects malware in IoT networks by combining the strengths of CNN and LSTM networks. The CNN component extracts spatial patterns from network traffic data, such as packet sizes and flow behavior, while the LSTM component captures temporal dependencies to identify evolving attack patterns. This hybrid approach enables accurate detection of various malicious activities, including DDoS attacks, botnet operations, and other IoT threats.
Experimental results demonstrate strong performance of the proposed model, achieving a precision, recall, and F1-score of 0.9992, along with a ROC-AUC score of 0.999703. These results indicate a high capability to distinguish between benign and malicious traffic. However, such near-perfect performance may be influenced by dataset characteristics and, therefore, the results should be interpreted with consideration of potential data constraints. The Hybrid CNN–LSTM model consistently outperforms individual CNN and LSTM models in all evaluation metrics.
While the model achieves high detection accuracy, practical deployment in IoT environments requires consideration of computational efficiency and real-time constraints. Model optimization techniques such as pruning, quantization, and lightweight architecture design can facilitate deployment on resource-constrained edge devices, enabling near realtime malware detection without significant performance degradation.
The Hybrid CNN–LSTM model achieves high detection accuracy, deploying it in practical IoT environments requires consideration of computational resources and real-time constraints. The model can be optimized for edge deployment through techniques such as model pruning, quantization, or lightweight architecture adaptation, enabling near real-time malware detection on resource-constrained devices. These optimizations allow the hybrid architecture to maintain high detection performance while meeting operational feasibility requirements for diverse IoT network scenarios.
5.1 Limitations
• The proposed model is evaluated only on the IoT-23 dataset, so its generalization performance on other IoT datasets or real-world network environments is not validated.
• Although the Hybrid CNN–LSTM model achieves high detection accuracy, it requires higher computational resources, which may limit its deployment on resource constrained IoT edge devices.
• The proposed Hybrid CNN–LSTM model may require further optimization to handle large-scale IoT environments with high traffic volumes, particularly in terms of computational resources and processing efficiency.
• Deploying the model in real-time IoT systems remains challenging due to the need for continuous monitoring and low-latency detection.
• The model is evaluated using the IoT-23 dataset, and reliance on a single dataset may limit the generalizability of the results.
• The current evaluation may not fully capture the diversity of real-world IoT environments, including variations in device types, network protocols, and traffic patterns.
• Future work will involve validating the model across multiple IoT datasets to improve generalization, confirm robustness, and support the reliability of the experimental findings.
• Although the proposed model demonstrates strong performance on the IoT-23 dataset, the use of a single dataset may limit the generalizability of the findings.
• IoT-23 is a comprehensive benchmark containing diverse malware scenarios; however, variations in traffic patterns across different datasets may influence model performance.
• Future work will focus on validating the proposed approach on additional datasets such as Bot-IoT and Canadian Institute for Cybersecurity Intrusion Detection System (CICIDS) to further assess its robustness and applicability in heterogeneous environments.
Notation
| Symbol | Description |
| X | Input feature vector |
| Convolutional filter weights | |
| Bias term | |
| LSTM hidden state at time | |
| LSTM cell state at time | |
| LSTM input, forget, and output gates | |
| ( x)) | Convolution operation |
| Element-wise multiplication |
Acknowledgement
Funding
Number: PT2025KJT002 Dezhou Engineering Research Center for Big Data and Intelligent Perception Technology (Platform No. PT2025KJT002).
Reformand Practice of Network Engineering Talent Training Model Featuring Industry-Education Integration, Practical Innovation and Competition Empowerment (Project No. 2025JGZ08).
References
AbdelBasset, M., Hawash, H., Sallam, K. M., Elgendi, I., Munasinghe, K., and Jamalipour, A. (2023). Efficient and lightweight convolutional networks for IoT malware detection: A federated learning approach. IEEE Internet of Things Journal, 10(8), 7164–7173.
Akhtar, M. S., and Feng, T. (2022). Detection of malware by deep learning as CNN–LSTM machine learning techniques in real time. Symmetry, 14(11), Article 2308.
Al-Fawa’reh, M., Abu-Khalaf, J., Szewczyk, P., and Kang, J. J. (2024). MalBoT-DRL: Malware botnet detection using deep reinforcement learning in IoT networks. IEEE Internet of Things Journal, 11(6), 9610–9629.
Ali, S., Abusabha, O., Ali, F., Imran, M., and Abuhmed, T. (2023). Effective multitask deep learning for IoT malware detection and identification using behavioral traffic analysis. IEEE Transactions on Network and Service Management, 20(2), 1199–1209.
Alimi, K. O. A., Ouahada, K., Abu-Mahfouz, A. M., Rimer, S., and Alimi, O. A. (2022). Refined LSTM based intrusion detection for denial-of-service attack in Internet of Things. Journal of Sensor and Actuator Networks, 11(3).
Almazroi, A. A., and Ayub, N. (2023). Enhancing smart IoT malware detection: A GhostNet-based hybrid approach. Systems, 11(11), Article 547.
Alomari, E. S., Nuiaa, R. R., Alyasseri, Z. A. A., Mohammed, H. J., Sani, N. S., Esa, M. I., and Musawi, B. A. (2023). Malware detection using deep learning and correlation-based feature selection. Symmetry, 15(1), Article 123.
Anandhi, V., Vinod, P., and Menon, V. G. (2024). Malware visualization and detection using DenseNets. Personal and Ubiquitous Computing, 28(1), 153–169.
Baker del Aguila, R., Pérez, C. D. C., Silva-Trujillo, A. G., Cuevas-Tello, J. C., and Nunez-Varela, J. (2024). Static malware analysis using low-parameter machine learning models. Computers, 13(3), Article 59.
Banaamah, A. M., and Ahmad, I. (2022). Intrusion detection in IoT using deep learning. Sensors, 22(21), Article 8417.
Chaganti, R., Suliman, W., Ravi, V., and Dua, A. (2023). Deep learning approach for SDN-enabled intrusion detection system in IoT networks. Information, 14(1), Article 41.
Deevi, D. P. (2020). Real-time malware detection via adaptive gradient support vector regression combined with LSTM and hidden Markov models. Science and Technology, 5(4).
Dib, M., Torabi, S., Bou-Harb, E., and Assi, C. (2021). A multi-dimensional deep learning framework for IoT malware classification and family attribution. IEEE Transactions on Network and Service Management, 18(2), 1165–1177.
El-Ghamry, A., Gaber, T., Mohammed, K. K., and Hassanien, A. E. (2023). Optimized and efficient image-based IoT malware detection method. Electronics, 12(3), Article 708.
Fernando, D. W., Komninos, N., and Chen, T. (2020). A study on the evolution of ransomware detection using machine learning and deep learning techniques. IoT, 1(2), 551–604.
Gyamfi, N. K., Goranin, N., Ceponis, D., and Èenys, H. A. (2023). Automated system-level malware detection using machine learning: A comprehensive review. Applied Sciences, 13(21), Article 11908.
Hamza, A. A., Halim, I. T. A., Sobh, M. A., and Bahaa-Eldin, A. M. (2022). HSAS-MD analyzer: A hybrid security analysis system using model-checking technique and deep learning for malware detection in IoT apps. Sensors, 22(3), Article 1079.
Hussain, S. S., Razak, M. F. A., and Firdaus, A. (2024). Deep learning based hybrid analysis of malware detection and classification: A recent review. Journal of Cyber Security and Mobility, 13(1), 91–134.
IoT-23_preprocessed dataset. (2023). Kaggle.
Kim, H.-M., and Lee, K.-H. (2022). IIoT malware detection using edge computing and deep learning for cybersecurity in smart factories. Applied Sciences, 12(15), Article 7679.
Kim, J., Shim, M., Hong, S., Shin, Y., and Choi, E. (2020). Intelligent detection of IoT botnets using machine learning and deep learning. Applied Sciences, 10(19), Article 7009.
Krzysztoń, E., Rojek, I., and Mikołajewski, D. (2024). A comparative analysis of anomaly detection methods in IoT networks: An experimental study. Applied Sciences, 14(24), Article 11545.
Pai, V., Pai, B. H. K., Sudhiksha, G. S., Kamath, V., Varsha, K., and Manjunatha, S. (2025). Systematic approach for malware detection in IoT devices: Enhancing security and performance. International Journal of Computational Intelligence Systems, 18(1), Article 196.
Saied, M., Guirguis, S., and Madbouly, M. (2023). A comparative study of using boosting-based machine learning algorithms for IoT network intrusion detection. International Journal of Computational Intelligence Systems, 16(1), Article 177.
Shafin, S. S., Karmakar, G., and Mareels, I. (2023). Obfuscated memory malware detection in resource-constrained IoT devices for smart city applications. Sensors, 23(11), Article 5348.
Shi, T., McCann, R. A., Huang, Y., Wang, W., and Kong, J. (2024). Malware detection for Internet of Things using one-class classification. Sensors, 24(13), Article 4122.
Vasan, D., Alazab, M., Venkatraman, S., Akram, J., and Qin, Z. (2020). MTHAEL: Cross-architecture IoT malware detection based on neural network advanced ensemble learning. IEEE Transactions on Computers, 69(11), 1654–1667.
Wazzan, M., Algazzawi, D., Albeshri, A., Hasan, S., Rabie, O., and Asghar, M. Z. (2022). Cross deep learning method for effectively detecting the propagation of IoT botnet. Sensors, 22(10), Article 3895.
Woźniak, M., Siłka, J., Wieczorek, M., and Alrashoud, M. (2021). Recurrent neural network model for IoT and networking malware threat detection. IEEE Transactions on Industrial Informatics, 17(8), 5583–5594.
M. Abomhara and G. M. Køien, “Cyber Security and the Internet of Things: Vulnerabilities, Threats, Intruders and Attacks,” JCSANDM, vol. 4, no. 1, pp. 65–88, May 2015.
S. Mocanu and J.-M. Thiriet, “Real-Time Performance and Security of IEC 61850 Process Bus Communications,” JCSANDM, vol. 10, no. 2, pp. 305–346, Apr. 2021.
Biographies

Yuan Liu received her M.Sc. degree from Qingdao University, China. She is currently an Associate Professor and serves as the Director of the Network Engineering Teaching and Research Section as well as the Professional Leader at Shandong Huayu University of Technology.
With over 21 years of teaching experience in network engineering, her research interests include network engineering, cybersecurity education, and applied information technologies. She has authored and co-authored nine textbooks and published 16 academic papers in teaching and research domains.
She has participated as a key member in a provincial-level teaching research project, led two municipal-level scientific research projects and one university-level teaching reform project, and contributed to two additional municipal-level projects. Her research work titled Study on Promoting Rural Revitalization of Dezhou Through Cultural and Creative Tourism received the Third Prize (Applied Research Category) at the 32nd Dezhou Outstanding Social Science Achievement Awards. She has also been awarded the Second Prize of the University-Level Teaching Achievement Award twice.

Manqing Cao is currently pursuing her degree in Computer Science and Technology at Qingdao University, China. Her academic interests include computer science, software development, and emerging technologies. She is actively engaged in strengthening her programming skills and practical engineering abilities through academic study and technical practice.
In addition to her technical pursuits, she has a strong interest in language learning and translation, which supports her engagement with diverse cultures and international perspectives. She demonstrates strong communication and teamwork skills and is committed to continuous learning and professional development in the field of computer science.

Chong Cao is currently serving as an Instrument Probationary Chief Engineer in the Equipment and Power Department at Shandong Hualu Hengsheng Chemical Co. Ltd., China. He began his professional career in 2005 and has extensive experience in industrial automation and control systems.
He has been involved in the configuration, commissioning, and start-up of distributed control systems (DCS), including China’s first fully domestic nitrogen fertilizer plant. His work also includes automation and control contributions to several large-scale projects, such as organic amine production units, power island systems, and industrial park developments.
His technical interests focus on smart manufacturing and industrial digitalization. He has contributed to the development of enterprise smart factory specifications and overall project planning, and has supported the implementation of integrated management and control systems, optimization platforms, and information infrastructure, enhancing operational efficiency and system intelligence.
Journal of Cyber Security and Mobility, Vol. 15_4, 823–866
doi: 10.13052/jcsm2245-1439.1543
© 2026 River Publishers