A Deep Semantic Confusion Vulnerability Detection Method Based on Tensor Recurrent Matrices and Gated Graph Convolutional Neural Networks
Yao Hu*, Shihua Wen, Huipeng Wang, Jie Yang and Lingjian Chen
Guangzhou Power Supply Bureau of Guangdong Power Grid Co. Ltd., Guangzhou 510000, Guangdong, China
E-mail: YaoHu2612@outlook.com
*Corresponding Author
Received 16 March 2026; Accepted 14 May 2026
Abstract
Under the normalized network security situation of artificial intelligence-assisted attacks, deep semantic obfuscation has become the core means of vulnerability hiding. Attackers evade detection by legitimizing semantic associations and obfuscating code logic, posing serious threats to infrastructure and software supply chain security. Therefore, to enhance the robustness and accuracy of vulnerability detection under deep semantic obfuscation scenarios, the research proposes a vulnerability detection method based on tensor circulant matrix. The method preserves code semantic integrity and local correlations based on tensor circulant matrix. On this basis, it combines Gated Graph Convolutional Neural Networks (GGCNN) to improve the model’s feature capture capability for hidden vulnerabilities. On obfuscated vulnerability datasets, the average detection accuracy for obfuscated vulnerabilities reaches 96.24%, precision reaches 83.62%, recall reaches 87.53%, and F1 score reaches 85.54%. Compared with the Long Short-Term Memory Network (LSTM) baseline model, the False Negative Rate (FNR) has decreased by 16.73%, demonstrating significantly improved robustness under semantic obfuscation scenarios. The vulnerability detection model constructed in this study can effectively resist semantic obfuscation interference, provides a reliable technical approach for deep semantic obfuscation vulnerability detection, and has important practical significance for strengthening code security protection.
Keywords: Network security, vulnerability detection, tensor matrix, gated graph convolutional neural networks (GGCNN).
1 Introduction
1.1 Research Background
In the network security situation where artificial intelligence-assisted attacks are normalized, deep semantic camouflage has become a core technical means for hiding vulnerabilities [1]. Attackers construct highly concealed malicious code variants by legitimizing code semantic associations, confusing program control flow and logical structures, and effectively evading detection systems based on traditional feature matching and static rules. Such advanced persistent threats pose serious challenges to the security of critical information infrastructure and global software supply chains [2, 3]. Deep semantic confusion differs from traditional obfuscation methods that only change the local structure of the code. Its core lies in systematically disrupting the statistical characteristics and structural patterns of the code while maintaining the functional equivalence of the program through control flow flattening, opaque predicate insertion, and semantic equivalence transformation. This makes the obfuscated code exhibit a highly similar semantic relationship pattern to the legitimate code, thereby avoiding detection based on static rules. Therefore, breaking through the limitations of existing detection technology on semantic confusion and building a robust detection model that can penetrate surface camouflage and accurately identify deep vulnerabilities has become an urgent need to improve active defense capabilities and ensure code security.
1.2 Current Research Status
Current software vulnerability detection research has evolved from rule-based pattern matching to the intelligent detection stage based on machine learning. Traditional static analysis tools rely on predefined vulnerability patterns, and the false positive rate and False Negative Rate (FNR) increase significantly when dealing with semantic confusion. In recent years, deep learning-based methods, especially techniques that utilize graph neural networks to process code structure representation, have made significant progress in the field of vulnerability detection. For example, to cope with the network security challenges brought by the popularization of IoT devices, Xu et al. addressed the issue that the security strength of software obfuscation technology was unclear and became more difficult to evaluate as software diversified. They proposed a hierarchical obfuscation method based on the hierarchical security concept, achieving a systematic review of existing obfuscation technologies and establishing an orthogonal branch classification method. This method helps developers select obfuscation technologies according to specific needs and design reliable hierarchical obfuscation schemes [4]. To solve the insufficient detection accuracy caused by existing program vulnerability detection methods that ignore the complementarity of multi-dimensional feature spaces, Xiao et al. implemented a vulnerability detection method based on enhanced graph structure representation learning. It integrated the context graph and program dependency graph, integrated Abstract Syntax Tree (AST) and paragraph embedding features, and combined gated graph neural network and attention mechanism to improve feature learning capabilities. The results showed that the F1 score on open source datasets was 6% higher than that of the existing technology, significantly optimizing the vulnerability detection performance [5]. To improve the quality and compliance of code generated by large language models and avoid defects and violations in pre-training data, Jahanshahi et al. implemented automated data screening technology based on open source software version history. In the “The Stack” v2 dataset, 17% of code versions have updates, 17% of which contain vulnerability fixes, and 2.36% fix known Common Vulnerabilities and Exposures (CVE) vulnerabilities. A total of 58% of the code has not been modified, may lack actual use value, and poses license compliance risks [6]. To deal with the infringement of sensitive information and key assets of organizations by insider threats, Cheng et al. addressed the issue that the vulnerabilities in modern software systems are diverse and lack clear norms, and traditional static detection methods are difficult to handle them precisely and efficiently. They proposed the DeepWukong method based on deep learning, achieving better results than four traditional static detectors and three cutting-edge deep learning methods on 105,428 real programs. This method has the potential and effect of integrating program analysis with deep learning to solve the challenges of general static code analysis [7]. For the challenges of dealing with obfuscation techniques, high precision and computational efficiency in the detection of Android malware, Bakr proposed the TuneDroid method. The accuracy rate of the validation set was 99.44% and that of the test set was 98.00%, which was significantly better than the result of the static end-to-end model without hyperparameter optimization (91.17%). This method has the effect of improving detection accuracy, enhancing robustness against obfuscation, and demonstrating the importance of dynamic optimization [8].
However, most existing methods have shortcomings in high-dimensional, heterogeneous code semantic fusion and deep correlation modeling. When the code is obfuscated by a carefully designed semantic layer, its detection performance often declines significantly. Especially when dealing with hidden vulnerabilities with complex multi-dimensional semantic associations and structural variations, the feature capture capabilities and robustness of existing models still need to be improved.
1.3 Motivation and Methods
To improve the feature capture capabilities of existing models and improve the detection accuracy and robustness in deep semantic camouflage scenarios, the research innovatively proposes a fusion detection model based on tensor circulant matrix and gated graph convolutional neural network. Our research motivation follows. Firstly, a code representation method is constructed that is able to maintain the original semantic integrity of the code and explicitly model its multidimensional local correlations. Secondly, a network architecture that can perform efficient feature learning based on this representation and adaptively fuse multi-dimensional semantic information is designed. To this end, the research method first constructs a tensor circulant matrix to uniformly represent the high-dimensional structure and semantic associations of the code, retaining complete contextual information of syntax, control flow, and data dependencies. A gated graph convolutional neural network is introduced to enhance the model’s ability to extract discriminative features from complex obfuscated code through its gating mechanism and multi-level propagation aggregation strategy, ultimately precisely locating and classifying deep hidden vulnerabilities. In summary, this study focuses on the vulnerability detection problem in scenarios of deep semantic confusion and proposes and validates a robust detection model based on tensor recurrent matrices and GGCNN.
1.4 Article Structure
The organization structure of the research part is as follows. First, the code feature extraction algorithm based on tensor circulant matrix is introduced in detail, as well as the overall architecture and key technologies of the vulnerability detection model that integrates GGCNN. Secondly, the system analyzes the performance on the deep semantic camouflage vulnerability dataset, verifying the effectiveness of the code feature extraction algorithm, as well as comparative experimental results between the proposed method and various mainstream benchmark models. Finally, the full text work is summarized, the main contributions are summarized, and the limitations of the current work and possible future research directions are pointed out.
2 Design of Vulnerability Detection Model based on Tensor Circulant Matrix
2.1 Construction of Code Feature Extraction Algorithm Based on Tensor Circulant Matrix
To better detect and analyze the tensor structure code and vulnerability characteristics, this study uses the tensor code feature representation structure to define and analyze the data of the tensor code. Tensor codes usually have complex data structures and data correlation impressions, clustered with higher-dimensional structural operations and designs. Therefore, to enhance this correlation, the high-order tensor code is used for tensor visualization. Equation (1) is a high-order tensor expression [9, 10]:
| (1) |
where represents a high-order tensor, represents the elements in the tensor, where all elements are real numbers, represents the size of the tensor in dimension , which is the dimension length of the tensor. The main display form of the tensor matrix is a circulant matrix, as shown in Equation (2):
| (2) |
In Equation (2), the matrix is sliced in multiple dimensions to obtain a three-dimensional tensor slice, where represents the tensor cyclic operation and represents the -th slice in the third dimension. Based on the existing tensor decomposition and cyclic matrix theory, the proposed tensor cyclic matrix representation method maps the AST, control flow graph, and data dependency graph of the code into the three dimensions of the tensor. Within each dimension, the local cyclic dependencies and periodic associations of code elements are encoded through the cyclic shift operations of the cyclic matrix, thereby explicitly modeling multi-dimensional context information while preserving the complete semantic structure. The subsequent slice propagation and aggregation are implemented based on this cyclic structure for cross-dimensional information interaction. The theoretical basis lies in the fact that the convolution equivalence of the cyclic matrix can effectively capture the repeated logical fragments and loop body characteristics in the code. The matrix product of the tensor matrix is shown in Equation (3) [11, 12]:
| (3) |
where represent the three indexes of the matrix, represents the row index of the matrix. The tensor product of the matrix is shown in Equation (4) [13]:
| (4) |
where represents matrixization, represents tensor. During the matrix analysis process, since the parameter calling process of the matrix will be parsed into a specific instruction sequence, the final form of the tensor matrix vulnerability will be directly denied. Therefore, the state vulnerabilities caused by the abnormal execution path of the matrix operation code are detected and analyzed. Therefore, the research uses dynamic computing and Long Short-Term Memory Network (LSTM) for tensor feature analysis. Figure 1 shows the tensor feature analysis framework structure.
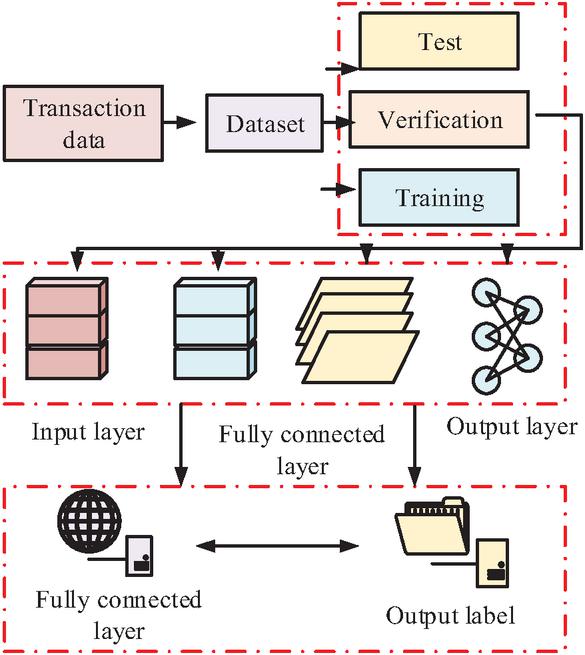
Figure 1 Tensor feature analysis framework structure.
From Figure 1, the tensor matrix feature analysis process will first obtain block transaction data from the Ethereum main chain, and generate an opcode sequence dataset containing vulnerability characteristics through instrumentation and replay technology. Then, the dataset will be divided into a training set, a verification set, and a test set. In the model processing stage, the data is converted into dense vectors through the embedding layer in sequence, and is input into the LSTM layer to capture temporal dependencies. Then, the features are integrated through the fully connected layer. The classification probability is finally output through the Softmax function. The loss value is calculated by comparing the predicted category with the real label, thereby automatically classifying and detecting vulnerability opcode sequences. In the process of analyzing the matrix parameters, the matrix parameters are trained and verified through the structure and parameters of the neural network. Figure 2 presents the structure parameter structure.
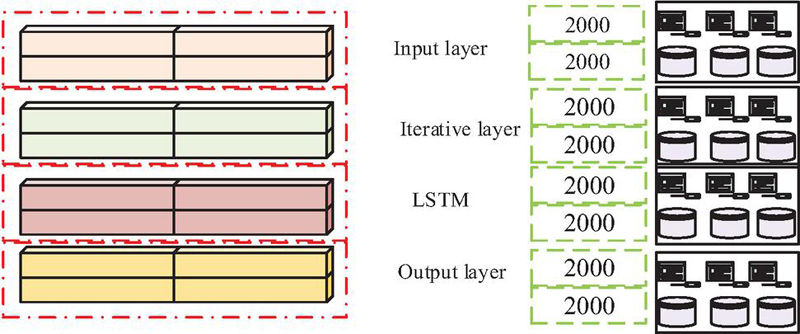
Figure 2 Algorithm neural network structure parameter structure.
From Figure 2, the network structure adopts a sequence processing architecture in the neural network structure. After the input layer receives the sequence data with a length of 2000, each discrete element is mapped into a 32-dimensional dense vector through the embedding layer, forming a 2000 32 time series feature representation. The LSTM layer then encodes the sequence, extracts temporal dependence features and outputs a 100-dimensional global feature vector. Finally, the features are mapped to the 7-dimensional space through the fully connected layer to output the multi-classification task. Finally, to realize the characteristic analysis of the tensor matrix, a tensor matrix code diagram is built. Figure 3 shows the tensor matrix code diagram.
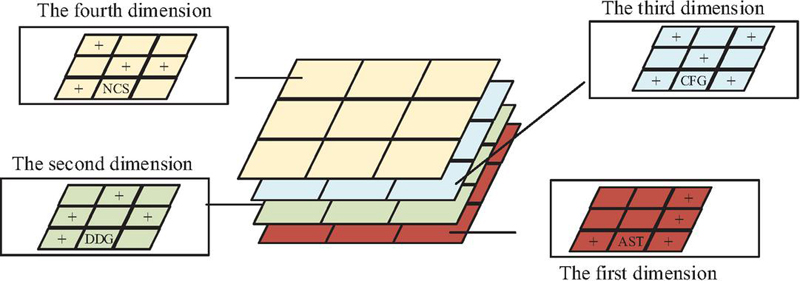
Figure 3 Tensor matrix code diagram.
Figure 3 shows three different matrix diagrams of the tensor feature map, in which the three dimensions correspond to the source node, the target node of the adjacency relationship, and the hierarchical stacking of the feature map. This structure can ensure the effective isolation between various semantic levels on the basis of maintaining the complete connection of the multi-dimensional semantic context of the code, and rely on the interactive calculation between dimensions to promote the information transmission and integration between code nodes. Slicing in the first dimension can propagate feature graph node information, while the second dimension can aggregate node hidden information. The third dimension enables information dissemination of matrix codes. Through its three-dimensional slicing operation, the three-dimensional tensor realizes two-way propagation between graphs and intra-graph propagation respectively, thereby integrating multi-dimensional code feature node information.
2.2 The Vulnerability Detection Model combining Feature Extraction Algorithm and GGCNN
After constructing the tensor matrix code, to analyze the source code feature detection effect in multi-dimensional semantic fusion, a new source code vulnerability detection model is proposed. The new model framework uses Graph Tensor Convolutional Network (GTCN), which can improve the detection effect of vulnerabilities through multi-dimensional code semantic fusion. Figure 4 shows the model structure.
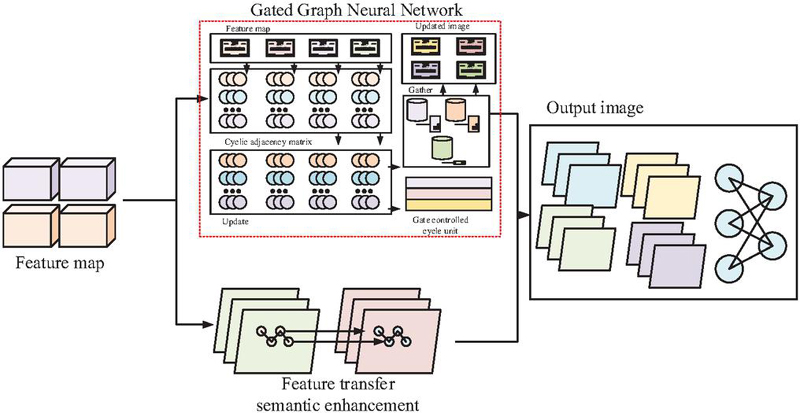
Figure 4 Vulnerability detection model.
From Figure 4, the tensor vulnerability detection model includes two path frames. The vulnerability detection model uses adjacency tensors to define multi-dimensional structural relationships between code nodes, and initializes semantic features with node embeddings. One of the structural frameworks performs multiple rounds of information propagation on the graph through a gated graph neural network, integrating node states with global structural context. The structure-aware features and heterogeneous semantic features are fused and enhanced, then the local patterns are extracted through the convolution layer. The second structural framework is aggregated through graph pooling and input into the classifier to accurately determine the existence and type of vulnerabilities. Based on the two framework structures, the tensor matrix vulnerability detection results are finally output. TensorGCN independently performs graph convolution operations on the feature matrices of each dimension of the tensor, allowing the network to effectively integrate and encode the multi-source heterogeneous semantic information contained in high-order graph tensors. Equation (5) displays the network propagation [14, 15]:
| (5) |
where represents the hidden node feature tensor in the layer, represents the feature tensor propagation process, represents the intermediate state obtained after propagation within the graph. The update equation of the feature map in the vulnerability detection model is shown in Equation (6) [16, 17]:
| (6) |
where represents the updated feature matrix of the -th graph node, signifies the normalized symmetric adjacency matrix of the -th graph, signifies the node feature matrix of the -th graph in the layer, represents the graph content propagation weight matrix in the layer. To improve the accurate detection effect of high-dimensional code semantic association after the model update is propagated, a new multi-dimensional semantic embedding model is proposed. Figure 5 shows the introduced gated graph neural network.
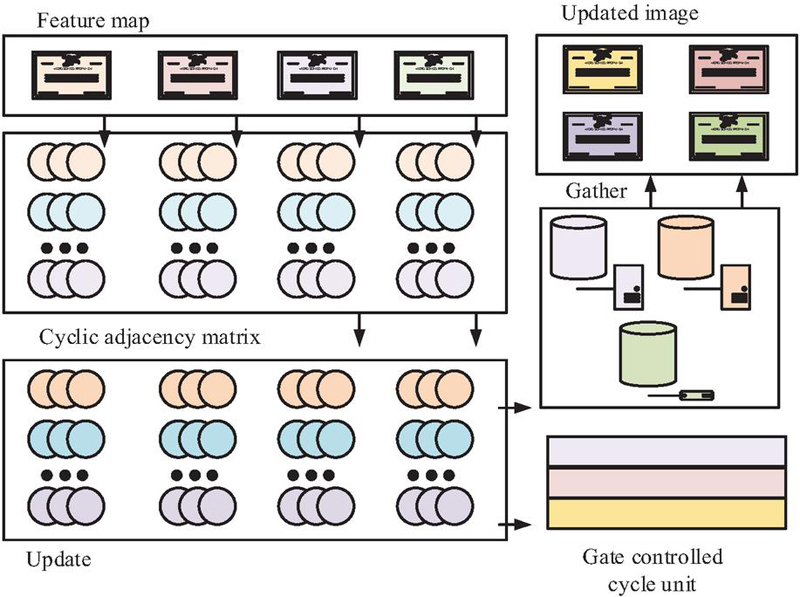
Figure 5 Gated graph neural network.
From Figure 5, after inputting a multi-code graph, the cyclic gated graph neural network line updates and slices different graphs through different cyclic adjacency matrices. Then, a set of nodes with different characteristics is obtained. The node set constructs a cyclic code graph through gated cyclic units. All loop code graphs are then aggregated, and the aggregated code graph is finally output. The main function of the gated graph neural network is to aggregate and update the feature code graph to transfer it from a node in the graph to another node. The information propagation process through the neural network is shown in Equation (7):
| (7) |
where , , and all represent the structural hidden state vector of a certain graph, represents zero-padding the initial eigenvector into a vector of length . The matrix operation equation adapted to the high-dimensional semantic embedding model is shown in Equation (8):
| (8) |
where represents the intermediate vector of node aggregated in step , represents the edge type matrix related to node , signifies the hidden state of a neighbor node of node in step , represents the bias term. The node propagation aggregation information update is shown in Equation (9) [18, 19]:
| (9) |
where represents updated gate, and represent weight matrices. The reset equation is shown in Equation (10):
| (10) |
where represents the reset gate. The hidden state of the model is shown in Equation (11) [20]:
| (11) |
where represents the hidden state of node at time step . The gated recurrent neural network achieves multi-view semantic fusion by performing cyclic iterative gate updates and cross-graph average aggregation on the hidden states of the same code node in four graph structures. To clearly illustrate the collaborative working mode of the two frameworks in Figure 4 and the specific process of the tensor recurrent matrix input gated convolutional network, the pseudo-code as shown in Algorithm 1.
| Algorithm 1: Tensor Circulant Matrix Enhanced GGCNN for Vulnerability Detection |
| Input: Code tensor , initial node feature matrix |
| Output: Vulnerability class label y |
| // Step 1: Construct adjacency tensor using circulant structure (Eq. (2)) |
| For each slice i = 1 to I3: |
| A_slice_i = circ(slice_i of X ) // each slice becomes a circulant matrix |
| End |
| Assemble A as a 3D tensor stacking A_slice_i // A |
| Normalize each slice: A_hat // Eq. (5) |
| // Step 2: Multi-dimensional propagation across K slices (K I3) |
| Initialize list H_slices = [] |
| For each slice to K: |
| // initial node features for slice k |
| For to T: // T propagation steps |
| // Message aggregation from neighbors (Eq. (8)) |
| For each node v in V: |
| a_v∧{(t)} = (A_hat_slice_k)_v |
| End |
| // Update gate (Eq. (9)) |
| For each node v: |
| End |
| // Reset gate (Eq. (10)) |
| For each node v: |
| End |
| // Candidate hidden state (Eq. (11)) |
| For each node v: |
| h_tilde_v |
| End |
| // Final hidden state (Eq. (12)) |
| For each node v: |
| End |
| End |
| Append H_k∧{(T)} to H_slices // store final node features of slice k |
| End |
| // Step 3: Cross-slice fusion |
| H_fused = Average( H_slices ) // element-wise mean across K slices |
| // Step 4: Right branch – convolution and pooling |
| C = Conv1D( H_fused, kernel_size=3, activation=’relu’ ) |
| P = GlobalMaxPooling1D ( C ) |
| // Step 5: Classification |
| Z FullyConnected( P, units=128, activation=’relu’) |
| y_hat Softmax( FullyConnected( Z, units=C ) ) |
| y argmax( y_hat ) |
| Return y |
This pseudo-code provides a detailed description of the entire process of constructing the normalized adjacency tensor from the tensor loop matrix, the gated update at each slice and node level in the graph neural network, the cross-slice averaging aggregation, the convolutional pooling, and the final classification.
3 Performance Analysis of Vulnerability Detection Model under Deep Semantic Obfuscation
3.1 Performance of Code Feature Extraction Algorithm
To analyze the performance of the code extraction algorithm using dynamic computing and LSTM, the study uses a multi-source integrated C/C++ vulnerability detection dataset. The dataset system integrates code from multiple authoritative sources, including official examples in the NVD and SARD vulnerability databases, historical vulnerability fix patches on GitHub, and functions extracted from nine widely used open source software, including Linux Kernel, QEMU, and FFmpeg. All samples have undergone static analysis and manual review, and are accurately marked as “safe” or “vulnerable”, and the corresponding CWE-ID vulnerability types are identified for vulnerable samples. The final dataset contains a total of 158,259 samples, covering 13 types of common vulnerabilities, and has been divided into a training set, a verification set, and a test set. The original vulnerability code does not contain any obfuscation. The research employed automated tools to uniformly perform deep semantic obfuscation on security and vulnerability samples. The specific methods included control flow flattening, insertion of opaque predicates, and semantic equivalence transformation. The generated obfuscated dataset was used to evaluate the model’s performance in adversarial scenarios. The computing core uses the Intel Xeon Gold 6234 model central processor and is paired with the Nvidia Quadro RTX5000 professional graphics processor for accelerated computing. The system memory is 128 GB and is equipped with 8 TB of hard drive storage space. The system runs on Linux operating system. The software stack mainly includes the Python programming language, program analysis tool Joern, PyTorch deep learning framework, Keras advanced neural network API, as well as the Pandas library and Gensim natural language processing library for data processing. The study compared the extraction accuracy and recall rate of the current code extraction algorithms, including AST, Control Flow Graph (CFG) and Code Property Graph (CPG), as shown in Figure 6.
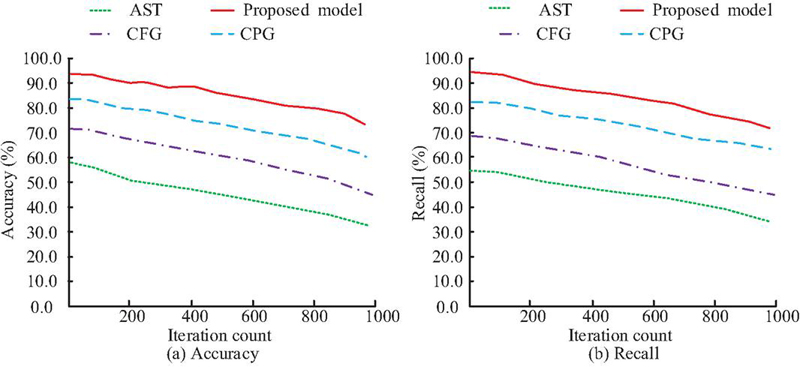
Figure 6 Performance comparison of different extraction algorithms.
From Figure 6(a), the proposed method had the highest extraction accuracy of 92.8%. The AST algorithm had the lowest extraction accuracy of only 58.6%, which was about 34.2% lower than that of the proposed method. The accuracy of the code extraction algorithm has been significantly improved, which may be due to the dynamic calculations. From Figure 6(b), the highest extraction recall rate of the proposed method could reach 94.1%. The highest extraction recall rate of AST was only 53.8%, which was 40.3% lower than that of the proposed method. The study compared the matrix effect when processing a tensor code with a length of 2000, as shown in Figure 7.
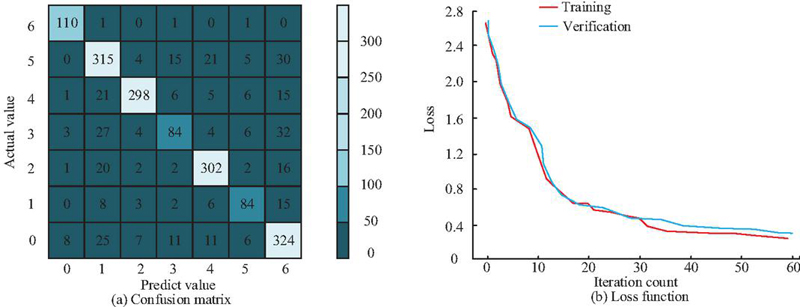
Figure 7 Algorithm processing effect test.
From Figure 7(a), in the heat map of the classification matrix, the chromaticity difference of the main diagonal cells did not directly reflect the model’s ability to identify various types of vulnerabilities, but was due to the uneven distribution of the number of samples of different vulnerability types. Taking category zero and category one as an example, the performance of the former was higher than that of the latter, but the amount of data in category zero was smaller, resulting in a darker tone on the main diagonal of the heat map. Combining the average accuracy rate (92.8%) and recall rate (94.1%) reported in the classification report, the deep learning model constructed by the dynamic LSTM achieved high performance in all categories, demonstrating its excellent code extraction capability. From Figure 7(b), when the model processed the training set and verification set with a sequence length of 2000, the error curves obtained gradually decreased with iteration, and the final training set error dropped to 0.38, and the verification set error stabilized at 0.43. The trends of the two curves were consistent and the training set error was always slightly lower, showing ideal model generalization characteristics. The algorithm has better code extraction capabilities when facing new data. The study compared the code extraction capabilities, as presented in Table 1.
Table 1 Comparison of extraction performance of different algorithm codes
| Method/Metric | Processing Speed (sec/KLoc) | Avg. Extraction Time Per Function (ms) | Peak Memory (MB/KLoc) | CPU Utilization (%) | GPU Utilization (%) | Max Project Scale Supported (KLoc) | Success Rate on Real-World Code (%) |
| AST | 1.2 | 15 | 85 | 65 | / | 500 | 94.2 |
| CFG | 3.5 | 42 | 120 | 80 | / | 300 | 88.5 |
| CPG | 8 | 110 | 320 | 95 | 30 | 1000 | 97.8 |
| Proposed method | 2.5 | 28 | 180 | 88 | 65 | 2000 | 99.1 |
From Table 1, the proposed method had a maximum actual code processing success rate of 99.1%, while the AST method had a maximum success rate of 94.2%, which was about 4.9% lower than that of the research method. The success rate of the CFG method was 88.5%, which was 10.6% lower than that of the proposed method. This shows that the proposed method performs significantly better in robustness to real-world code, possibly due to its stronger syntactic fault tolerance and context recovery mechanism. In terms of processing speed, the research algorithm could reach a maximum of 2.5 seconds/thousand rows, which was significantly better than the 8 seconds/thousand rows of the CPG method. In addition, at the maximum project scale supported, the research algorithm could handle more than 2000 thousand lines of code, which was much higher than the 1000 thousand lines of the CPG method and the 500,000 lines of the AST method. The scalability is the most outstanding. Taken together, the proposed method achieves a good balance between speed, scale, and success rate, which is more suitable for code analysis and extraction of large-scale actual projects.
3.2 Performance Validation of Vulnerability Detection Model
To analyze the actual detection effect of the vulnerability detection model, the study conducted comparative analysis and testing on different fuzzy vulnerability datasets. The dataset used included CWE79, which contains 1320 vulnerable samples and 8600 safe samples, with a total of 9920 samples. CWE89 contains 1850 vulnerable samples and 9200 safe samples, with a total of 11,050 samples. CWE22 contains 2100 vulnerable samples and 10,500 safe samples, with a total of 12,600 samples. In addition, the two variants of CWE78 respectively cover 980 vulnerable samples and 7500 safe samples, a total of 8480 samples, and 5200 vulnerable samples and 38,000 safe samples, a total of 43,200 samples. The further constructed composite dataset Composite-A contains 2450 vulnerable samples and 10,200 safe samples, totaling 12,650 samples. Composite-B is the largest, containing 16,800 vulnerable samples and 42,000 safe samples, totaling 58,800 samples. The study compared different vulnerability detection models, including Devign, Line-level Vulnerability Detection (LineVD) and Pre-trained model based on BERT architecture (CodeBERT). All the comparison models were re-trained and tested on the same deep semantic confusion dataset. The hyperparameters were optimized based on the validation set through grid search (such as learning rate {1e-5, 3e-5, 5e-5}, batch size {16, 32, 64}), to ensure fair comparison. Different indicators of these algorithms were compared, as shown in Figure 8. The number of iterations of the model was set to 1000, and its indicator results on the CWE79 dataset were tested.
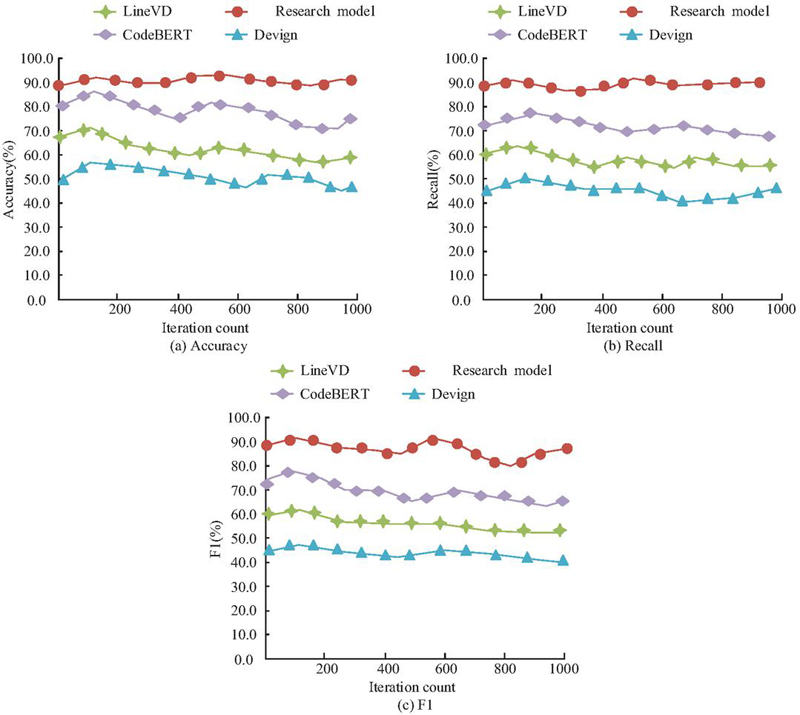
Figure 8 Performance comparison results of different algorithms.
From Figure 8(a), the proposed method had the highest extraction accuracy of 93.1%. The extraction accuracy of Devign model was the lowest, at 58.6%, which was about 34.5% lower than that of the proposed model. The vulnerability detection accuracy of the proposed method has been significantly improved. This may be due to the graph neural network. From Figure 8(b), the proposed method had the highest extraction recall rate of 91.3%. The highest extraction recall rate of Devign was only 51.8%, which was 39.5% lower than that of the proposed method. From Figure 8(c), the highest F1 value of the proposed method was 91.6%, while the highest F1 value of Devign was only 46.8%, which was 44.8% lower than that of the proposed method. This model can better detect vulnerabilities. The study compared the FNR of different models in vulnerability detection in different datasets, as shown in Figure 9. FNR measures the degree of false negatives a model makes. The lower the value, the fewer vulnerabilities are missed.
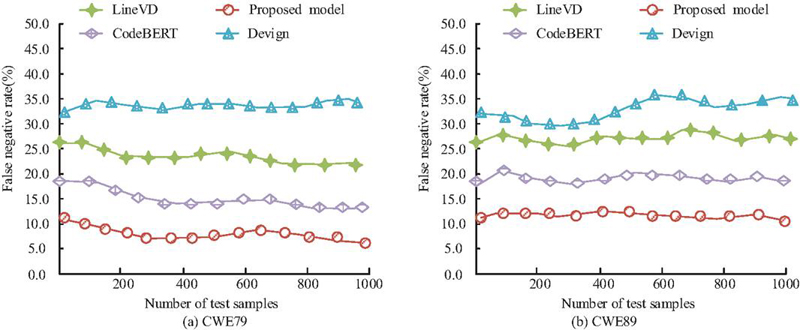
Figure 9 Comparison of false negative rates among different models.
From Figure 9(a), the proposed method had a maximum FNR of only 11.3%. The FNR of the Devign model was 34.6%, which was approximately 23.3% higher than that of the proposed method. The FNR was significantly reduced. From Figure 9(b), in the dataset CWE89, the proposed method had the highest FNR of only 11.6%. The FNR of Devign was 35.2%, which was 23.6% higher than that of the proposed method. The performance of the proposed method is better. The study compared the performance on the same dataset, as presented in Table 2.
Table 2 Comparison results of different model indicators
| Model | Average Detection Accuracy (%) |
Precision (%) | Recall (%) | F1-Score (%) |
| CodeBERT | 93.5 | 75.2 | 85 | 79.8 |
| LineVD | 94.1 | 80.5 | 80 | 80.25 |
| Devign | 94.8 | 78.3 | 83 | 80.58 |
| Proposed Model | 96.24 | 83.62 | 87.53 | 85.54 |
From Table 2, the proposed method had an average detection accuracy of up to 96.24%, while the CodeBERT model had an average detection accuracy of up to 93.50%, which was about 2.74% lower than that of the proposed method. The LineVD model was 94.10%, a decrease of approximately 2.14%. This shows that the proposed method has a clear advantage in overall classification performance due to its more advanced graph representation learning architecture. In terms of the accuracy index that measures accurate alarm capabilities, the proposed method reached 83.62%, which was higher than the 80.50% of the LineVD model and 75.20% of the CodeBERT model. In terms of the recall index that measures vulnerability detection capabilities, the proposed method reached 87.53%, significantly better than that of CodeBERT (85.00%) and Devign (83.00%). To further verify the superiority of the proposed method, additional comparative experiments were conducted with GraphCodeBERT, LineVul, and VulBERTa on the same dataset of misconfiguration vulnerabilities. The results are shown in Table 3.
Table 3 Performance comparison with advanced baseline model (Confusion Leakage Dataset)
| Model | Average Detection Accuracy (%) |
Accuracy Rate (%) | Recall Rate (%) | F1 score (%) |
| GraphCodeBERT | 94.82 | 79.63 | 84.91 | 82.18 |
| LineVul | 94.35 | 80.12 | 83.75 | 81.89 |
| VulBERTa | 93.91 | 78.85 | 83.24 | 80.98 |
| Proposed Model | 96.24 | 83.62 | 87.53 | 85.54 |
As shown in Table 3, the proposed model outperforms the three advanced baselines in all indicators. Specifically, the F1 score is 3.36 percentage points higher than that of GraphCodeBERT, 3.65 percentage points higher than that of LineVul, and 4.56 percentage points higher than that of VulBERTa, verifying the significant advantages of the proposed method in the deep semantic confusion scenario. The study compared the FNR of different models, as presented in Table 4.
Table 4 Comparison of false negative rates among different models
| Baseline Model (LSTM) | This Study | |||||||||
| Dataset | Accuracy | Precision | Recall | F1 | FNR | Accuracy | Precision | Recall | F1 | FNR |
| CWE79 | 85.2 | 72.1 | 68.5 | 70.26 | 31.5 | 90.15 | 78.3 | 82.4 | 80.3 | 17.6 |
| CWE89 | 83.5 | 70.5 | 65.8 | 68.07 | 34.2 | 88.9 | 76.8 | 80.6 | 78.66 | 19.4 |
| CWE22 | 82.8 | 69.8 | 63.2 | 66.34 | 36.8 | 89.25 | 77.5 | 84.3 | 80.78 | 15.7 |
| CWE78-1 | 81.6 | 68.2 | 60.5 | 64.08 | 39.5 | 87.4 | 75.6 | 79.2 | 77.37 | 20.8 |
| CWE78-2 | 86.5 | 73.5 | 71 | 72.23 | 29 | 91.8 | 80.2 | 85.1 | 82.58 | 14.9 |
| Composite-A | 84.3 | 71.6 | 66.8 | 69.11 | 33.2 | 89.65 | 78.9 | 83.5 | 81.15 | 16.5 |
| Composite-B | 87.1 | 74.3 | 73.5 | 73.9 | 26.5 | 92.45 | 82.1 | 88.6 | 85.22 | 11.4 |
| Average | 84.43 | 71.43 | 67.04 | 69.14 | 32.96 | 89.94 | 78.49 | 83.39 | 80.87 | 16.61 |
From Table 4, the proposed model achieved an average overall accuracy of 89.94%, while the average precision of the benchmark model was 84.43%, a relative improvement of 5.51%. The average precision of the proposed method reached 78.49%, which was 7.06% higher than the 71.43% of the benchmark model. This shows that the proposed method has a clear advantage in reducing false positives, possibly due to its more accurate semantic understanding and pattern recognition capabilities. In terms of key indicators that measure vulnerability detection capabilities, the average recall rate of the proposed method reached 83.39%, which was an increase of 16.35% compared to the 67.04% of the baseline model. Taken together, the proposed method significantly improves the recall rate and significantly reduces the FNR while maintaining high accuracy and precision. It achieves a better balance between security, reliability, and usability, which is more suitable for actual security audit scenarios that have strict requirements on vulnerability coverage and detection credibility. The study compared the FNR of different models in different datasets, as presented in Table 5.
Table 5 Comparison of false negative rates among different models
| Dataset | CodeBERT | LineVD | Devign | This Study |
| CWE79 | 23.8 | 28.5 | 34.6 | 17.6 |
| CWE89 | 24.2 | 29.1 | 35.2 | 19.4 |
| CWE22 | 21.5 | 26.3 | 31.8 | 15.7 |
| CWE78-1 | 26.7 | 30.9 | 36.5 | 20.8 |
| CWE78-2 | 20.4 | 25.2 | 28.9 | 14.9 |
| Composite-A | 22.9 | 27.6 | 32.4 | 16.5 |
| Composite-B | 18.6 | 23.0 | 26.1 | 11.4 |
| Average | 22.59 | 27.23 | 32.21 | 16.61 |
From Table 5, the proposed model had the lowest FNR on all datasets. On the CWE79 and CWE89 datasets, the FNR of the proposed model was 17.6% and 19.4%, respectively, while Devign was able to achieve 34.6% and 35.2%. On the CWE22 and CWE78 datasets, the equation of the proposed model ranged from 11.4% to 20.8%, which was significantly lower than that of CodeBERT, LineVD, and Devign. In terms of average performance, the average equation of the proposed model was 16.61%, which was 26.5%, 39.0%, and 48.4% lower than that of CodeBERT, LineVD, and Devign, respectively. This shows that the proposed model has extremely strong robustness and false negative suppression capabilities in deep semantic camouflage scenarios. This may be due to the tensor circulant matrix of the proposed model having a maintenance mechanism for the semantic integrity of the code.
To verify the independent contributions of each core component, an ablation experiment was designed: removing the tensor recurrent matrix, removing the gating mechanism, and removing both simultaneously. The experiment was conducted on the Composite-B dataset, and the results are shown in Table 6.
Table 6 Results of the ablation experiment (Composite-B dataset)
| Model Configuration | Accuracy (%) | Accuracy Rate (%) | Recall Rate (%) | F1 Score (%) |
| Complete model | 92.45 | 82.1 | 88.6 | 85.22 |
| Non-tensor cyclic matrix | 88.3 | 76.5 | 81.2 | 78.78 |
| No gating mechanism | 87.6 | 75.8 | 80.1 | 77.89 |
| No tensor cyclic matrix and no gating mechanism | 83.2 | 70.4 | 73.5 | 71.91 |
As shown in Table 6, the complete model has the best performance. After removing the tensor cyclic matrix, the F1 score decreased by 6.44 percentage points; after removing the gating mechanism, it decreased by 7.33 percentage points; and when both were removed, it decreased by 13.31 percentage points. This proves that both the tensor cyclic matrix and the gating mechanism have significant independent contributions to the detection performance.
4 Conclusion
To deal with the severe threat to code security posed by vulnerability hiding behavior under deep semantic camouflage and improve the robustness and accuracy, a vulnerability detection method based on tensor circulant matrix was built. This method maintained the integrity and local correlation of code semantics through tensor circulant matrices, and integrated GGCNN to enhance the model’s ability to capture hidden vulnerability features. Compared with mainstream models such as Devign and CodeBERT, the proposed model could more effectively resist semantic confusion interference. In the test on the obfuscation vulnerability dataset, the average detection accuracy was 96.24%, and the precision, recall, and F1 scores were 83.62%, 87.53%, and 85.54%, respectively. Compared with the baseline model, the FNR was significantly reduced by 16.73%. The proposed method is superior to traditional AST, CFG, and CPG methods in key indicators such as processing speed, maximum supported project size, and actual code processing success rate. The average FNR was reduced by 26.5%, 39.0%, and 48.4%, respectively, compared with the traditional model. The vulnerability detection framework performs better in deep semantic understanding and structural analysis, and is more in line with the demand for highly robust detection tools in actual confrontational environments. Although the research has achieved results, there are still some shortcomings. For example, the experiment mainly focuses on specific vulnerability types of C/C++ code, and the generalization ability to other programming languages or more diverse vulnerability types still needs to be further explored. Meanwhile, the research focuses on offline detection scenarios. The real-time detection and early warning performance integrated into the development process still needs to be further verified and optimized in the actual software supply chain environment.
References
[1] Ge, K, and Han, Q B. Hidden code vulnerability detection: A study of the Graph-BiLSTM algorithm. Information and Software Technology, 2024, 175(10), 107544–107545. DOI:10.1016/j.infsof.2024.107544.
[2] Nandhini, S, Rajeswari, A, and Shanker, N R. Cyber attack detection in IOT-WSN devices with threat intelligence using hidden and connected layer based architectures. Journal of Cloud Computing, 2024, 13(1):159–160. DOI:10.1186/s13677-024-00722-9.
[3] Kasula, V K, Yadulla, A R, Yenugula, M, and Konda, B. Enhancing smart contract vulnerability detection using graph-based deep learning approaches. In 2024 International Conference on Integrated Intelligence and Communication Systems (ICIICS). 2024, 5(2):1–6. DOI:10.1109/ICIICS63763.2024.10860016.
[4] Xu, H, Zhou, Y, Ming, J, and Lyu, M. Layered obfuscation: a taxonomy of software obfuscation techniques for layered security. Cybersecurity, 2020, 3(1):9. DOI:10.1186/s42400-020-00049-3.
[5] Xiao, P, Xiao, Q, Zhang, X, Wu, Y, and Yang, F. Vulnerability detection based on enhanced graph representation learning. IEEE Transactions on Information Forensics and Security, 2024, 19(4), 5120–5135. DOI:10.1109/TIFS.2024.3392536.
[6] Jahanshahi M, Mockus A. Cracks in the stack: Hidden vulnerabilities and licensing risks in llm pre-training datasets. In 2025 IEEE/ACM International Workshop on Large Language Models for Code (LLM4Code). 2025, 12(6):104–111. DOI:10.1109/LLM4Code66737.2025.00018.
[7] Cheng, X, Wang, H, Hua, J, Xu, G, and Sui, Y. Deepwukong: Statically detecting software vulnerabilities using deep graph neural network. ACM Transactions on Software Engineering and Methodology (TOSEM), 2021, 30(3):1–33. DOI:10.1145/3436877.
[8] Bakır, H. A new method for tuning the CNN pre-trained models as a feature extractor for malware detection. Pattern Analysis and Applications, 2025, 28(1):26. DOI:10.1007/s10044-024-01381-x.
[9] Huang, W, Chen, H, Cao, H, Ren, J, Jiang, H, Fu, Z, and Zhang, Y. (2024). Manipulating voice assistants eavesdropping via inherent vulnerability unveiling in mobile systems. IEEE Transactions on Mobile Computing, 2024, 23(12):11549–11563. DOI:10.1109/TMC.2024.3401096.
[10] Wadibhasme R N, Chaudhari A U, Khobragade P, et al. Detection and prevention of malicious activities in vulnerable network security using deep learning. In 2024 International Conference on Innovations and Challenges in Emerging Technologies (ICICET). 2024, 6(3):1–6. DOI:10.1109/ICICET59348.2024.10616289.
[11] Nazir A, Iqbal Z, Muhammad Z. ZTA: a novel zero trust framework for detection and prevention of malicious android applications. Wireless Networks, 2025, 31(4):3187–3203. DOI:10.1007/s11276-025-03935-1.
[12] Li, L, Ding, S H, Tian, Y, Fung, B C, Charland, P, Ou, W, and Chen, C. VulANalyzeR: Explainable binary vulnerability detection with multi-task learning and attentional graph convolution. ACM Transactions on Privacy and Security, 2023, 26(3):1–25. DOI:10.1145/3585386.
[13] Xu, Y, Zhang, Q, Deng, H, Liu, Z, Yang, C, and Fang, Y. Unknown web attack threat detection based on large language model. Applied Soft Computing, 2025, 173(4):112905–112906. DOI:10.1016/j.asoc.2025.112905.
[14] Zhen, Z, Zhao, X, Zhang, J, Wang, Y, and Chen, H. (2024). DA-GNN: A smart contract vulnerability detection method based on Dual Attention Graph Neural Network. Computer Networks, 2024, 242(5):110238–110239. DOI:10.1016/j.comnet.2024.110238.
[15] Osei, S B, Ma, Z, and Huang, R. (2024). Smart contract vulnerability detection using wide and deep neural network. Science of Computer Programming, 2024, 238(10):103172–103173. DOI:10.1016/j.scico.2024.103172.
[16] Ye, M, Nan, Y, Dai, H N, Yang, S, Luo, X, and Zheng, Z. FunFuzz: A function-oriented fuzzer for smart contract vulnerability detection with high effectiveness and efficiency. ACM Transactions on Software Engineering and Methodology, 2024, 33(7), 1–20. DOI:10.1145/3674725.
[17] Gunda S K. Automatic software vulnerabilty detection using code metrics and feature extraction. In 2025 2nd International Conference On Multidisciplinary Research and Innovations in Engineering (MRIE). 2025, 19(10):115–120. DOI:10.1109/MRIE66930.2025.11156601.
[18] Shamsi, K, Li, M, Plaks, K, Fazzari, S, Pan, D Z, and Jin, Y. IP protection and supply chain security through logic obfuscation: A systematic overview. ACM Transactions on Design Automation of Electronic Systems (TODAES), 2019, 24(6):1–36. DOI:10.1145/3342099.
[19] Wang, S, Huang, C, Yu, D, and Chen, X. VulGraB: Graph-embedding-based code vulnerability detection with bi-directional gated graph neural network. Software: Practice and Experience, 2023, 53(8):1631–1658. DOI:10.1002/spe.3205.
[20] Cheng, B, Zhao, S, Wang, K, Wang, M, Bai, G, Feng, R, and Wang, H. Beyond fidelity: Explaining vulnerability localization of learning-based detectors. ACM Transactions on Software Engineering and Methodology, 2024, 33(5):1–33. DOI:10.1145/364154.
Biographies

Yao Hu (July 1985), male, graduated from the University of Science and Technology of China, majoring in Cybersecurity, with a master’s degree. Currently he works as a Senior Engineer at Guangzhou Power Supply Bureau, Guangdong Power Grid Co. Ltd., focusing on cybersecurity research and practice.

Shihua Wen (February 1995), female, graduated from Sun Yat-sen University, majoring in Computer Science and Technology, and obtained a bachelor’s degree. Upon graduation, she worked as an engineer at Guangzhou Power Supply Bureau, Guangdong Power Grid Co. Ltd. Her current research focus is computer science and technology.

Huipeng Wang (July 1983), male, graduated from South China University of Technology, majoring in Information Technology and holds a master’s degree. He works as an engineer at Guangzhou Power Supply Bureau, Guangdong Power Grid Co. Ltd. His current research focuses on information technology.

Jie Yang (September 1981), male, graduated from South China University of Technology, majoring in Information Technology and obtained a master’s degree. He currently works as a senior engineer at Guangzhou Power Supply Bureau, Guangdong Power Grid Co. Ltd. His research focuses on information technology.

Lingjian Chen (December 1993), male, graduated from Harbin Institute of Technology, majoring in Information Technology, and holds a master’s degree. He works as an engineer at Guangzhou Power Supply Bureau, Guangdong Power Grid Co. Ltd. His current research focuses on information technology.
Journal of Cyber Security and Mobility, Vol. 15_4, 939–964
doi: 10.13052/jcsm2245-1439.1546
© 2026 River Publishers