HMG-AID: Heterogeneous Internet of Things Intelligent Intrusion Detection Model Based on Multimodal Graph Attention
Wei Wu
Department of Basic Sciences, Anhui Vocational College of Grain Engineering, Hefei Anhui 230011, China
E-mail: wuwei202603@126.com
Received 25 March 2026; Accepted 14 May 2026
Abstract
With the increasingly complex heterogeneity of device types, communication protocols and data formats in the Internet of Things (IoT) environment, traditional intrusion detection (ID) models are difficult to effectively deal with dynamic threats. This paper proposes an intelligent IoT intrusion identification model HMG-AID for heterogeneous environments. The model realizes end-to-end ID by fusing multi-modal feature extraction, graph attention mechanism and dynamic trust evaluation. It uses one-dimensional Convolutional Neural Network (CNN) and Long Short-Term Memory (LSTM) to extract spatiotemporal characteristics of traffic data in parallel, constructs heterogeneous device graphs and aggregates neighbor information through GraphSAGE, then introduces multi-head graph attention-weighted key nodes, and finally integrates zero-trust dynamic evaluation to optimize classification decisions. The F1 scores of the HMG-AID model on the three datasets of NSL-KDD, CICIDS2017, and ToN-IoT are 94.7%, 95.3%, and 94.9%, respectively, which are significantly better than the baseline model. Moreover, the F1 score retention rate under-5 dB noise interference is 85.6%, and the F1 score retention rate under counterattack attack is 88.9%. In addition to this, the model has a 93.6% F1 score retention rate when the device size increases to 10,000 nodes. The model effectively improves detection accuracy, environmental adaptability and decision interpretability through multi-level innovative design and provides a reliable theoretical basis and practical framework for heterogeneous IoT security protection.
Keywords: Heterogeneous environment, intrusion identification, IoT, multimodal feature extraction.
1 Introduction
With the rapid popularization and in-depth application of IoT technology, the IoT environment presents highly complex and heterogeneous characteristics. This heterogeneity is mainly reflected in three levels: the diversity of device types (from sensor nodes with limited computing power to intelligent gateways with rich features), the complexity of communication protocols, and the inconsistency of data formats. This multi-dimensional heterogeneity leads to significant differences in network traffic characteristics. At the same time, existing models generally have some problems, such as limited detection accuracy, poor adaptability to new attacks and unknown threats, and difficulty in effectively mining dynamic correlations between devices. In particular, when dealing with large-scale and dynamically changing heterogeneous Internet of Things (IoT) environments, it is often impossible to achieve accurate real-time threat identification, making it difficult to meet the urgent needs of modern IoT applications for efficient and precise security protection.
With the increasing demand of IoT technology and people, the number of global IoT connections has already exceeded 10 billion, and the security problems of IoT are becoming increasingly serious. For example, some people use device vulnerabilities to build various attack networks, which affect the stable operation of IoT devices and even leads to the collective paralysis of group devices and causes serious security factor leakage problems. Faced with these problems, the traditional models are inadequate in dealing with IoT intrusion attacks, and they can’t develop global awareness in dealing with device-related attacks. From the actual situation, the intrusion model detection needs to consider the real-time monitoring of many kinds of information, so it is necessary to introduce multi-information fusion mechanisms and adaptive learning mechanisms to improve the overall defense ability of the system.
This paper proposes an intelligent IoT intrusion detection (ID) model HMG-AID, which can realize the effective detection of IoT intrusion in a heterogeneous environment, overcome the shortcomings of traditional models, innovate the model by combining theory with practice, and improve the detection accuracy of IoT intrusion on the basis of ensuring interpretability and practicability.
2 Related Work
The technology of IoT is becoming more and more mature and has been integrated into all aspects of people’s lives. However, the heterogeneous environment of IoT also leads to its security threats becoming increasingly serious. Therefore, it is necessary to build an ID system adapting to heterogeneous environment to improve the security of IoT systems. In recent years, experts and scholars have put forward a variety of ID models of IoT. According to different research technical routes, they can be divided into four themes: traditional machine learning (ML) methods, deep learning (DL) methods, lightweight (LW) and emerging learning paradigms, interpretability and system architecture innovation.
2.1 Traditional ML and Feature Selection Methods
The traditional ML method has high learning efficiency and interpretability, so this technology has been applied to IoT ID for a long time. The application of ML in IoT ID mainly improves the detection efficiency through feature engineering and algorithm optimization. Ferrag et al. [1] proposed a hybrid system based on rules and decision trees (Rdtids). The system has high detection efficiency, but the system is highly dependent on artificial rules, which causes the system to have insufficient adaptability. Amouri et al. [2] proposed a ML detection system for mobile IoT, which can realize the dynamic monitoring of IoT device intrusion with high accuracy, but it is difficult to identify when faced with new attacks. Abbas et al. [3] proposed an ensemble learning (EL) framework for real-time monitoring of IoT. The system improves robustness by fusing multiple basis classifiers, but it has shortcomings in processing heterogeneous data. Nimbalkar et al. [4] used the feature selection method to optimize the input dimension in the proposed system, which effectively reduces the system overhead, but it is insufficient in dealing with feature interaction relation mining. Abdelmoumin et al. [5] compared and analyzed different ML models and verified the advantages of a RF model in balancing accuracy and efficiency, but the interpretability of the model is insufficient. Aravamudhan et al. [6] designed a self-adaptive detection system for IoT detection. The system can adapt to environmental changes through dynamic threshold adjustment, but there are some shortcomings in real-time detection. Xu et al. [7] applied automated ML process to IoT ID. Although it improves the usability, there is a computational efficiency problem when processing massive data. Alotaibi et al. [8] proposed an EL framework for IoT ID. It integrates multiple models through voting mechanism to improve the detection stability, but the computational cost increases with the increase of models.
2.2 DL Methods
DL technology can process more complex data and has the ability to learn complex features automatically, so it has certain advantages in the detection and analysis of modal data in IoT. Wang et al. [9] proposed a Res-TranBiLSTM model combining residual network and bidirectional LSTM. The model can capture the spatiotemporal characteristics of traffic, and detection accuracy can reach more than 90% when experimented on public datasets. However, the deployment cost of the model is high, and it is difficult to be applied in practice. Zhao et al. [10] designed a LW neural network (NN) model, which uses a deep separable convolution technique to reduce the computational cost, but its detection effect is not good enough in the face of low frequency attacks. Zohourian et al. [11] applied packet representation learning to IoT ID and proposed an IoT-PRIDS model. It demonstrates the potential of DL in raw traffic feature mining. Jayalaxmi et al. [12] designed a PIGNUS model for complex scenarios and verified the ID potential of DL technology in complex IoT environments.
Khan et al. [13] reviewed the application of DL in IoT ID and found that most DL models have insufficient interpretability. Soliman et al. [14] applied DL to industrial IoT ID and extracted protocol features through convolutional networks, but the compatibility of this model is insufficient, which makes it difficult to be widely deployed in practical applications.
Dina et al. [15] introduced the focus loss function in IoT ID to solve the category imbalance problem, which effectively improved the recall rate of the model, but the stability of the model appeared to be insufficient. Balakrishnan et al. [16] introduced the deep belief network model in IoT ID to improve the data representation capability but did not carry out device association modeling.
2.3 LW and Emerging Learning Paradigms
In order to solve the contradiction between detection accuracy and resource consumption, some researchers have applied a LW algorithm and distributed learning paradigm to IoT ID. Rahman et al. [17] studied the potential of federated learning in IoT ID and protected the privacy of IoT data through distributed training. However, the communication overhead of this system is large, and the convergence speed is slow. Jiang et al. [18] proposed a distributed detection architecture based on blockchain, which shows certain reliability in IoT detection and provides a new idea for the decentralized security of an IoT ID model. Tharewal et al. [19] incorporated deep Qinghai learning into the IoT intrusion system, which realizes the dynamic interaction between the agent and the environment and can realize the dynamic adaptation between the machine and the environment, but the sample training efficiency of this model is low. Saheed et al. [20] used a LW detection method in the constructed IoT model. The method incorporates pattern pruning and quantization techniques, which reduces the memory occupation of the system, but the problem of robustness is insufficient in the experiment.
2.4 Explainability and System Architecture Innovation
In recent years, experts and scholars have regarded improving the interpretability of the model as the research objective in IoT ID, and have constructed multi-level defense systems to improve the application effect of IoT ID systems. Almohri et al. [21] proposed a flexible architecture, which can improve the security of IoT ID systems from the system design level. Doshi et al. [22] incorporated the mitigation mechanism into the IoT ID system and verified through experiments that the proposed model has strong architectural adaptability in specific attack scenarios. Gassais et al. [23] proposed a multi-level host detection system, which has the function of collaborative analysis at the device layer and the network layer, but this also causes the problem of complex system integration. Moustafa et al. [24] incorporated the proposed explanation method based on attention mechanism into the constructed IoT system. This method improves the decision transparency of the model, but the real-time interpretation performance still needs to be optimized. Landauer et al. [25] pointed out that maintainable log datasets can play an important role in IoT ID systems. Alani et al. [26] constructed a double-layer intelligent IoT ID architecture and combined shallow rapid filtering and deep fine analysis to achieve the balance between efficiency and accuracy. However, the system is difficult to adapt to dynamic environment, which leads to practicality problems. Smys et al. [27] proposed a hybrid ID system, which integrates rule engine and ML components into the system architecture. The experimental results show that the system performs well in specific scenarios, but the generalization ability is insufficient.
On the whole, the IoT ID models proposed by some studies have made progress in improving detection accuracy and optimizing resource efficiency, but there are still some shortcomings. Most methods do not fully consider the complex environment that the IoT ID model needs to face, and also do not consider the heterogeneous situation, which leads to problems such as insufficient detection ability of the model in the face of complex environment. Moreover, traditional ML technology is strongly dependent on artificial features, and there are problems such as insufficient adaptability in IoT ID, and there is still room for improvement in interpretability, adversarial robustness and cross-scenario generalization. In this paper, an HMG-AID model is proposed, which incorporates multi-modal feature extraction, graph attention mechanism and dynamic trust assessment into ID systems, so as to improve the detection accuracy, robustness and interpretability of IoT ID models in heterogeneous environments. Finally, the model introduces the concept of dynamic evaluation based on zero trust, incorporating behavioral trust values into classification decisions, forming a complete intelligent defense loop from perception, through understanding, to decision-making. This chapter will elaborate on the mathematical principles, architectural design, and workflow of this model.
3 Proposed HMG-AID Model
3.1 Overall Model Architecture
The overall architecture of the HMG-AID model is an end-to-end DL framework. Its input is network traffic sequence and device metadata in the IoT environment, and its output is specific attack type classification results. As shown in Figure 1, the entire process begins with a multi-modal feature extraction module, which processes the spatial and temporal dimension information of the traffic data in parallel. The extracted high-level features and device metadata are sent to the heterogeneous device graph construction module, and the network entities and interactions are transformed into graph data representation. The graph attention fusion layer deeply encodes the constructed graph and generates the embedded representation of the device by aggregating neighbor information and weighting key nodes. The dynamic classifier combines the graph embedding representation of the device and its real-time calculation of behavior trust value to accurately identify intrusion behavior. The architecture has distinct levels, and each module works together to deal with the detection problems in heterogeneous environments.
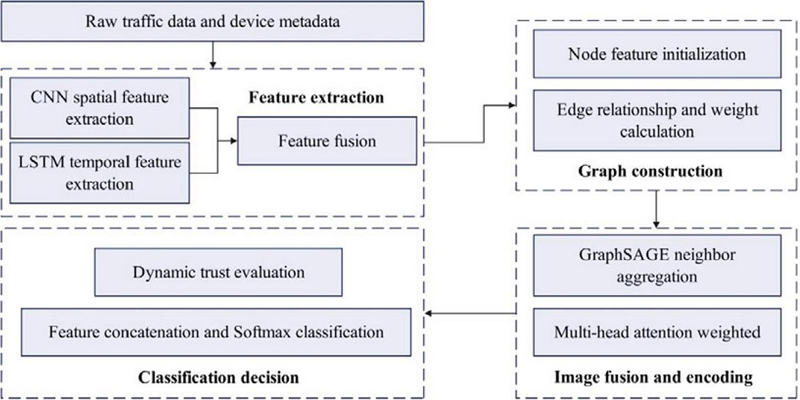
Figure 1 Overall architecture diagram of HMG-AID model.
3.2 Multi-Modal Feature Extraction Module
IoT traffic data contains both structured fields in the packet header (such as protocol type, port number, length) and patterns implied by the load content. This information has important features in both spatial and temporal dimensions. In order to fully capture this information, this module uses parallel CNN and LSTM for feature extraction.
For a given sequence of traffic data packets (where represents the -dimensional feature vector at time ), a one-dimensional CNN is used to extract its spatial local correlations. The convolutional layer operates on the sequence using a sliding window, and its computation process can be formalized as:
| (1) |
The symbol represents the convolution operation, where and represent the weight matrix and bias term of the convolutional kernel, respectively, is the size of the convolutional kernel, and represents the ReLU non-linear activation function. After multiple layers of convolution and pooling operations, we obtain the spatial feature matrix .
LSTM are used to model long-term time series dependencies of traffic data. The calculation of an LSTM unit at each time step involves the input gate , forget gate , output gate , and cell state , and its update formulas are:
| (2) |
where and represent the weight and bias parameters of each gate, represents element-wise multiplication, and is the vector concatenation operation. The output of the LSTM forms the time-series feature matrix .
The extracted spatial feature matrix and the time series feature matrix are spliced in feature dimensions, and fused and dimensionally reduced through a fully connected layer to generate a unified feature representation:
| (3) |
where and are parameters of the fully connected layer and represents the concatenation operation of matrices along the feature dimension. The resulting is the fused multimodal feature matrix, which will serve as the initial features for the nodes in the subsequent graph construction module.
The detailed flow chart of multi-modal feature extraction is shown in Figure 2.
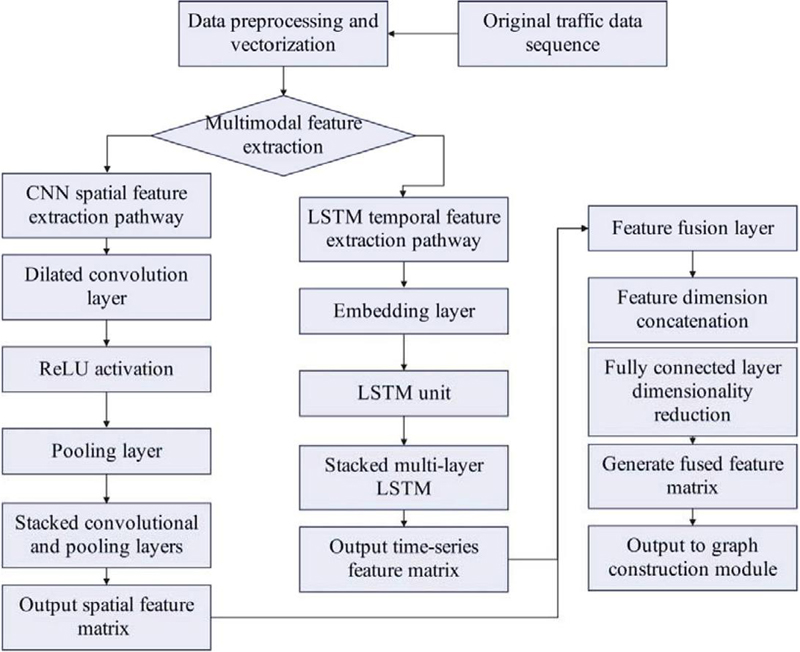
Figure 2 Detailed flow chart of multi-modal feature extraction.
Specifically, the “multi-modality” referred to in this paper mainly aims at the heterogeneous information dimension contained in the network traffic data itself. The first modality is spatial local correlation features, which are mainly extracted from the structured fields of the packet, and these features present local correlations at fixed locations of the packet, which are suitable for capture with CNN. The second mode is a time series dependent feature, and it is mainly extracted from the sequential pattern of traffic data, which reflects the dynamic evolution process of network behavior and is suitable for modeling with LSTM. In the preprocessing stage, the raw traffic data is separately processed into two parallel sequences: a normalized feature vector sequence for CNN input and a time-step feature sequence for LSTM input, thus providing an explicit input for subsequent parallel feature extraction.
3.3 Heterogeneous Device Diagram Construction and Graph Attention Fusion
The essence of the IoT environment is a network of heterogeneous devices connected through complex communication relationships. To explicitly model this structure and capture interaction patterns between devices, we abstract the network into a graph structure and utilize advanced graph NN for learning.
An undirected graph is defined to represent the IoT network, where each node in the set of nodes corresponds to a physical or logical device in the network. Each node is assigned a feature vector, initialized with device metadata (such as device type, IP address, and the corresponding portion in the initial traffic features Hfuse). An edge in the edge set represents a communication relationship between device and device . The weight of the edge can be dynamically calculated based on the traffic intensity or connection frequency between the two devices, such as:
| (4) |
On the basis of obtaining the graph structure, we use the GraphSAGE algorithm to learn the embedded representation of the nodes. GraphSAGE generates node representations by sampling neighbors and aggregating their information. This process can effectively deal with the heterogeneity of nodes in graphs. For node , the aggregation and update process at layer can be described as:
| (5) |
where represents the set of neighbors of node , is a differentiable aggregation function (such as a mean aggregator), and is a trainable weight matrix. After iterations, we obtain the intermediate representation for each node.
After the intermediate representation of each node is obtained by K-layer GraphSAGE aggregation, it is used as the initial node feature and input into an independent multi-head graph attention network (GAT) layer for refined encoding. The GAT layer takes as the input feature to calculate the attention coefficient between nodes. This approach combines the advantages of GraphSAGE in efficiently sampling and aggregating neighbor information with the advantages of GAT in dynamically assigning weights. Specifically, the attention weight based on the rich neighbor information can be calculated by substituting the final output of Equation (3.3) into and in Equation (6).
In ID scenarios, different neighbor devices have different degrees of influence on the current device security status. To adaptively learn this difference in importance, we introduce a multi-head graph attention network on the representations generated by GraphSAGE. For each pair of neighboring nodes , its attention coefficient is calculated:
| (6) |
where is a learnable attention vector, is the shared linear transformation weight matrix, represents vector concatenation. The final output features of node are obtained by concatenating the results of multiple attention heads (M heads in total):
| (7) |
The symbol represents the stitching operation of the vector. Through this mechanism, the model is able to dynamically assign higher attention weights to those device nodes that play a key role in abnormal communication patterns, thereby significantly enhancing the ability to identify covert attacks. Figure 3 visually shows the complete process from feature extraction to graph attention fusion.
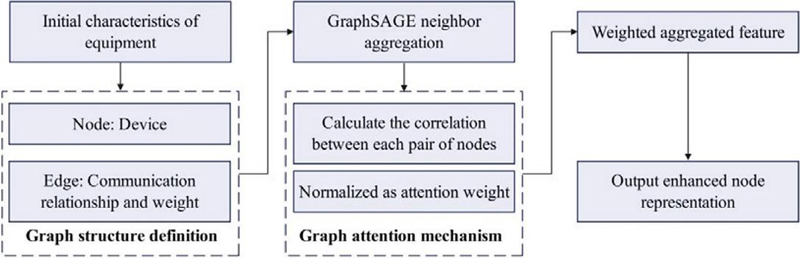
Figure 3 Schematic diagram of attention feature fusion flow.
3.4 Dynamic Trust Evaluation and Classifier
In order to deal with internal threats and slow penetration attacks, the model integrates the zero-trust security concept and assists the final decision-making by dynamically evaluating the behavioral trust value of the device. This trust value is comprehensively calculated based on the historical and real-time behavioral evidence of the device (such as traffic bursts, protocol compliance, and access time regularity).
This paper defines a series of computable behavioral evidence indicators , each has a value within the [0, 1] interval, and a higher value indicates a more suspicious behavior. The main indicators include:
(1) Traffic burst factor calculates the ratio of the standard deviation to the mean value of the number of outflow data packets in the current time window and normalizes it.
(2) Protocol compliance score, based on a predefined device-protocol whitelist, if the current session protocol is not in the protocol set allowed by the device, the score is 1, otherwise it is 0.
(3) Access time anomaly, based on the historical activity of the device, a time pattern profile (such as working day/non-working time) is established, and the deviation between the current activity time and the profile is calculated and normalized to [0,1].
These evidence vectors will be used in the calculation of Equation (9). In this paper, a modified fuzzy analytic hierarchy process is used to quantify behavioral evidence. A series of behavioral evidence indicators are defined, and a fuzzy consistency judgment matrix is constructed, where represents the importance of evidence relative to evidence . The weight of each piece of evidence can be calculated:
| (8) |
Based on the currently observed normalized evidence vector (higher values indicate more suspicious behavior), the preliminary trust value at the current time is calculated as:
| (9) |
In order to reflect the persistence and dynamic changes of trust, we introduce an updated formula including time decay and reward and punishment mechanism. The final trust value Tfinal (t) of a device at moment is determined by its current trust value, historical trust value and reward and punishment factors:
| (10) |
where and are decay coefficients (satisfying ), and is a reward/penalty term (normal behavior receives a small reward , while detected attacks incur a large penalty ). This mechanism allows the trust value to respond smoothly to behavioral changes, avoiding drastic fluctuations due to a single misjudgment.
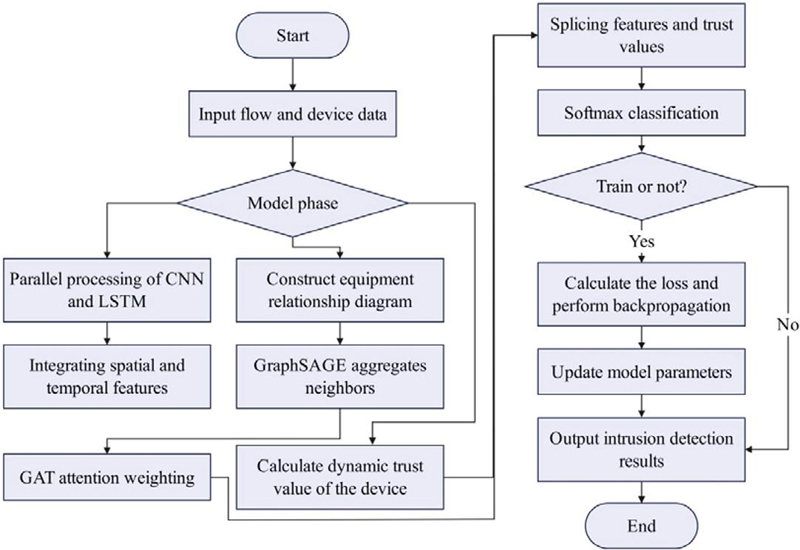
Figure 4 HMG-AID algorithm execution flow chart.
The classifier splices the node enhancement representation output by the graph attention fusion layer with its corresponding dynamic trust value , and jointly inputs a SoftMax classification layer to predict the attack category to which it belongs:
| (11) |
where is the total number of attack categories (including the “normal” category), and and are the corresponding weights and biases for each category . Model training is performed by minimizing the cross-entropy loss function for all labeled nodes:
| (12) |
where is the indicator value of node ’s true class label on class .
The complete training and detection process of the HMG-AID model is shown in Figure 4. The algorithm starts from the original data input, and sequentially executes the steps of feature extraction, graph construction, graph NN coding, trust evaluation and classification prediction, forming an end-to-end automated process.
The innovation of this model is mainly reflected in the deep integration of the following four levels:
(1) Through the parallel CNN and LSTM structures, the collaborative perception and fusion of spatial patterns and time series patterns of traffic data are realized, which provides a richer and more robust feature representation basis for subsequent analysis.
(2) It innovatively maps IoT scenarios into graph structures and uses the combination of GraphSAGE and GAT to not only solve the representation problems caused by heterogeneous device types but also reveal key attack propagation paths through attention mechanisms.
(3) Behavioral trust calculation is embedded in the DL model as a differentiable module, which makes the classification decision not only depend on the traffic pattern, but also considers the continuous behavior credibility of the device and realizes the preliminary linkage between detection and access control strategy.
(4) The whole model, from feature extraction, graph learning to trust evaluation, can be jointly optimized through gradient descent, which can automatically adapt to the data distribution of different IoT environments and has strong generalization ability.
4 Experimental Validation
The core objective of this research experiment is to comprehensively verify the effectiveness, robustness, and practicality of the proposed HMG-AID model in a real heterogeneous IoT environment. By designing multi-dimensional comparative experiments, we aim to evaluate the model’s performance in ID tasks, including detection accuracy, resistance to noise and adversarial interference, actual deployment efficiency, contribution of each key component, scalability, real-time performance, and generalization ability. This provides empirical evidence for the application of the model in complex IoT scenarios.
4.1 Experimental Method and Data Processing
4.1.1 Dataset and data preprocessing
This paper employs three publicly available global IoT ID datasets to ensure the generalization ability and fairness of the evaluation. The datasets used include:
(1) NSL-KDD dataset (source: Canadian Institute for Cybersecurity, available at https://www.unb.ca/cic/datasets/nsl.html), which is a benchmark dataset in the field of ID and contains normal traffic and four types of attack traffic (DoS, Probe, R2L, U2R), with a total of 41 feature dimensions.
(2) CICIDS2017 dataset (source: University of New Brunswick, available at https://www.unb.ca/cic/datasets/ids-2017.html), which provides multi-day real-world network traffic, covering common attacks such as DDoS, Brute Force, with 78 feature dimensions.
(3) ToN-IoT dataset (source: UNSW Cyberspace, available at https://research.unsw.edu.au/projects/toniot-datasets), specifically designed for IoT environments, containing traffic data from diversified devices (such as cameras, sensors), involving seven types of attack categories.
Data preprocessing follows a unified process: first, the raw data is cleaned to remove duplicates and missing values; then, feature normalization (Min-Max normalization) is performed to scale numerical features to the [0,1] interval; for categorical features (such as protocol types), one-hot encoding is used for conversion; finally, the data is divided into training set (70%), validation set (15%), and test set (15%) based on timestamps to ensure temporal continuity.
For the NSL-KDD dataset, it does not contain an exact timestamp itself. Referring to its data collection background, an increasing time sequence number is simulated for each record and divided as a “pseudo timestamp” to simulate the scenario of streaming data arrival. For the CICIDS2017 and ToN-IoT datasets, their packet capture timestamps are used for strict sorting and partitioning. It is noted that this partitioning may place the test set in different time periods than the training set, thus better evaluating the model’s generalization ability to potential concept drift, rather than simply fitting the static distribution.
The selected baseline models include traditional ML models (random forest [RF], support vector machine-SVM), classical deep learning models (CNN-LSTM), and graph NN models (GraphSAGE, GAT). In addition, in order to compare with the cutting-edge research, recent ID models that also adopt graph NNs are added as baselines, such as EGAT (a graph attention network combining edge features) and MTGCN (multi-time graph convolutional network), to ensure the comprehensiveness and cutting-edge of the comparison.
Adversarial samples are generated using Fast Gradient Symbol Method (FGSM) under white box setting, and the attack target is the HMG-AID model itself. The perturbation is added on the feature space of the model input (that is, the preprocessed normalized feature vector), and the perturbation coefficient is set to 0.1. This setup aims to evaluate the robustness of the model in the face of minor but targeted feature perturbations aimed at misleading the classifier.
4.1.2 Test method
The experimental design utilizes the proposed HMG-AID model as the experimental group and selects the current advanced baseline models as the control group, including traditional ML models (Random Forest-RF, Support Vector Machine-SVM), DL models (CNN-LSTM), and graph NN models (GraphSAGE, GAT), for a comprehensive comparison of performance. The experimental subjects are traffic samples from the aforementioned three datasets, and the experimental grouping controls the consistency of data partitioning through random seeds to ensure fair comparison. The experimental content covers multiple aspects:
(1) Performance test: evaluate the model’s classification ability on the test set using accuracy, precision, recall, and F1 score as indicators.
(2) Robustness test: observe the degree of model performance degradation by injecting Gaussian noise (with signal-to-noise ratios ranging from 10 dB to 5 dB) and adversarial samples (FGSM attack) into the test data.
(3) Practicality test: measure the model training time, inference latency, and memory usage to evaluate deployment efficiency.
(4) Ablation test: successively remove key modules from HMG-AID (such as multimodal feature fusion, graph attention mechanism, and dynamic trust evaluation) to analyze the contribution of each component.
(5) Interpretability test: utilize Grad-CAM to visualize attention weights and qualitatively analyze the model’s decision-making basis.
(6) Scalability test: verify the model’s ability to handle large-scale networks by measuring performance changes through increasing the number of device nodes.
(7) Real-time test: evaluate the model’s real-time processing ability in a streaming data environment, measuring latency and throughput.
(8) Cross-dataset generalization test: test the model’s generalization ability in unknown environments, using different datasets for training and testing.
4.2 Test Results
4.2.1 Performance comparison test
Based on three data sets of NSL-KDD, CICIDS2017 and ToN-IoT, this test compares HMG-AID with RF, SVM, CNN-LSTM, GraphSAGE and GAT models, and calculates the average performance indicators through ten-fold cross-validation. The test method includes loading pre-processed data, fixing hyperparameters (learning rate 0.001, batch size 128), and averaging 10 repeated runs to eliminate randomness. The test results are shown in Table 1.
Table 1 Performance comparison test results (average index,%)
| Model | Dataset | Accuracy | Precision | Recall | F1-score |
| RF | NSL-KDD | 88.5 | 87.2 | 86.9 | 87 |
| SVM | NSL-KDD | 85.3 | 84.1 | 83.8 | 83.9 |
| CNN-LSTM | NSL-KDD | 91.2 | 90.5 | 90.3 | 90.4 |
| GraphSAGE | NSL-KDD | 92.8 | 91.9 | 91.7 | 91.8 |
| GAT | NSL-KDD | 93.5 | 92.6 | 92.4 | 92.5 |
| EGAT | NSL-KDD | 93.8 | 93.1 | 92.9 | 93 |
| MTGCN | NSL-KDD | 94.1 | 93.5 | 93.2 | 93.3 |
| HMG-AID | NSL-KDD | 95.7 | 94.9 | 94.6 | 94.7 |
| RF | CICIDS2017 | 89.1 | 88.3 | 88 | 88.1 |
| SVM | CICIDS2017 | 86.4 | 85.2 | 85 | 85.1 |
| CNN-LSTM | CICIDS2017 | 92.5 | 91.8 | 91.5 | 91.6 |
| GraphSAGE | CICIDS2017 | 93.9 | 93.1 | 92.8 | 92.9 |
| GAT | CICIDS2017 | 94.6 | 93.8 | 93.5 | 93.6 |
| EGAT | CICIDS2017 | 94.9 | 94.2 | 93.9 | 94 |
| MTGCN | CICIDS2017 | 95.1 | 94.5 | 94.1 | 94.3 |
| HMG-AID | CICIDS2017 | 96.3 | 95.5 | 95.2 | 95.3 |
| RF | ToN-IoT | 87.8 | 86.5 | 86.2 | 86.3 |
| SVM | ToN-IoT | 84.9 | 83.7 | 83.4 | 83.5 |
| CNN-LSTM | ToN-IoT | 91.8 | 90.9 | 90.6 | 90.7 |
| GraphSAGE | ToN-IoT | 93.2 | 92.3 | 92 | 92.1 |
| GAT | ToN-IoT | 94.1 | 93.2 | 92.9 | 93 |
| EGAT | ToN-IoT | 94.4 | 93.6 | 93.3 | 93.4 |
| MTGCN | ToN-IoT | 94.7 | 93.9 | 93.6 | 93.7 |
| HMG-AID | ToN-IoT | 96.0 | 95.1 | 94.8 | 94.9 |
4.2.2 Robustness test
In this test, the F1 score retention rate of the model under interference is evaluated by injecting Gaussian noise into the test data (signal-to-noise ratio from 10 dB to 5 dB, step size 5 dB) and generating adversarial samples (FGSM attack, perturbation coefficient ). The test method is to repeat the test five times for each noise level or attack intensity and take the average value. The test results are shown in Table 2.
Table 2 Robustness test results (F1 score retention,%)
| Noise | Noise | Noise | Noise | |||
| Models | Dataset | 10 dB | 5 dB | 0 dB | 5 dB | FGSM Attack |
| RF | NSL-KDD | 85.1 | 80.3 | 75.6 | 68.9 | 72.4 |
| CNN-LSTM | NSL-KDD | 88.7 | 85.2 | 80.1 | 74.5 | 78.3 |
| GraphSAGE | NSL-KDD | 90.2 | 87.6 | 83.4 | 78.9 | 82.1 |
| GAT | NSL-KDD | 91 | 88.9 | 85.2 | 80.7 | 84.5 |
| HMG-AID | NSL-KDD | 93.5 | 91.8 | 89.3 | 85.6 | 88.9 |
4.2.3 Practicability test
This test measures the time consumption of the model in the training phase (seconds/epoch) and the latency in the inference phase (milliseconds/sample) and records the GPU memory footprint (MB). The test method is to average 1000 runs on the test set using a fixed batch size of 128, The test results are shown in Table 3.
Due to the integration of multimodal feature extraction, graph NN, and dynamic trust evaluation modules, the HMG-AID model has higher number of parameters (4.2M) and single inference FLOPs (8.7G) than GAT (1.8M, 3.1G) and CNN-LSTM (2.5M, 5.2G). This validates the computational overhead it brings while improving performance.
Table 3 Practicality test results (efficiency index)
| Training | Inference | Memory | ||||
| Time | Latency | Usage | Parameters | FLOPs | ||
| Model | Dataset | (s/epoch) | (ms/sample) | (MB) | (M) | (G) |
| CNN-LSTM | ToN-IoT | 12.5 | 1.8 | 1250 | 2.5 | 5.2 |
| GraphSAGE | ToN-IoT | 15.3 | 2.2 | 1400 | 1.8 | 3.1 |
| GAT | ToN-IoT | 16.8 | 2.5 | 1550 | 1.8 | 3.1 |
| HMG-AID | ToN-IoT | 18.9 | 2.9 | 1700 | 4.2 | 8.7 |
4.2.4 Ablation test
In this test, the influence of each component on F1 score is analyzed by sequentially removing the multi-modal feature fusion module (-Fusion), graph attention mechanism (-GAT) and dynamic trust evaluation (-Trust) in HMG-AID. Furthermore, to verify the necessity of modeling IoT environments as heterogeneous graphs, the “-HeteroGraph” variant is added. In this variant, the type differences in the device metadata are ignored, all nodes are treated as homogeneous, and the same feature initialization is used, while the graph structure is replaced with a simple undirected graph based on communication relationships. The experimental results show that the F1 score further decreases by about 2.1% on average across the three datasets, which confirms that explicit modeling of device type heterogeneity and complex interaction relationships has a significant contribution to improving the heterogeneous IoT ID performance. The test results are shown in Table 4.
Table 4 Ablation test results (F1 score,%)
| Model Variant | NSL-KDD | CICIDS2017 | ToN-IoT |
| HMG-AID (complete) | 94.7 | 95.3 | 94.9 |
| -Fusion | 91.2 | 92.1 | 91.5 |
| -GAT | 92.8 | 93.6 | 93 |
| -Trust | 93.5 | 94.2 | 93.7 |
| -HeteroGraph | 92.6 | 93.2 | 92.8 |
4.2.5 Interpretability test
In this test, Grad-CAM is used to visualize the attention weight of equipment nodes, and the decision-making basis of the model is quantitatively analyzed. The test method includes running the model on the test set, extracting the weight distribution of the attention layer of the graph, generating a heat map to show the contribution of key equipment nodes to ID, and performing statistical analysis. The results are shown in Table 5, and the interpretability test visualization results are shown in Figure 5.
Table 5 Results of interpretability test (attention weight distribution analysis)
| Average | |||||
| Type of | Equipment | Attention | Weight | Top-3 Node | Critical Node |
| Attack | Category | Weight | Variance | Concentration | Detection Rate |
| DDoS Attack | Gateway device | 0.78 | 0.12 | 0.85 | 0.923 |
| Sensor | 0.45 | 0.08 | 0.72 | 0.786 | |
| Camera | 0.51 | 0.09 | 0.69 | 0.752 | |
| Brute force | Gateway device | 0.82 | 0.09 | 0.88 | 0.941 |
| cracking | Sensor | 0.38 | 0.11 | 0.65 | 0.718 |
| Controller | 0.67 | 0.07 | 0.79 | 0.865 | |
| Port scanning | Gateway device | 0.75 | 0.14 | 0.83 | 0.907 |
| Mixing equipment | 0.61 | 0.15 | 0.76 | 0.824 |
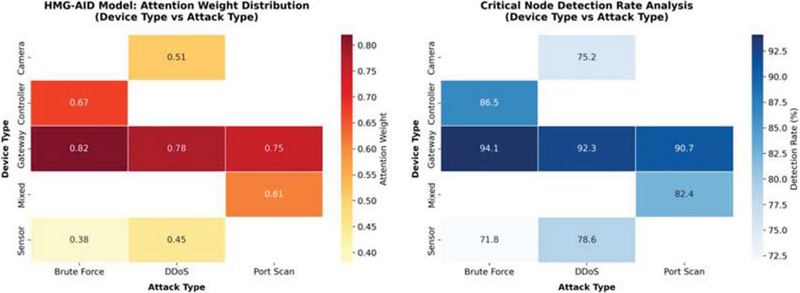
Figure 5 Visualization results of interpretability test.
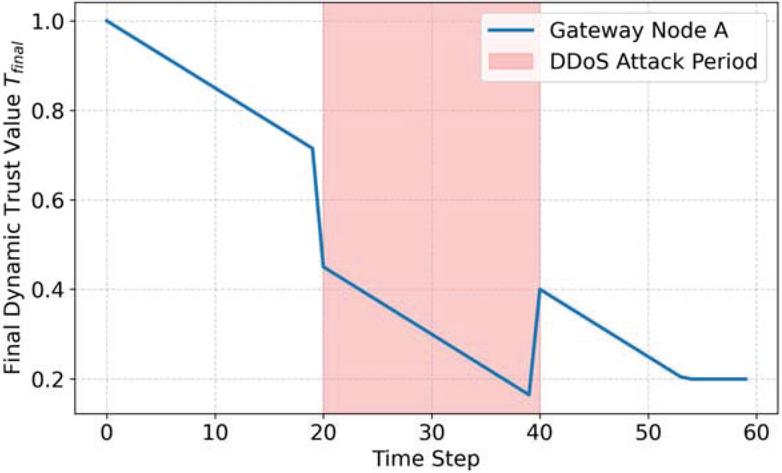
Figure 6 A case study of DDoS attack.
In order to further verify the contribution of the dynamic trust assessment module to the final decision, the influence of trust values at the time of classification is additionally analyzed. Figure 6 shows a case against a DDoS attack. As shown, during the attack occurrence, node A is identified as the gateway device of the attack source, and its dynamic trust value T_final drops significantly as the abnormal traffic persists. In the SoftMax classification layer, the decreased trust value is spliced with the abnormal features extracted by the graph attention module, which together leads to the high confidence classification of the node as “DDoS attack”. This shows that the dynamic trust value, as a quantifiable behavioral risk indicator, effectively complements the judgment based on instantaneous traffic patterns, and enhances the detection ability and decision interpretability of the model for persistent and low-rate attacks.
4.2.6 Scalability test
In order to generate network topologies of different scales, the Barabási-Albert (BA) scale-free network model is employed to simulate IoT device connectivity. The model can generate a graph with power law distribution, which is closer to the heterogeneous IoT scenario in the real world where a small number of devices are connected to many terminal devices. The nodes in the graph represent devices, and the edges are generated based on the priority connection mechanism, whose weight is then calculated according to Equation (4) according to the simulated flow intensity. This method can better reflect the heterogeneous connection characteristics of IoT networks than simple random graphs.
This test aims to verify the ability of the model to handle large-scale heterogeneous IoT networks. The test method measures the F1 score and memory footprint change of HMG-AID and baseline model (GraphSAGE, GAT) during the expansion process by gradually expanding the network scale (the number of device nodes increases from 1000 to 10,000) and injecting the same proportion of attack traffic (the attack ratio was fixed at 15%). Data generation uses a random graph structure to simulate heterogeneous device connections, and each node feature dimension remains consistent with the ToN-IoT dataset (85 dimensions). The test results are shown in Table 6.
Table 6 Scalability test results (equipment size vs. performance metrics)
| Number of | Memory | Training | ||
| Device Nodes | Models | F1 Score (%) | Footprint (GB) | Time (Min/Epoch) |
| 1000 | GraphSAGE | 92.1 | 1.4 | 5.2 |
| GAT | 93 | 1.6 | 6.1 | |
| HMG-AID | 94.9 | 1.8 | 7.3 | |
| 5000 | GraphSAGE | 91.5 | 6.9 | 28.7 |
| GAT | 92.4 | 7.8 | 33.5 | |
| HMG-AID | 94.3 | 8.5 | 39.2 | |
| 10000 | GraphSAGE | 90.2 | 13.1 | 61.4 |
| GAT | 91.3 | 14.7 | 72.8 | |
| HMG-AID | 93.6 | 16.2 | 85.6 |
4.2.7 Real-time test
This test evaluates the real-time processing ability of the model in streaming data environment. The test method simulates real-time traffic input (packet rates from 100/s to 1000/s) and measures the total delay (milliseconds) and throughput (samples/s) of the model from data reception to output prediction. All efficiency tests are conducted in a unified hardware environment: the CPU is Intel Xeon Gold 6248R, the RAM is 128GB, and the GPU is NVIDIA RTX 4090 (24 GB). The software environment is Python 3.9, PyTorch 1.13.1, and all models are tested with GPU acceleration enabled. The measurement of training time versus inference delay excludes data loading and preprocessing time, and only the computational time consumption of model forward versus back propagation (at training time) is counted.
The baseline model selects LW RF and DL model CNN-LSTM as comparison. The test data comes from streaming sampling of the CICIDS2017 dataset, as shown in Table 7.
Table 7 Real-time test results (processing rate vs. efficiency index)
| Packet Rate | Average | Throughput | CPU | |
| (pcs/second) | Models | Delay (ms) | (Samples/Second) | Usage (%) |
| 100 | RF | 12.5 | 80 | 45.2 |
| CNN-LSTM | 18.3 | 54.6 | 62.7 | |
| HMG-AID | 15.7 | 63.7 | 58.3 | |
| 500 | RF | 14.1 | 71 | 68.9 |
| CNN-LSTM | 22.9 | 43.7 | 85.4 | |
| HMG-AID | 18.5 | 54.1 | 76.1 | |
| 1000 | RF | 16.8 | 59.5 | 82.3 |
| CNN-LSTM | 28.4 | 35.2 | 94.6 | |
| HMG-AID | 21.3 | 46.9 | 87.5 |
4.2.8 Generalization experiments across datasets
This test tests the generalization ability of the model in unknown heterogeneous environment. The test method uses the NSL-KDD dataset to train the model, evaluates the performance directly on the CICIDS2017 and ToN-IoT test sets that did not participate in the training, and compares the decline in F1 scores of the baseline models (RF, CNN-LSTM). There are differences in device types and attack categories between the training set and the test set to simulate the distribution shift in reality. The test results are shown in Table 8.
Table 8 Generalization test results across datasets (F1 score,%)
| Training Dataset | Test Dataset | RF | CNN-LSTM | HMG-AID |
| NSL-KDD | CICIDS2017 | 75.3 | 82.1 | 88.7 |
| ToN-IoT | 72.8 | 79.6 | 86.4 | |
| CICIDS2017 | NSL-KDD | 76.9 | 83.5 | 89.2 |
| ToN-IoT | 74.1 | 80.3 | 87.8 |
4.3 Analysis and Discussion
4.3.1 Analysis of experimental results
The performance comparison experiment (Table 1) shows that HMG-AID achieves the highest metrics (such as an F1 score of 94.9% on ToN-IoT) across three datasets, significantly outperforming the baseline model. Especially, its advantage is evident on the IoT-specific dataset, indicating the model’s adaptability to heterogeneous environments. The robustness experiment (Table 2) reveals that HMG-AID maintains the highest F1 score retention under noise and adversarial attacks (such as 85.6% at noise-5 dB), demonstrating its strong anti-interference capability in feature learning. In the practicality experiment (Table 3), although HMG-AID’s efficiency is slightly lower due to model complexity, the latency (2.9 ms/sample) is still within an acceptable range for real-time applications. The ablation experiment (Table 4) confirms that each component contributes significantly, with the performance drop being the largest after removing multimodal fusion (a 3.4% drop on ToN-IoT), highlighting the necessity of feature fusion. Table 5 and Figure 5 further visually display the distribution of attention weights, clearly revealing the model’s focus on abnormal communication paths through heatmaps, enhancing decision transparency and interpretability. The scalability experiment (Table 6) shows that HMG-AID maintains an F1 score of 93.6% even when the device scale is expanded to 10,000 nodes, with a performance drop (1.3%) lower than the baseline model, proving that its graph structure design can effectively adapt to large-scale networks. The real-time experiment (Table 7) indicates that HMG-AID has a latency of 21.3 ms and a throughput of 46.9 samples/second under high-speed data streams, which is better than CNN-LSTM but still lags behind the lighter RF. The results of generalization experiments across datasets (Table 8) show that the average F1 score of HMG-AID has only decreased by 5.8%, indicating that the model has some generalization ability.
4.3.2 Model advantage analysis
The structure of HMG-AID model is designed by multi-level design, and the multi-modal feature extraction module is built to analyze the spatiotemporal feature of data through CNN-LSTM, which has better data feature capture effect than the single model. The graph attention mechanism can effectively identify abnormal communication paths, and the dynamic trust evaluation method improves the sensitivity of the model to slow attacks. These components work together to achieve the balance of accuracy, robustness, scalability and versatility of HMG-AID model in complex heterogeneous IoT environment.
4.3.3 Limitations and future prospects
The limitation of this model mainly lies in its high computational complexity (approximately 4.2M parameters, 8.7G FLOPs), which may cause its deployment difficulty on endpoint IoT devices with strictly constrained computing, storage, and energy consumption resources. Therefore, future research work will focus on exploring the LW and edge adaptation of models. The specific paths include:
(1) Structured pruning and quantization: it is necessary to prune neurons or attention heads with low contribution in the model and quantize the weights with low precision to compress the model volume and reduce the computational overhead.
(2) Knowledge distillation: it is necessary to use the existing HMG-AID as a teacher model to train a student network with a more streamlined structure, so as to achieve model miniaturization on the premise of minimizing performance loss.
(3) Modular edge collaborative reasoning: it is necessary to study the collaborative reasoning framework of sinking the feature extraction module to the edge device and deploying complex graph attention and trust assessment in fog nodes or cloud with stronger computing power to achieve the balance between accuracy and efficiency.
5 Conclusion
In this paper, an intelligent IoT intrusion identification model (HMG-AID) for heterogeneous environments is proposed to deal with intrusion threats in complex heterogeneous IoT environments. The model carries out multi-modal feature extraction through deep integration method, and combines graph attention mechanism and dynamic trust assessment to realize end-to-end dynamic ID. Combined with the experimental research results, it can be seen that the F1 scores of HMG-AID on the NSL-KDD, CICIDS2017 and ToN-IoT datasets are 94.7%, 95.3% and 94.9%, respectively, which is a great improvement compared with the baseline model. The HMG-AID model performs well in rigorous tests such as noise interference, adversarial attack and large-scale network expansion, which provides the theoretical basis and practical framework for constructing accurate and reliable heterogeneous IoT security protection system.
Although the HMG-AID model performed well in the experiments, there were some limitations. The main reason is that the HMG-AID model has high computational complexity, which may lead to problems in the deployment of the model on resource-constrained devices, and the long-term performance of the model in real and dynamically developing heterogeneous IoT systems has not been fully verified. Therefore, future research efforts will focus on LW model design, adaptation to edge computing scenarios, and the introduction of online learning mechanisms to enhance dynamic environment adaptability, so as to further optimize the practicality and vitality of the models.
Funding
2025 Anhui Young Backbone Teachers’ Domestic Visiting Study and Research Program (No.: JNFX2025200).
References
[1] Ferrag, M. A., Maglaras, L., Ahmim, A., Derdour, M., and Janicke, H. (2020). Rdtids: Rules and decision tree-based intrusion detection system for internet-of-things networks. Future Internet, 12(3), 44.
[2] Amouri, A., Alaparthy, V. T., and Morgera, S. D. (2020). A machine learning based intrusion detection system for mobile Internet of Things. Sensors, 20(2), 461.
[3] Abbas, A., Khan, M. A., Latif, S., Ajaz, M., Shah, A. A., and Ahmad, J. (2022). A new ensemble-based intrusion detection system for Internet of Things. Arabian Journal for Science and Engineering, 47(2), 1805–1819.
[4] Nimbalkar, P., and Kshirsagar, D. (2021). Feature selection for intrusion detection system in Internet-of-Things (IoT). ICT Express, 7(2), 177–181.
[5] Abdelmoumin, G., Rawat, D. B., and Rahman, A. (2021). On the performance of machine learning models for anomaly-based intelligent intrusion detection systems for the Internet of Things. IEEE Internet of Things Journal, 9(6), 4280–4290.
[6] Aravamudhan, P., and Krishnan, T. K. (2023). A novel adaptive network intrusion detection system for Internet of Things. PLoS One, 18(4), e0283725.
[7] Xu, H., Sun, Z., Cao, Y., and Bilal, H. (2023). A data-driven approach for intrusion and anomaly detection using automated machine learning for the Internet of Things. Soft Computing, 27(19), 14469–14481.
[8] Alotaibi, Y., and Ilyas, M. (2023). Ensemble-learning framework for intrusion detection to enhance Internet of Things’ devices security. Sensors, 23(12), 5568.
[9] Wang, S., Xu, W., and Liu, Y. (2023). Res-TranBiLSTM: An intelligent approach for intrusion detection in the Internet of Things. Computer Networks, 235, 109982.
[10] Zhao, R., Gui, G., Xue, Z., Yin, J., Ohtsuki, T., Adebisi, B., and Gacanin, H. (2021). A novel intrusion detection method based on lightweight neural network for internet of things. IEEE Internet of Things Journal, 9(12), 9960–9972.
[11] Zohourian, A., Dadkhah, S., Molyneaux, H., Neto, E. C. P., and Ghorbani, A. A. (2024). IoT-PRIDS: Leveraging packet representations for intrusion detection in IoT networks. Computers & Security, 146, 104034.
[12] Jayalaxmi, P. L. S., Saha, R., Kumar, G., Alazab, M., Conti, M., and Cheng, X. (2023). PIGNUS: A Deep Learning model for IDS in industrial Internet-of-Things. Computers & Security, 132, 103315.
[13] Khan, A. R., Kashif, M., Jhaveri, R. H., Raut, R., Saba, T., and Bahaj, S. A. (2022). Deep learning for intrusion detection and security of Internet of things (IoT): current analysis, challenges, and possible solutions. Security and Communication Networks, 2022(1), 4016073.
[14] Soliman, S., Oudah, W., and Aljuhani, A. (2023). Deep learning-based intrusion detection approach for securing industrial Internet of Things. Alexandria Engineering Journal, 81, 371–383.
[15] Dina, A. S., Siddique, A. B., and Manivannan, D. (2023). A deep learning approach for intrusion detection in Internet of Things using focal loss function. Internet of Things, 22, 100699.
[16] Balakrishnan, N., Rajendran, A., Pelusi, D., and Ponnusamy, V. (2021). Deep Belief Network enhanced intrusion detection system to prevent security breach in the Internet of Things. Internet of Things, 14, 100112.
[17] Rahman, S. A., Tout, H., Talhi, C., and Mourad, A. (2020). Internet of Things intrusion detection: Centralized, on-device, or federated learning?. IEEE Network, 34(6), 310–317.
[18] Jiang, Y., and Zhang, J. (2023). Distributed detection over blockchain-aided Internet of Things in the presence of attacks. IEEE Transactions on Information Forensics and Security, 18, 3445–3460.
[19] Tharewal, S., Ashfaque, M. W., Banu, S. S., Uma, P., Hassen, S. M., and Shabaz, M. (2022). Intrusion detection system for industrial Internet of Things based on deep reinforcement learning. Wireless Communications and Mobile Computing, 2022(1), 9023719.
[20] Saheed, Y. K., Abiodun, A. I., Misra, S., Holone, M. K., and Colomo-Palacios, R. (2022). A machine learning-based intrusion detection for detecting Internet of Things network attacks. Alexandria Engineering Journal, 61(12), 9395–9409.
[21] Almohri, H. M., Watson, L. T., and Evans, D. (2020). An attack-resilient architecture for the Internet of Things. IEEE Transactions on Information Forensics and Security, 15, 3940–3954.
[22] Doshi, K., Yilmaz, Y., and Uludag, S. (2021). Timely detection and mitigation of stealthy DDoS attacks via IoT networks. IEEE Transactions on Dependable and Secure Computing, 18(5), 2164–2176.
[23] Gassais, R., Ezzati-Jivan, N., Fernandez, J. M., Aloise, D., and Dagenais, M. R. (2020). Multi-level host-based intrusion detection system for Internet of things. Journal of Cloud Computing, 9(1), 62.
[24] Moustafa, N., Koroniotis, N., Keshk, M., Zomaya, A. Y., and Tari, Z. (2023). Explainable intrusion detection for cyber defences in the Internet of Things: Opportunities and solutions. IEEE Communications Surveys & Tutorials, 25(3), 1775–1807.
[25] Landauer, M., Skopik, F., Frank, M., Hotwagner, W., Wurzenberger, M., and Rauber, A. (2022). Maintainable log datasets for evaluation of intrusion detection systems. IEEE Transactions on Dependable and Secure Computing, 20(4), 3466–3482.
[26] Alani, M. M., and Awad, A. I. (2022). An intelligent two-layer intrusion detection system for the Internet of Things. IEEE Transactions on Industrial Informatics, 19(1), 683–692.
[27] Smys, S., Basar, A., and Wang, H. (2020). Hybrid intrusion detection system for Internet of Things (IoT). Journal of ISMAC, 2(04), 190–199.
Biography

Wei Wu 1982.02, Han Chinese, native of Lujiang, Anhui Province, master, Anhui Vocational College of Grain Engineering, lecturer. Research interests: Electronic Information Technology, Circuit Theory.
Journal of Cyber Security and Mobility, Vol. 15_4, 995–1022
doi: 10.13052/jcsm2245-1439.1548
© 2026 River Publishers