Vulnerable Function Detection Using Lexical and Structural Features: An Empirical Study on PrimeVul and DiverseVul
Jing Wang
School of Humanities and Arts, Xi’an Fanyi University, Xi’an 710105, China
E-mail: JingWang202611@outlook.com
Received 15 April 2026; Accepted 28 May 2026
Abstract
A persistent challenge in software vulnerability detection is the failure of many existing approaches to handle highly imbalanced datasets reliably. In practical vulnerability datasets, vulnerable functions usually account for only a small proportion of all samples, which makes model evaluation highly sensitive to feature representation, threshold selection, and class distribution. To address this issue, this study proposes a lightweight feature-based detection pipeline for function-level vulnerability detection. The implemented method combines TF-IDF lexical features with numerical code-statistical features and evaluates several conventional machine-learning classifiers under a unified experimental protocol. PrimeVul is used as the primary dataset, while DiverseVul is introduced for external cross-dataset validation. The experiments include baseline comparison, feature ablation, threshold selection, sensitivity analysis, random-seed stability testing, imbalance-handling evaluation, and cross-dataset assessment. The results show that the proposed feature-based pipeline achieves stable performance under highly imbalanced settings. On the PrimeVul test set, the best configuration achieves an accuracy of approximately 0.9697, an F1-score in the range of 0.26–0.27, and a ROC-AUC above 0.83. The external evaluation on DiverseVul further indicates that the learned feature representation retains a certain degree of cross-dataset generalization. These findings suggest that carefully designed lightweight feature representations, combined with systematic multi-metric evaluation, can provide a reproducible and interpretable baseline for practical software vulnerability detection.
Keywords: Software vulnerability detection, imbalanced learning, feature representation, cross-dataset generalization.
1 Introduction
As the scale of software systems continues to expand and open-source development accelerates, source-code vulnerabilities have become a major threat to software reliability and system security. This problem is especially prominent in C/C++ system software, where manual memory management and flexible syntax make defects difficult to locate. Traditional manual review and rule-based static analysis are costly and often insufficient for complex real-world code. Therefore, more automated and intelligent vulnerability-detection technologies are needed [1].
Recent deep-learning-based vulnerability detection studies have improved automated source-code analysis. Early methods mainly used sequence models to represent code, including VulDeePecker and SySeVR [2, 3]. These methods can extract lexical and local contextual features from code fragments. However, their sequence-based representation is limited in modelling structural information in programs. Later studies introduced graph-based neural networks for program semantics, such as Design, DeepWukong, and ReGVD [4–6]. These methods use abstract syntax trees, control-flow graphs, or program dependencies to strengthen semantic representation [7]. With the development of pre-trained code models, studies based on CodeBERT and GraphCodeBERT have also improved generalization, including VulBERTa [8], VulDeBERT, and SCL-CVD [9]. Large-scale vulnerability datasets provide an important basis for model development and performance evaluation. BigVul, DiverseVul, and PrimeVul are commonly used benchmark datasets for source-code vulnerability detection. Although existing approaches achieve promising results on individual datasets [10], two issues remain unresolved. First, many methods have difficulty identifying vulnerability-related information under highly imbalanced class distributions. Second, distribution differences across datasets may weaken generalization when models are applied to external scenarios [11].
To address the above problems, this paper will focus on function-level source-code vulnerability detection under highly imbalanced data. Instead of building a large-scale graph neural network, we will design a feature-based detection pipeline by combining lexical representations and lightweight numerical code statistics. TF-IDF features are generated on tokenized source code to capture discriminating lexical patterns, and basic structural characteristics of functions are described by numerical features. Several machine-learning classifiers have been trained using the same preprocessing, threshold selection and testing protocols, such as logistic regression, random forest, gradient boosting, LinearSVC, and XGBoost. PrimeVul is selected as the main dataset, and DiverseVul is used for external cross-dataset validation. This study is to determine whether well-engineered feature representations and systematic evaluations can achieve strong vulnerability-detection performance without the need for unsupported graph-based modules.
2 Relevant Research
2.1 Deep Learning-Based Vulnerability Detection
Early studies on software vulnerability detection mainly relied on sequence-based deep learning models [12]. Representative methods include VulDeePecker, SySeVR, and VulDeePecker [13]. These methods usually transform source code or vulnerability-related code fragments into token sequences and then use neural encoders to learn latent representations for vulnerability classification. Their main advantage is that they can automatically capture lexical and local contextual patterns from source code without relying entirely on manual rule design. However, sequence-based models mainly represent source code as ordered token streams. As a result, they may have limited ability to model complex program relationships, such as control dependence, data dependence, and long-range semantic interactions. This limitation has motivated later studies to explore more expressive code representations, including graph-based models, pre-trained code models, and feature-fusion methods. Although these deep-learning-based approaches provide an important foundation for automated vulnerability detection, their performance can still be affected by dataset imbalance, threshold selection, and cross-dataset distribution differences
| (1) |
where denotes a neural network (e.g., CNN or RNN). The final vulnerability prediction is obtained via
| (2) |
Such methods do not consider the structural dependence of codes and cannot reveal semantic relationships well.
2.2 Graph-Based Vulnerability Detection
To better capture program structure, graph-based vulnerability detection methods have been widely investigated. Representative studies include Design, which learns program semantics through graph neural networks, DeepWukong, which applies deep graph neural networks for static vulnerability detection, and ReGVD, which revisits graph neural networks for vulnerability detection [14]. These methods usually represent source code using graph structures derived from abstract syntax trees, control-flow graphs, data-flow graphs, or program dependence graphs [15]. By applying graph neural networks, they can aggregate information from neighboring nodes and learn structural representations of code [4–6]. Compared with sequence-based models, graph-based methods are more suitable for modelling dependencies among program elements [16–18]. Nevertheless, they usually require additional graph construction procedures and more complex model architectures. Since the present study does not implement a graph neural network or a semantic dependency graph, these methods are discussed here only as related work and comparative background
| (3) |
where denotes the neighbors of node . After multiple layers, a graph-level representation is obtained via pooling
| (4) |
Although these methods are effective in modelling program structures, they often require additional graph construction procedures and more complex model architectures.
2.3 Pre-Trained Models for Code Representation
Recent studies have also applied pre-trained code models to vulnerability detection. Representative studies include LineVul, VulBERTa, VulDeBERT, and SCL-CVD [19]. These methods learn contextual representations from source-code corpora and use them to improve vulnerability detection at different granularities, such as function-level or line-level prediction [20]. Compared with models trained from scratch, pre-trained code models can provide stronger semantic representations and may improve generalization across different vulnerability detection tasks. However, their performance can still be affected by highly imbalanced datasets, where vulnerable functions account for only a small proportion of all samples. In addition, their effectiveness may depend on fine-tuning strategies, threshold selection, and dataset distribution [21, 22]. These issues motivate the need for systematic evaluation under realistic imbalanced settings
| (5) |
and transform it into a function-based form
| (6) |
Although pre-trained models can improve generalization, they mainly learn implicit code representations and may still be affected by dataset imbalance, fine-tuning strategies, threshold selection, and distribution shifts.
2.4 Feature Fusion-Based Methods
Feature fusion has been used to combine complementary information from different code representations. Existing studies have explored the integration of sequence features, graph embeddings, structural representations, and multimodal code features to improve source-code vulnerability detection performance [23]. The motivation behind feature fusion is that different feature types may capture different aspects of vulnerable code. For example, lexical features can reflect token-level patterns, while structural or statistical features can describe function-level code characteristics. Previous studies have shown that combining multiple feature views can improve the representation ability of vulnerability detection models [24]. However, complex fusion architectures may also increase computational cost and reduce interpretability. In this study, we adopt a lightweight feature-based pipeline that combines TF-IDF lexical features with numerical code statistics [25–27]. This design is consistent with the actual implementation and allows us to evaluate whether simple but carefully constructed feature representations can provide stable vulnerability detection performance under imbalanced and cross-dataset settings.
| (7) |
where denotes a fusion function (e.g., concatenation or attention-based fusion)
| (8) |
Finally, it is predicted that
| (9) |
Most of the existing fusion methods fail to explicitly consider the semantic dependencies among paths in vulnerability analysis [28].
Figure 1 Illustrates a typical sequence-based vulnerability detection framework. The source code is first transformed into token embeddings, which are then encoded by neural models (e.g., RNN or CNN) to learn latent representations [29]. Based on the learned feature vector , the final prediction is obtained through a sigmoid classifier . However, such methods mainly rely on sequential representations and fail to capture structural and semantic dependency information in code [30], which limits their effectiveness in modeling complex vulnerability patterns (see Figure 1).
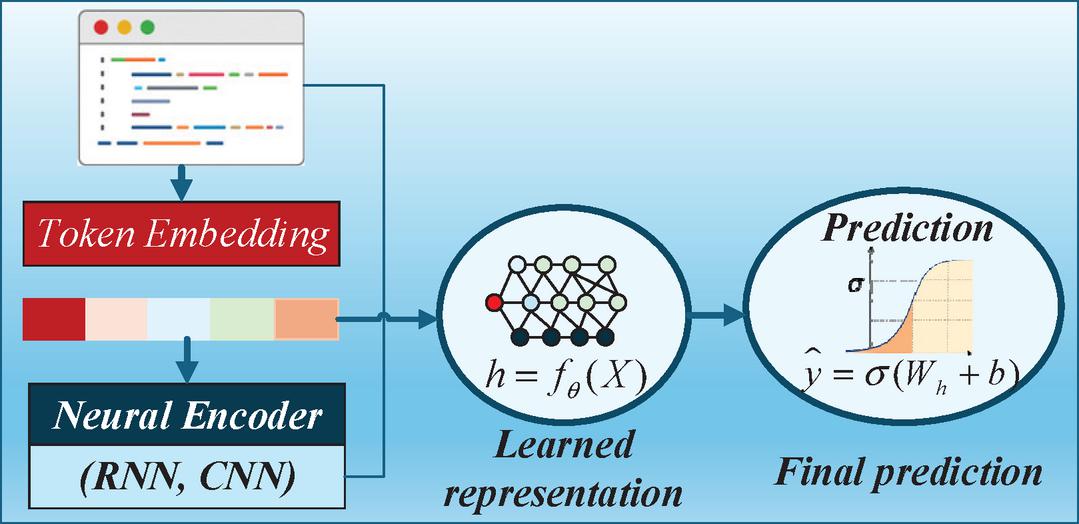
Figure 1 Sequence-based vulnerability detection framework.
3 Experiments
3.1 Experimental Arrangement
All experiments were conducted under the same experimental environment, including data preprocessing, feature extraction, model training, threshold selection, and result evaluation. All models were evaluated using the official training, validation, and test splits provided by PrimeVul. To further validate cross-dataset generalization, the model trained on PrimeVul was directly applied to DiverseVul without fine-tuning.
Table 1 presents the experimental environment adopted for this study. All experiments were carried out in a Windows 11 environment using Python version 3.11. The primary baseline model implementation in scikit-learn, and additionally compared with another method using XGBoost. PrimeVul was selected as the primary test case because it has provided an official pre-defined train/val/test partition for functions-based vulnerability detections in C/C++ programs. DiverseVul was used for cross-dataset external validation to evaluate the generalization ability. CleanVul was only used as an additional candidate set, so it did not appear in the final binary assessment because of the current size limitation.
Table 1 Experiment environment configuration
| Category | Configuration |
| Operating System | Windows 11 |
| CPU | Intel Core i7 |
| Memory | 16 GB RAM |
| Programming Language | Python 3.11 |
| Development Tool | PyCharm |
| Data Processing | Pandas, NumPy |
| Machine Learning | Scikit-learn |
| Visualization | Matplotlib |
3.2 Dataset and Evaluation Scheme
PrimeVul was used as the primary dataset in this study. Its official training, validation, and test splits were adopted to evaluate different models. Because the dataset is highly imbalanced, accuracy, precision, recall, F1-score, Macro-F1, Weighted-F1, ROC-AUC, and PR-AUC were reported together. Among these metrics, F1-score and PR-AUC were emphasized because they are more informative for evaluating detection performance on the minority vulnerable class. To assess cross-dataset robustness, the model trained on PrimeVul was directly evaluated on DiverseVul using the threshold selected on the PrimeVul validation set.
Table 2 Statistics of the PrimeVul dataset used in this study
| Split | Total Samples | Non-vulnerable | Vulnerable | Vulnerable Ratio | Split |
| Training | 175,797 | 170,935 | 4,862 | 2.77% | Training |
| Validation | 23,948 | 23,355 | 593 | 2.48% | Validation |
| Test | 24,788 | 24,239 | 549 | 2.21% | Test |
| Total | 224,533 | 218,529 | 6,004 | 2.67% | Total |
PrimeVul was selected as the primary reference dataset because it provides official training, validation, and test splits for function-level vulnerability detection in C/C++ programs. After preprocessing, the experimental dataset contained 224,533 functions, including 218,529 non-vulnerable samples and 6004 vulnerable samples.
3.3 Features Modelling and Baseline Test
Two types of feature representations were constructed to describe source-code functions from complementary perspectives. First, TF-IDF lexical features were extracted from tokenized source code to represent token importance and lexical distribution. Second, numerical code-statistical features were extracted to describe basic function-level characteristics. Based on these two feature types, three settings were compared under the same experimental protocol: TF-IDF only, numerical features only, and TF-IDF plus numerical features. The main experiments, ablation study, parameter sensitivity analysis, random-seed stability test, and imbalance-handling experiments were then conducted to evaluate how feature representations and model configurations affect vulnerability detection performance.
| Algorithm 1 Core procedure of the proposed vulnerability detection framework |
| Input: PrimeVul dataset, DiverseVul dataset |
| Output: Predicted vulnerability labels and evaluation results |
| 1: Load and preprocess the source code samples from PrimeVul. |
| 2: Perform tokenization and extract TF-IDF lexical features . |
| 3: Extract numeric structural features from source code statistics. |
| 4: Construct feature representations: , , and . |
| 5: Train baseline models (LR, RF, GB, LinearSVC, XGBoost) on . |
| 6: For each model, tune hyperparameters and select optimal threshold on . |
| 7: Apply the trained model with threshold on to obtain predictions. |
| 8: Compute evaluation metrics: Accuracy, Precision, Recall, F1-score, Macro-F1, Weighted-F1, ROC-AUC, and PR-AUC. |
| 9: Perform ablation studies on different feature settings. |
| 10: Conduct sensitivity analysis and stability analysis under different hyperparameters and random seeds. |
| 11: Apply the trained model directly on Dext for cross-dataset evaluation. |
| 12: Output final experimental results and analysis. |
This section briefly explains the actual feature construction and baseline evaluation procedure used in this study. The implemented pipeline does not construct program dependency graphs or train graph neural networks. Instead, it uses TF-IDF lexical features, numerical code-statistical features, and conventional machine-learning classifiers to evaluate vulnerability detection performance under imbalanced data conditions. Three feature settings are compared, namely TF-IDF only, numerical features only, and TF-IDF plus numerical features. The models are trained on the PrimeVul training set, the decision threshold is selected on the validation set, and the final performance is evaluated on the PrimeVul test set and the DiverseVul external dataset.
Table 3 Performance comparison of baseline models on the validation set
| Model | Threshold | Accuracy | Precision | Recall | F1-score |
| Logistic Regression | 0.85 | 0.9550 | 0.2068 | 0.2884 | 0.2408 |
| Random Forest | 0.20 | 0.9635 | 0.2727 | 0.2833 | 0.2779 |
| Gradient Boosting | 0.15 | 0.9636 | 0.2504 | 0.2361 | 0.2431 |
| LinearSVC | 0.65 | 0.9470 | 0.1712 | 0.2968 | 0.2171 |
Table 4 Comparison of model performance metrics in the test set
| Model | Threshold | Accuracy | Precision | Recall | F1-score | Macro-F1 | Weighted-F1 | ROC-AUC | PR-AUC |
| Logistic Regression | 0.85 | 0.9538 | 0.1825 | 0.3115 | 0.2301 | 0.6032 | 0.9597 | 0.8304 | 0.1413 |
| Random Forest | 0.20 | 0.9670 | 0.2527 | 0.2514 | 0.2521 | 0.6176 | 0.9669 | 0.8341 | 0.1815 |
| Gradient Boosting | 0.15 | 0.9648 | 0.2318 | 0.2550 | 0.2428 | 0.6124 | 0.9656 | 0.8468 | 0.1537 |
| LinearSVC | 0.65 | 0.9453 | 0.1535 | 0.3260 | 0.2087 | 0.5902 | 0.9548 | 0.8034 | 0.1229 |
4 Results
4.1 Base-line Performance Comparison
Tables 3 and 4 present the validation and test results of the baseline models on PrimeVul under the same experimental conditions. On the validation set, logistic regression achieved an accuracy of 0.9550, a precision of 0.2068, a recall of 0.2884, and an F1-score of 0.2408 at a threshold of 0.85. The random forest classifier achieved a validation accuracy of 0.9635, with a precision of 0.2727, a recall of 0.2833, and an F1-score of 0.2779 at a threshold of 0.20. Gradient boosting achieved an accuracy of 0.9636, with a precision of 0.2504, a recall of 0.2361, and an F1-score of 0.2431 at a threshold of 0.15. LinearSVC achieved an accuracy of 0.9470, a precision of 0.1712, a recall of 0.2968, and an F1-score of 0.2171 at a threshold of 0.65.
On the test set, logistic regression achieved an accuracy of 0.9538, a precision of 0.1825, a recall of 0.3115, and an F1-score of 0.2301. Its Macro-F1, Weighted-F1, ROC-AUC, and PR-AUC values were 0.6032, 0.9597, 0.8304, and 0.1413, respectively. Random forest achieved an accuracy of 0.9670, with a precision of 0.2527, a recall of 0.2514, and an F1-score of 0.2521. Its Macro-F1 and Weighted-F1 values were 0.6176 and 0.9669, while its ROC-AUC and PR-AUC values were 0.8341 and 0.1815. Gradient Boosting achieved an accuracy of 0.9648, with a precision of 0.2318, a recall of 0.2550, and an F1-score of 0.2428. Its Macro-F1 and Weighted-F1 values were 0.6124 and 0.9656, respectively, while the ROC-AUC and PR-AUC values were 0.8468 and 0.1537.
LinearSVC achieved an accuracy of 0.9453. Its precision, recall, and F1-score were 0.1535, 0.3260, and 0.2087, respectively. Its Macro-F1, Weighted-F1, ROC-AUC, and PR-AUC values were 0.5902, 0.9548, 0.8034, and 0.1229, respectively.
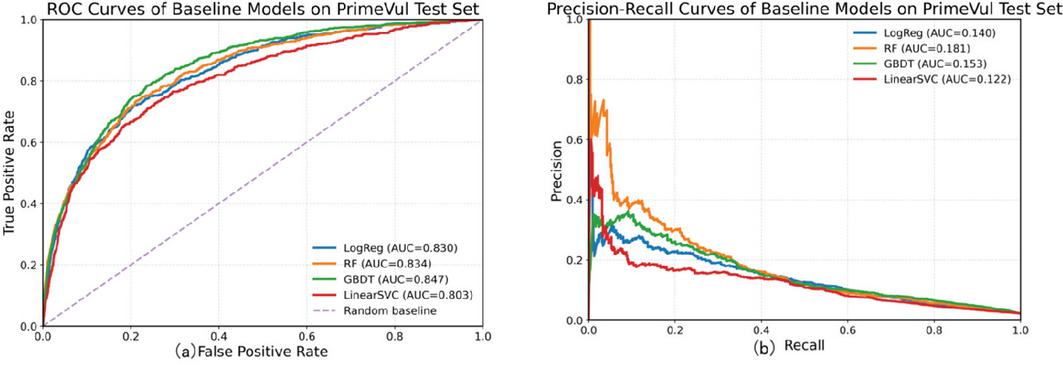
Figure 2 (a) ROC curves and (b) Precision-Recall curves of baseline models on the PrimeVul test set.
The validation and test results cover several evaluation metrics, including threshold-dependent precision, recall, F1-score, ROC-AUC, and PR-AUC. Tables 3 and 4 present the full results. Figure 2 shows the ROC and precision-recall curves for all baseline models on the PrimeVul test set. The ROC curve depicts the relationship between the true-positive rate and false-positive rate across different thresholds. The precision-recall curve provides a more informative view of model behavior under class imbalance.
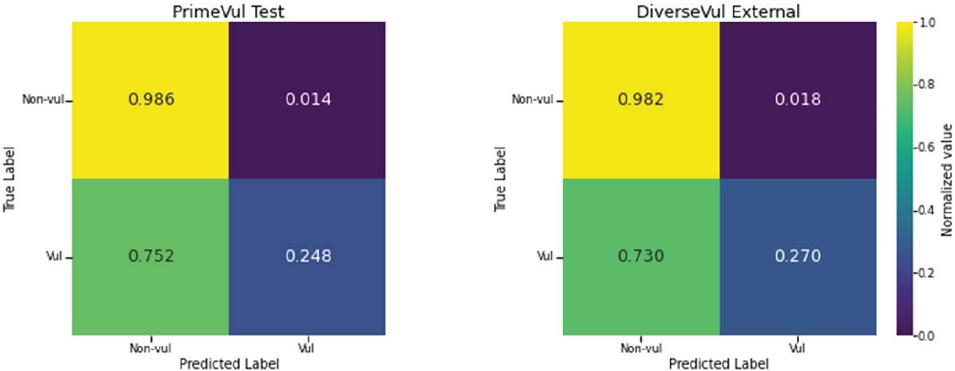
Figure 3 Confusion matrices (raw sample counts) for the Random Forest model at both the PrimeVul test set and the DiverseVul external dataset levels.
Figure 3 shows the confusion matrices of the Random Forest model’s predictions on both sets: PrimeVul test set and DiverseVul external datasets with raw sample counts. In contrast to normalized matrices, this one provides a clearer visualization of the classification outcomes for each category directly. In the PrimeVul test set, most non-vulnerable samples were correctly identified. Only a small proportion of non-vulnerable samples were incorrectly labelled as vulnerable. For vulnerable samples, the model correctly identified part of the minority class, while the remaining vulnerable samples were still predicted as non-vulnerable. The same type of pattern appears in another data set, DiverseVul External. Confusion matrices offer a visual representation of the behavior classes at both in-domain and out-of-domain testing stages.
4.2 Feature Effects and Ablation Studies
Table 5 shows the ablation results on the PrimeVul validation set. The TF-IDF-only setting achieved an accuracy of 0.9654, a precision of 0.2942, a recall of 0.2833, and an F1-score of 0.2887. Its Macro-F1 and Weighted-F1 values were 0.6355 and 0.9651, respectively. Its ROC-AUC and PR-AUC values were 0.8208 and 0.1938, respectively. The numerical-only setting achieved an accuracy of 0.9565, a precision of 0.2157, a recall of 0.2867, and an F1-score of 0.2462. Its Macro-F1 and Weighted-F1 values were 0.6119 and 0.9595, while its ROC-AUC and PR-AUC values were 0.7973 and 0.1703. The combined TF-IDF plus numerical feature setting achieved an accuracy of 0.9635, a precision of 0.2727, a recall of 0.2833, and an F1-score of 0.2779. Its Macro-F1, Weighted-F1, ROC-AUC, and PR-AUC values were 0.6296, 0.9639, 0.8236, and 0.1942, respectively.
Table 5 Ablation results of the PrimeVul validation set
| Feature | |||||||||
| Setting | Threshold | Accuracy | Precision | Recall | F1-score | Macro-F1 | Weighted-F1 | ROC-AUC | PR-AUC |
| TF-IDF only | 0.20 | 0.9654 | 0.2942 | 0.2833 | 0.2887 | 0.6355 | 0.9651 | 0.8208 | 0.1938 |
| Numeric only | 0.15 | 0.9565 | 0.2157 | 0.2867 | 0.2462 | 0.6119 | 0.9595 | 0.7973 | 0.1703 |
| TF-IDF + Numeric | 0.20 | 0.9635 | 0.2727 | 0.2833 | 0.2779 | 0.6296 | 0.9639 | 0.8236 | 0.1942 |
Table 6 presents the ablation results on the PrimeVul test set. The TF-IDF-only setting achieved an accuracy of 0.9695, a precision of 0.2833, a recall of 0.2477, and an F1-score of 0.2643. Its Macro-F1 and Weighted-F1 values were 0.6244 and 0.9685, respectively. Its ROC-AUC and PR-AUC values were 0.8282 and 0.1868, respectively.
Table 6 Ablation results of the PrimeVul test set
| Feature | |||||||||
| Setting | Threshold | Accuracy | Precision | Recall | F1-score | Macro-F1 | Weighted-F1 | ROC-AUC | PR-AUC |
| TF-IDF only | 0.20 | 0.9695 | 0.2833 | 0.2477 | 0.2643 | 0.6244 | 0.9685 | 0.8282 | 0.1868 |
| Numeric only | 0.15 | 0.9568 | 0.1891 | 0.2896 | 0.2288 | 0.6033 | 0.9612 | 0.8235 | 0.1628 |
| TF-IDF + Numeric | 0.20 | 0.9670 | 0.2527 | 0.2514 | 0.2521 | 0.6176 | 0.9669 | 0.8341 | 0.181 |
The numerical-only setting achieved an accuracy of 0.9568, a precision of 0.1891, a recall of 0.2896, and an F1-score of 0.2288. Its Macro-F1, Weighted-F1, ROC-AUC, and PR-AUC values were 0.6033, 0.9612, 0.8235, and 0.1628, respectively. The combined TF-IDF plus numerical feature setting achieved an accuracy of 0.9670, a precision of 0.2527, a recall of 0.2514, and an F1-score of 0.2521. Its Macro-F1, Weighted-F1, ROC-AUC, and PR-AUC values were 0.6176, 0.9669, 0.8341, and 0.1810, respectively.
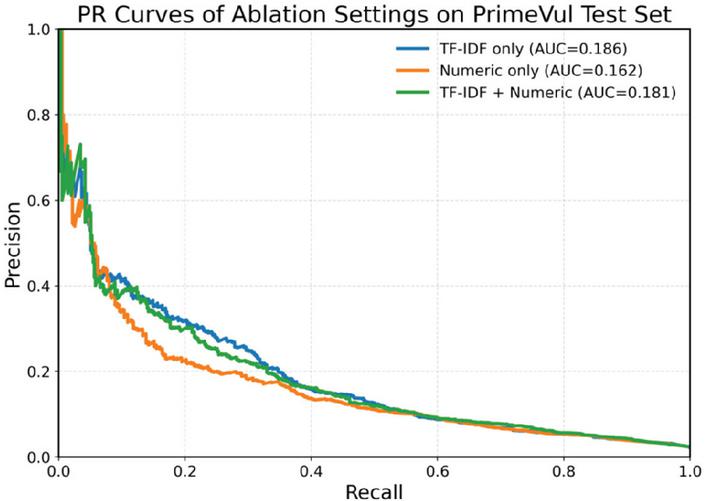
Figure 4 Precision-Recall curves for various feature configurations on the PrimeVul test set.
Figure 4 shows the precision-recall curves for different feature configurations on the PrimeVul test set. The curves correspond to three settings: TF-IDF only, numerical features only, and TF-IDF plus numerical features. The PR-AUC values of the three settings were 0.186, 0.162, and 0.181, respectively. Across the recall range, precision generally decreased as recall increased. In the low-recall region, relatively higher precision values were observed. In the high-recall region, all configurations converged to lower precision values. The TF-IDF-only setting maintained relatively higher precision at most recall levels, while the numerical-only setting showed weaker precision. The combined feature setting produced performance between the two individual feature settings.
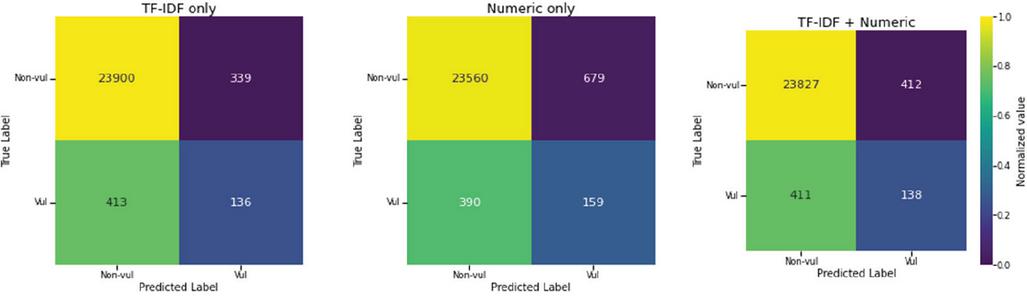
Figure 5 Raw sample count confusion matrix for various feature setting types in the PrimeVul test set.
Figure 5 presents the raw-count confusion matrices for different feature settings on the PrimeVul test set. The TF-IDF-only setting correctly classified most non-vulnerable samples and achieved a true-positive rate of approximately 24.8% for vulnerable samples. The numerical-only setting identified approximately 29.0% of vulnerable samples, but it produced weaker overall discrimination. The combined TF-IDF plus numerical feature setting correctly identified approximately 25.1% of vulnerable samples, while 74.9% were still misclassified as non-vulnerable. Figure 5 displays the raw-count confusion matrices for the three feature configurations on the PrimeVul test set. Compared with normalized matrices, raw-count matrices present the classification outcomes more directly. Most non-vulnerable samples were accurately identified across the three settings, whereas vulnerable samples remained difficult to detect. The TF-IDF-only and combined feature settings showed similar patterns, while the numerical-only setting performed less consistently.
4.3 Cross-Dataset Generalization Analysis
Table 7 presents the cross-dataset evaluation results. A fixed threshold of 0.20, derived from the validation data, was applied consistently across all test runs without recalibration. On the PrimeVul validation set, the model achieved an accuracy of 0.9654, a precision of 0.2942, a recall of 0.2833, and an F1-score of 0.2887. On the PrimeVul test set, it achieved an accuracy of 0.9695, a precision of 0.2833, a recall of 0.2477, and an F1-score of 0.2643.
Table 7 Cross-dataset evaluation results of the random forest model trained on PrimeVul
| Evaluation | |||||||||
| Split | Threshold | Accuracy | Precision | Recall | F1-score | Macro-F1 | Weighted-F1 | ROC-AUC | PR-AUC |
| PrimeVul Validation | 0.20 | 0.9654 | 0.2942 | 0.2833 | 0.2887 | 0.6355 | 0.9651 | 0.8208 | 0.1938 |
| PrimeVul Test | 0.20 | 0.9695 | 0.2833 | 0.2477 | 0.2643 | 0.6244 | 0.9685 | 0.8282 | 0.1868 |
| DiverseVul External Validation | 0.20 | 0.9411 | 0.4758 | 0.2700 | 0.3445 | 0.6569 | 0.9334 | 0.7688 | 0.3565 |
On the DiverseVul external dataset, the model achieved an accuracy of 0.9411, a precision of 0.4758, a recall of 0.2700, and an F1-score of 0.3445. Its Macro-F1, Weighted-F1, ROC-AUC, and PR-AUC values were 0.6569, 0.9334, 0.7688, and 0.3565, respectively. Figure 6 shows the ROC and precision-recall curves for cross-dataset evaluation. Under the same decision threshold, these curves demonstrate the performance variation across different datasets.
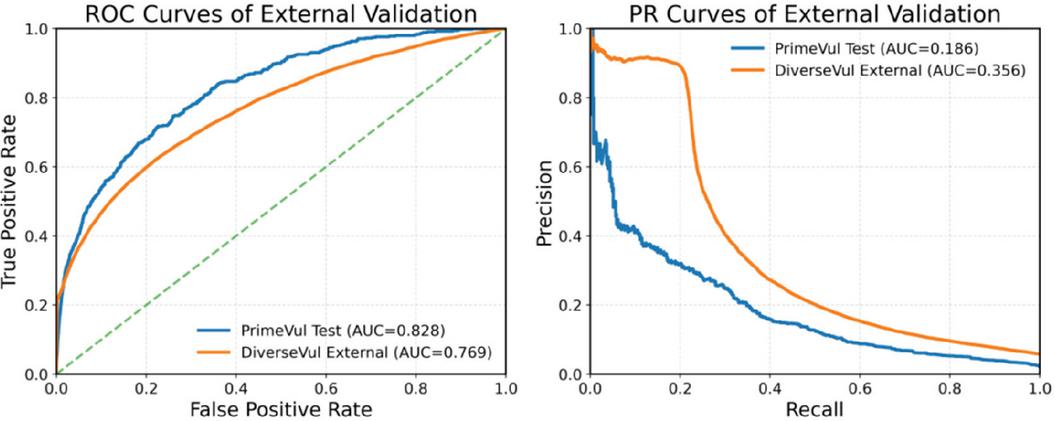
Figure 6 ROC and Precision-Recall curves on cross-dataset evaluation.
4.4 Robustness and Sensitivity Analysis
Table 8 presents the sensitivity analysis results for random forest hyperparameters, including the number of estimators, maximum tree depth, and decision threshold. When the maximum depth was not limited, the model remained stable across different numbers of estimators. Its accuracy ranged from 0.9680 to 0.9697, and its F1-score ranged from 0.2643 to 0.2718. The ROC-AUC and PR-AUC values ranged from 0.8068 to 0.8351 and from 0.1747 to 0.1903, respectively. When max_depth was set to 30, 20, or 10, the selected thresholds and performance metrics varied across configurations. Shallower trees generally required higher decision thresholds and produced different precision-recall trade-offs. These results show that hyperparameter settings influence precision, recall, and F1-score, while the overall performance distribution remains within a limited range.
Table 8 Sensitivity analysis of the random forest hyperparameter in the PrimeVul test set
| n_ | max_ | Test | Test | Test | Test | Test | Test | Test | ||
| estimators | depth | Threshold | Accuracy | Precision | Recall | F1-score | Macro-F1 | Weighted-F1 | ROC-AUC | PR-AUC |
| 100 | None | 0.20 | 0.9680 | 0.2698 | 0.2605 | 0.2651 | 0.6244 | 0.9677 | 0.8068 | 0.1747 |
| 200 | None | 0.20 | 0.9693 | 0.2846 | 0.2550 | 0.2690 | 0.6266 | 0.9685 | 0.8190 | 0.1820 |
| 300 | None | 0.20 | 0.9695 | 0.2833 | 0.2477 | 0.2643 | 0.6244 | 0.9685 | 0.8282 | 0.1868 |
| 500 | None | 0.20 | 0.9697 | 0.2911 | 0.2550 | 0.2718 | 0.6282 | 0.9688 | 0.8351 | 0.1903 |
| 100 | 30 | 0.35 | 0.9572 | 0.2023 | 0.3169 | 0.2470 | 0.6125 | 0.9618 | 0.8387 | 0.1744 |
| 200 | 30 | 0.30 | 0.9369 | 0.1542 | 0.4117 | 0.2243 | 0.5957 | 0.9507 | 0.8451 | 0.1791 |
| 300 | 30 | 0.40 | 0.9680 | 0.2565 | 0.2332 | 0.2443 | 0.6140 | 0.9673 | 0.8489 | 0.1811 |
| 500 | 30 | 0.35 | 0.9593 | 0.2184 | 0.3242 | 0.2610 | 0.6200 | 0.9632 | 0.8496 | 0.1809 |
| 100 | 20 | 0.50 | 0.9589 | 0.1940 | 0.2714 | 0.2263 | 0.6026 | 0.9622 | 0.8452 | 0.1588 |
| 200 | 20 | 0.55 | 0.9698 | 0.2512 | 0.1840 | 0.2124 | 0.5985 | 0.9675 | 0.8476 | 0.1619 |
| 300 | 20 | 0.55 | 0.9692 | 0.2476 | 0.1913 | 0.2158 | 0.6001 | 0.9673 | 0.8492 | 0.1646 |
| 500 | 20 | 0.55 | 0.9697 | 0.2578 | 0.1967 | 0.2231 | 0.6038 | 0.9677 | 0.8510 | 0.1678 |
| 100 | 10 | 0.65 | 0.9487 | 0.1632 | 0.3188 | 0.2159 | 0.5947 | 0.9567 | 0.8406 | 0.1376 |
| 200 | 10 | 0.65 | 0.9482 | 0.1625 | 0.3224 | 0.2161 | 0.5947 | 0.9564 | 0.8420 | 0.1424 |
| 300 | 10 | 0.65 | 0.9482 | 0.1639 | 0.3260 | 0.2182 | 0.5957 | 0.9565 | 0.8431 | 0.1434 |
| 500 | 10 | 0.65 | 0.9482 | 0.1638 | 0.3260 | 0.2180 | 0.5956 | 0.9565 | 0.8430 | 0.1437 |
Table 11 reports the stability analysis under different random seeds. Across five random seeds, accuracy ranged from 0.9535 to 0.9697. Precision ranged from 0.1939 to 0.2833, and recall ranged from 0.2350 to 0.3661. F1-score ranged from 0.2490 to 0.2652, while Macro-F1 ranged from 0.6125 to 0.6244. Mean accuracy was 0.9634 0.0083, and mean F1-score was 0.2595 0.0070. Mean ROC-AUC and PR-AUC values were 0.8280 and 0.1844, respectively. These relatively small variations indicate that the model is not overly sensitive to random initialization.
Table 9 Stability analysis of the random forest model under different random seeds in the PrimeVul test set
| Seed | Threshold | Accuracy | Precision | Recall | F1-score | Macro-F1 | Weighted-F1 | ROC-AUC | PR-AUC |
| 42 | 0.20 | 0.9695 | 0.2833 | 0.2477 | 0.2643 | 0.6244 | 0.9685 | 0.8282 | 0.1868 |
| 52 | 0.20 | 0.9693 | 0.2816 | 0.2477 | 0.2636 | 0.6240 | 0.9684 | 0.8251 | 0.1816 |
| 62 | 0.20 | 0.9697 | 0.2798 | 0.2350 | 0.2554 | 0.6200 | 0.9684 | 0.8254 | 0.1824 |
| 72 | 0.15 | 0.9551 | 0.2079 | 0.3661 | 0.2652 | 0.6210 | 0.9611 | 0.8382 | 0.1881 |
| 82 | 0.15 | 0.9535 | 0.1939 | 0.3479 | 0.2490 | 0.6125 | 0.9599 | 0.8232 | 0.1835 |
| Mean Std | 0.18 0.03 | 0.9634 0.0083 | 0.2493 0.0445 | 0.2889 0.0627 | 0.2595 0.0070 | 0.6204 0.0048 | 0.9652 0.0044 | 0.8280 0.0060 | 0.1844 0.0028 |
Table 10 Impact of imbalance handling strategies on the PrimeVul test set
| Imbalance Setting | Training Size | Threshold | Accuracy | Precision | Recall | F1-score | Macro-F1 | Weighted-F1 | ROC-AUC | PR-AUC |
| Baseline | 175,797 | 0.20 | 0.9695 | 0.2833 | 0.2477 | 0.2643 | 0.6244 | 0.9685 | 0.8282 | 0.1868 |
| Undersample (1:3) | 19,448 | 0.55 | 0.9581 | 0.2051 | 0.3097 | 0.2467 | 0.6126 | 0.9623 | 0.8489 | 0.1572 |
| Oversample (1:3) | 185,521 | 0.15 | 0.9662 | 0.2576 | 0.2787 | 0.2677 | 0.6252 | 0.9669 | 0.8244 | 0.1902 |
| Oversample (1:5) | 195,245 | 0.15 | 0.9618 | 0.2308 | 0.3115 | 0.2651 | 0.6227 | 0.9645 | 0.8286 | 0.1888 |
Table 11 Comparative performance of Random Forest and XGBoost in the PrimeVul test dataset
| Model | Threshold | Accuracy | Precision | Recall | F1-score | Macro-F1 | Weighted-F1 | ROC-AUC | PR-AUC |
| XGBoost | 0.80 | 0.9634 | 0.2110 | 0.2386 | 0.2239 | 0.6026 | 0.9645 | 0.8545 | 0.1540 |
| Random Forest (TF-IDF only + oversample 1:3) | 0.15 | 0.9662 | 0.2576 | 0.2787 | 0.2677 | 0.6252 | 0.9669 | 0.8244 | 0.1902 |
Table 11 compares the performance of different imbalance-handling strategies, including the baseline setting, undersampling, and oversampling. The baseline model achieved an accuracy of 0.9695, with a precision of 0.2833, a recall of 0.2477, and an F1-score of 0.2643. Under the undersampling ratio of 1:3, the training set contained 19,448 samples. This setting achieved an accuracy of 0.9581, a precision of 0.2051, a recall of 0.3097, and an F1-score of 0.2467. Under the oversampling settings, the training sizes increased to 185,521 and 195,245 samples for the 1:3 and 1:5 ratios, respectively. The corresponding F1-scores were 0.2677 and 0.2651, while the ROC-AUC values were 0.8244 and 0.8286 and the PR-AUC values were 0.1902 and 0.1888.
Table 11 compares the performance of Random Forest and XGBoost on the PrimeVul test set. XGBoost achieved an accuracy of 0.9634, a precision of 0.2110, a recall of 0.2386, and an F1-score of 0.2239. Its Macro-F1, Weighted-F1, ROC-AUC, and PR-AUC values were 0.6026, 0.9645, 0.8545, and 0.1540, respectively.
The Random Forest model with TF-IDF features and oversampling at a ratio of 1:3 achieved an accuracy of 0.9662, a precision of 0.2576, a recall of 0.2787, and an F1-score of 0.2677. Its Macro-F1 and Weighted-F1 values were 0.6252 and 0.9669, respectively. Its ROC-AUC and PR-AUC values were 0.8244 and 0.1902, respectively.
Overall, the experimental results show that feature representation plays an important role in function-level vulnerability detection under highly imbalanced data conditions. The TF-IDF-based representation generally provided stronger discriminative ability than the numerical-only setting, while the combined feature setting offered stable performance across different evaluations. The results also indicate that accuracy alone is insufficient for assessing vulnerability detection models, because the vulnerable class accounts for only a small proportion of the samples. Therefore, precision, recall, F1-score, PR-AUC, and cross-dataset performance should be considered together. The sensitivity, stability, and imbalance-handling experiments further show that the implemented feature-based pipeline maintains relatively stable behavior under different parameter settings, random seeds, and sampling strategies. In addition, the external evaluation on DiverseVul confirms that the model trained on PrimeVul retains a certain degree of generalization ability without additional fine-tuning.
5 Conclusion
This study investigated function-level software vulnerability detection under realistic imbalanced data conditions. A lightweight feature-based pipeline was implemented using TF-IDF lexical features, numerical code-statistical features, and conventional machine-learning classifiers. Experiments on PrimeVul and external validation on DiverseVul show that carefully constructed feature representations, validation-based threshold selection, and multi-metric evaluation can provide stable and reproducible detection performance without relying on complex graph-based architectures. Although the proposed pipeline improves interpretability and experimental reproducibility, its ability to identify vulnerable functions is still limited by the severe class imbalance and the restricted semantic information captured by lightweight features. Future work will further explore richer program representations, more effective imbalance-learning strategies, and broader validation across additional vulnerability datasets.
References
[1] Li, Z., Zou, D., Xu, S., Jin, H., Zhu, Y., and Chen, Z. “SySeVR: A Framework for Using Deep Learning to Detect Software Vulnerabilities,” IEEE Transactions on Dependable and Secure Computing, vol. 19, no. 4, pp. 2244–2258, 2022.
[2] Zou, D., Wang, S., Xu, S., Li, Z., and Jin, H. “VulDeePecker: A Deep Learning-Based System for Multiclass Vulnerability Detection,” IEEE Transactions on Dependable and Secure Computing, vol. 18, no. 5, pp. 2224–2236, 2021.
[3] Zhou, Y., Liu, S., Siow, J., Du, X., and Liu, Y. “Devign: Effective Vulnerability Identification by Learning Comprehensive Program Semantics via Graph Neural Networks,” Advances in Neural Information Processing Systems, vol. 32, 2019.
[4] Cheng, X., Wang, H., Hua, J., Xu, G., and Sui, Y. “DeepWukong: Statically Detecting Software Vulnerabilities Using Deep Graph Neural Network,” ACM Transactions on Software Engineering and Methodology, vol. 30, no. 3, article 33, 2021.
[5] Nguyen, V.-A., Nguyen, D. Q., Nguyen, V., Le, T., Tran, Q. H., and Phung, D. “ReGVD: Revisiting Graph Neural Networks for Vulnerability Detection,” in Proceedings of the 2022 ACM/IEEE 44th International Conference on Software Engineering: Companion Proceedings, pp. 178–182, 2022.
[6] Chen, Y., Ding, Z., Alowain, L., Chen, X., and Wagner, D. “DiverseVul: A New Vulnerable Source Code Dataset for Deep Learning Based Vulnerability Detection,” in Proceedings of the 26th International Symposium on Research in Attacks, Intrusions and Defenses, pp. 654–668, 2023.
[7] Ding, Y., Fu, Y., Ibrahim, O., Sitawarin, C., Chen, X., Alomair, B., Wagner, D., Ray, B., and Chen, Y. “Vulnerability Detection with Code Language Models: How Far Are We?” in Proceedings of the IEEE/ACM 47th International Conference on Software Engineering, pp. 1729–1741, 2025.
[8] Fu, M., and Tantithamthavorn, C. “LineVul: A Transformer-based Line-Level Vulnerability Prediction,” in Proceedings of the 2022 Mining Software Repositories Conference, pp. 608–620, 2022.
[9] Li, Y., Wang, S., and Nguyen, T. N. “Vulnerability Detection with Fine-Grained Interpretations,” in Proceedings of the 29th ACM Joint Meeting European Software Engineering Conference and Symposium on the Foundations of Software Engineering, pp. 292–303, 2021.
[10] Steenhoek, B., Gao, H., and Le, W. “Dataflow Analysis-Inspired Deep Learning for Efficient Vulnerability Detection,” in Proceedings of the 46th IEEE/ACM International Conference on Software Engineering, 2024.
[11] Hanif, H., and Maffeis, S. “VulBERTa: Simplified Source Code Pre-Training for Vulnerability Detection,” in Proceedings of the 2022 International Joint Conference on Neural Networks, pp. 1–8, 2022.
[12] Kim, S., Choi, J., Ahmed, M. E., Nepal, S., and Kim, H. “VulDeBERT: A Vulnerability Detection System Using BERT,” in Proceedings of the 2022 IEEE International Symposium on Software Reliability Engineering Workshops, pp. 69–74, 2022.
[13] Cheng, X., Zhang, G., Wang, H., and Sui, Y. “Path-sensitive Code Embedding via Contrastive Learning for Software Vulnerability Detection,” in Proceedings of the 31st ACM SIGSOFT International Symposium on Software Testing and Analysis, pp. 519–531, 2022
[14] Wang, R., Xu, S., Tian, Y., Ji, X., Sun, X., Zhu, D., and Jiang, S. “SCL-CVD: Supervised Contrastive Learning for Code Vulnerability Detection via GraphCodeBERT,” Computers & Security, vol. 145, pp. 103994, 2024.
[15] Tang, W., Tang, M., Ban, M., Zhao, Z., and Feng, M. “CSGVD: A Deep Learning Approach Combining Sequence and Graph Embedding for Source Code Vulnerability Detection,” Journal of Systems and Software, vol. 199, pp. 111623, 2023.
[16] Guo, W., Fang, Y., Huang, C., Ou, H., Lin, C., and Guo, Y. “HyVulDect: A Hybrid Semantic Vulnerability Mining System Based on Graph Neural Network,” Computers & Security, vol. 121, pp. 102823, 2022.
[17] Wang, J., Xiao, H., Zhong, S., and Xiao, Y. “DeepVulSeeker: A Novel Vulnerability Identification Framework via Code Graph Structure and Pre-Training Mechanism,” Future Generation Computer Systems, vol. 148, pp. 15–26, 2023.
[18] Zhao, Q., Huang, C., and Dai, L. “VULDEFF: Vulnerability Detection Method Based on Function Fingerprints and Code Differences,” Knowledge-Based Systems, vol. 260, pp. 110139, 2023.
[19] Zheng, W., Su, X., Wei, H., and Tao, W. “SVulDetector: Vulnerability Detection Based on Similarity Using Tree-Based Attention and Weighted Graph Embedding Mechanisms,” Computers & Security, vol. 144, pp. 103930, 2024.
[20] Ge, K., and Han, Q.-B. “Hidden Code Vulnerability Detection: A Study of the Graph-BiLSTM Algorithm,” Information and Software Technology, vol. 175, p. 107544, 2024.
[21] Xu, C. D., Luong, T. T., and Thanh, M. C. “Optimising Source Code Vulnerability Detection Using Deep Learning and Deep Graph Network,” Connection Science, vol. 37, no. 1, article 2447373, 2025.
[22] Jin, D., He, C., Zou, Q., Qin, Y., and Wang, B. “Source Code Vulnerability Detection Based on Joint Graph and Multimodal Feature Fusion,” Electronics, vol. 14, no. 5, pp. 975, 2025.
[23] Zou, Z., Jiang, T., Wang, Y., Xue, T., Zhang, N., and Luan, J. “Code Vulnerability Detection Based on Augmented Program Dependency Graph and Optimized CodeBERT,” Scientific Reports, vol. 15, article 39301, 2025.
[24] Guo, Y., Bettaieb, S., and Casino, F. “A Comprehensive Analysis on Software Vulnerability Detection Datasets: Trends, Challenges, and Road Ahead,” International Journal of Information Security, vol. 23, pp. 3311–3327, 2024.
[25] Chen, L., Wei, Q., Du, J., Wang, Y., and Jiang, Z. “Survey of Source Code Vulnerability Analysis Based on Deep Learning,” Computers & Security, vol. 148, pp. 104098, 2025.
[26] Anand, A., Bhatt, N., Kaur, J., and Tamura, Y. “Time Lag-Based Modelling for Software Vulnerability Exploitation Process,” Journal of Cyber Security and Mobility, vol. 10, no. 4, pp. 663–678, 2021.
[27] Somesha, M., and Pais, A. R. “Classification of Phishing Email Using Word Embedding and Machine Learning Techniques,” Journal of Cyber Security and Mobility, vol. 11, no. 3, pp. 279–320, 2022.
[28] Doynikova, E., Fedorchenko, A., and Kotenko, I. “A Semantic Model for Security Evaluation of Information Systems,” Journal of Cyber Security and Mobility, vol. 9, no. 2, pp. 301–330, 2020.
[29] Kotenko, I., and Chechulin, A. “Fast Network Attack Modeling and Security Evaluation based on Attack Graphs,” Journal of Cyber Security and Mobility, vol. 3, no. 1, pp. 27–46, 2014.
[30] Suárez, G. P., Gallos, L. K., and Fefferman, N. H. “A Case Study in Tailoring a Bio-Inspired Cyber-Security Algorithm: Designing Anomaly Detection for Multilayer Networks,” Journal of Cyber Security and Mobility, vol. 8, no. 1, pp. 113–132, 2018.
Biography

Jing Wang studied fine arts (calligraphy direction) during her bachelor’s and master’s programs and subsequently earned her Ph.D. in educational management, giving her a strong interdisciplinary background. She has participated in multiple university- and provincial-level teaching reform and research projects and has published several academic papers. Her research encompasses primary education practice, the application of educational psychology in classroom settings, calligraphy aesthetic education in primary schools, Mandarin pronunciation instruction, and data-driven educational evaluation. Drawing on theories from the arts, education, and psychology, she excels at integrating traditional cultural aesthetic education, psychological intervention strategies, and modern educational technology. She is dedicated to developing an integrated teaching model for the primary school stage and exploring data-driven research methods, thereby providing replicable and scalable practical pathways for improving instructional quality and developing specialized curricula. Her research interests include primary education management, calligraphy aesthetic education, educational psychology, and language teaching (with a focus on Mandarin pronunciation), as well as the interdisciplinary application of educational technology and data science in basic education.
Journal of Cyber Security and Mobility, Vol. 15_5, 1211–1232
doi: 10.13052/jcsm2245-1439.1553
© 2026 River Publishers