EW-GAT: An Edge-Weighted Graph Attention Network with Multi-Source Feature Fusion for Encrypted Malicious Traffic Classification
Junli Zong*
Department of Modern Educational Technology, Wuzhai Branch of Xinzhou Normal University, Xinzhou 034000, China
E-mail: junli4562026@outlook.com
Received 14 April 2026; Accepted 08 June 2026
Abstract
The increase in the number of encryption schemes for communication networks has resulted in a persistent challenge for network security, as malicious activities can be concealed within otherwise legitimate encrypted communication flows. Current methods using graph theory do not consider semantic behavior while creating links and assuming that all neighbors contribute equally to message transmission regardless of their importance to discriminatory power for fine-grained categories. The current work introduces a model for edge weight calculation with multi-source feature fusion named EW-GAT. A semantic similarity graph is constructed via cosine similarity and Top- sparsification, with similarity values directly embedded as edge weights to quantitatively encode behavioral closeness between flows. A multi-source fusion scheme integrates flow-level statistical features, KNN-based neighborhood representations, and class-prior signals from a gradient boosting model to enrich node representations. An edge-weighted attention mechanism further modulates attention coefficients with the pre-computed edge weights, enabling behavior-aware neighbor aggregation. Experiments on two benchmark datasets, CIC-IDS2017 and CSE-CIC-IDS2018, show that the proposed approach attains 99.59% and 99.53% Accuracy on the respective binary tasks, and 94.07% Accuracy with 94.20% Macro-F1 on the CIC-IDS2017 15-class task and 93.33% Accuracy with 93.14% Macro-F1 on the CSE-CIC-IDS2018 15-class task, consistently outperforming all baselines across both datasets. Ablation analysis reveals Macro-F1 drops of 9.29% and 9.73% on the two datasets when the similarity graph is replaced by a random graph, confirming the robustness of the three innovations across different network environments.
Keywords: Encrypted malicious traffic classification, graph neural network, edge-weighted attention, multi-source feature fusion, similarity graph construction, cross-dataset evaluation.
1 Introduction
The widespread adoption of encryption communication mechanisms has drastically altered the security environment in networks. The initial use of traffic encryption for securing users’ privacy and protecting transmitted data from any manipulation by malicious agents has increasingly been exploited by attackers to mask malicious intent through the use of seemingly legitimate encryption mechanisms (Shen et al., 2023). Consequently, an increasing number of cyber attacks, ranging from botnets to data theft and command-and-control communications, is increasingly conducted using encryption mechanisms that render such activities invisible to traditional intrusion detection approaches (Bai and Bai, 2025; Papadogiannaki and Ioannidis, 2021). Detecting and blocking malicious encrypted traffic has therefore become the central focus of cybersecurity efforts.
Detection techniques that depend on port matching or deep packet inspection are progressively rendered obsolete in an environment characterized by extensiv’e usage of encryption (Chen, 2025; Zhang et al., 2025). Signatures that depend on payload become useless when the packets are encrypted, while feature extraction using statistical models is difficult since it necessitates deep understanding in the field, thus not generalizing enough in most scenarios (Rezaei and Liu, 2019). Machine learning was one of the earliest methods used in applying this methodology using crafted flow statistics; however, such approaches proved to be insecure against different attack forms (Wang et al., 2022). Early work in detecting malicious activity through analyzing TLS metadata opened up new perspectives in this field (Anderson et al., 2018).
Deep learning has played a crucial role in facilitating automated feature extraction from raw byte streams or flow-level representations. Several recent research works that incorporate the use of natural language processing approaches into deep neural networks demonstrate the discriminatory information embedded within context-based semantics of byte stream sequences for detecting malicious network flows (Zang et al., 2024). Moreover, pre-trained transformer models have taken performance to the next level by leveraging the ability of learning generalized data gram representations using unlabeled traffic, thereby improving transfer learning performance for various downstream tasks (Lin et al., 2022). Self-attention-based models have further enabled learning long-range dependencies between bytes in encrypted packet streams, resulting in better multi-class network flow detection performance (Chen et al., 2023). Multi-class classification of abnormal traffic behavior in IoT-based scenarios has been addressed by several recent research papers (S. Zhu et al., 2023), whereas another interesting direction has been exploring frequency domain-based analysis for improving resilience towards traffic obfuscation (Fu, Li, Shen, et al., 2023). However, these approaches consider each individual network flow as separate samples without considering any kind of relationship between flows’ traffic behaviors.
GNNs have been proposed as an innovative approach that directly represents the topological nature of the data involved in network traffic. A detailed review of graph-based intrusion detection techniques revealed how relational inductive biases allow GNNs to discover intricate interaction patterns not represented by traditional feature vectors (Zhong et al., 2024). Initial work using GNNs for decentralized application recognition illustrated how the use of graph representations is possible to detect encrypted traffic (Shen et al., 2021). This was further advanced by applying flow interaction graphs to unsupervised detection of new encrypted malicious activities (Fu, Li and Xu, 2023). Recent research has explored how to integrate GNNs with transformers to learn both local semantics of packets and higher-level interactions between flows (Yang et al., 2024) or propose two complementary embeddings for better encrypted traffic classification (Han et al., 2024). Other works have utilized multi-scale graph convolution techniques to identify hierarchical traffic dependencies (Diao et al., 2023). Finally, graph convolutional attention networks have been applied for detecting attack fingerprints, thereby validating the effectiveness of attention mechanisms in discriminating encrypted flows (Wang et al., 2023).
Though these improvements have substantially advanced the state-of-the-art, many issues still exist. For example, most current methods generate edges from the basis of connection or adjacency over time, but this may not necessarily be representative of the similarity in meaning of two flows that show similar behavior. Additionally, many existing GNNs tend to weigh all edges equally when carrying out the propagation of messages, without recognizing the fact that neighbors of the targeted flow do not have the same degree of importance in classifying the targeted flow.
Motivated by these observations, an edge-weighted graph attention network, termed EW-GAT, is proposed for encrypted malicious traffic identification and classification. The main contributions are summarized as follows.
(1) A semantic similarity graph construction method is proposed, where cosine similarity guides Top- edge selection and is directly embedded as edge weights, quantitatively encoding behavioral closeness between flows.
(2) A multi-source feature fusion scheme is designed, which jointly integrates flow-level statistical features, KNN-based neighborhood representations, and class-prior signals from a gradient boosting model to enhance the discriminative capacity of node representations.
(3) The EW-GAT model is presented, which incorporates edge weights into the graph attention network through multiplicative modulation rather than the concatenation-based approach used in existing edge-aware models such as E-GraphSAGE, enabling behavior-aware neighbor aggregation. On the CIC-IDS2017 and CSE-CIC-IDS2018 datasets, EW-GAT consistently achieves the highest Macro-F1 across both benchmarks, reaching 94.20% and 93.14%, respectively, for the 15-class detection problem, demonstrating generalizability across different network environments and attack compositions.
2 Method
2.1 Dataset and Preprocessing
The experiment utilizes two publicly available intrusion detection benchmarks CIC-IDS2017 and CSE-CIC-IDS2018 (Sharafaldin et al., 2018) to evaluate the proposed approach under different network environments. The datasets contain various contemporary attack types that include denial of service attacks, brute force attacks, Web application attacks, botnet attacks, port scanning, and Heartbleed attacks. The dataset contains significant encrypted traffic that is transmitted through TLS/SSL protocols. This is consistent with the scope of the research topic.
As depicted in Table 1, both datasets exhibit severe class imbalance. In CIC-IDS2017 (Panel A), the three minority classes (Infiltration, SQL Injection, Heartbleed) constitute less than 1.2% of the sample size. In CSE-CIC-IDS2018 (Panel B), the three minority classes (Brute Force – Web, Brute Force – XSS, SQL Injection) account for 4.85% of the subset, presenting an alternative imbalance structure that tests whether the proposed multi-source fusion strategy generalizes across different minority-class configurations.
The captured network packet files are then analyzed at the flow level where each individual flow can be identified by its five-tuple comprising of source and destination address, along with their respective port numbers and protocol used for transport. Incomplete flows and other packets that are not relevant to application-level activity are eliminated in order to filter out any noise. Next, 78 quantitative statistical features are calculated for each flow to generate the sample feature vector encompassing information about packet size, arrival intervals, and transmission directionality. In order to avoid the adverse effects of the feature scale differences while constructing the graph later on, all quantitative features undergo Z-Score normalization. Given that class imbalance is a characteristic property of the dataset being used for analysis, namely CIC-IDS2017, due to the minority classes such as Heartbleed, SQL Injection, and Infiltration containing just a few dozen samples in the dataset, this study adopts a stratified sampling approach to construct the experimental subset. The majority classes will then have the same number of samples (500 each), while minority classes are left unchanged to preserve the class imbalance problem. The resulting CIC-IDS2017 experimental subset contains 6068 flow samples. The same stratified sampling and splitting strategy is applied to CSE-CIC-IDS2018, yielding a subset of 6306 flows. Among the 80 features provided by CICFlowMeter-V3 in CSE-CIC-IDS2018, two features that are absent from the CIC-IDS2017 feature set are excluded. The remaining 78 features shared across both datasets are retained to ensure consistent feature dimensionality and to enable a fair cross-dataset comparison under identical input representations. Both subsets are split into training, validation, and testing sets in a 7:1:2 stratified manner.
Table 1 Dataset class distribution
| No. | Class | Training | Validation | Testing | Total | Ratio (%) |
| Panel A: CIC-IDS2017 | ||||||
| 1 | BENIGN | 350 | 50 | 100 | 500 | 8.24 |
| 2 | DDoS | 350 | 50 | 100 | 500 | 8.24 |
| 3 | PortScan | 350 | 50 | 100 | 500 | 8.24 |
| 4 | Bot | 350 | 50 | 100 | 500 | 8.24 |
| 5 | Infiltration | 25 | 4 | 7 | 36 | 0.59 |
| 6 | Web Attack – Brute Force | 350 | 50 | 100 | 500 | 8.24 |
| 7 | Web Attack – XSS | 350 | 50 | 100 | 500 | 8.24 |
| 8 | Web Attack – SQL Injection | 14 | 3 | 4 | 21 | 0.35 |
| 9 | FTP-Patator | 350 | 50 | 100 | 500 | 8.24 |
| 10 | SSH-Patator | 350 | 50 | 100 | 500 | 8.24 |
| 11 | DoS Slowloris | 350 | 50 | 100 | 500 | 8.24 |
| 12 | DoS Slowhttptest | 350 | 50 | 100 | 500 | 8.24 |
| 13 | DoS Hulk | 350 | 50 | 100 | 500 | 8.24 |
| 14 | DoS GoldenEye | 350 | 50 | 100 | 500 | 8.24 |
| 15 | Heartbleed | 7 | 1 | 3 | 11 | 0.18 |
| – | Subtotal | 4246 | 608 | 1214 | 6068 | 100.00 |
| Panel B: CSE-CIC-IDS2018 | ||||||
| 1 | BENIGN | 350 | 50 | 100 | 500 | 7.93 |
| 2 | FTP-BruteForce | 350 | 50 | 100 | 500 | 7.93 |
| 3 | SSH-BruteForce | 350 | 50 | 100 | 500 | 7.93 |
| 4 | Bot | 350 | 50 | 100 | 500 | 7.93 |
| 5 | Infiltration | 350 | 50 | 100 | 500 | 7.93 |
| 6 | Brute Force – Web | 122 | 17 | 35 | 174 | 2.76 |
| 7 | Brute Force – XSS | 55 | 8 | 16 | 79 | 1.25 |
| 8 | SQL Injection | 37 | 5 | 11 | 53 | 0.84 |
| 9 | DoS Slowloris | 350 | 50 | 100 | 500 | 7.93 |
| 10 | DoS SlowHTTPTest | 350 | 50 | 100 | 500 | 7.93 |
| 11 | DoS Hulk | 350 | 50 | 100 | 500 | 7.93 |
| 12 | DoS GoldenEye | 350 | 50 | 100 | 500 | 7.93 |
| 13 | DDoS HOIC | 350 | 50 | 100 | 500 | 7.93 |
| 14 | DDoS LOIC-HTTP | 350 | 50 | 100 | 500 | 7.93 |
| 15 | DDoS LOIC-UDP | 350 | 50 | 100 | 500 | 7.93 |
| – | Subtotal | 4414 | 630 | 1262 | 6306 | 100.00 |
It should be noted that the stratified sampling procedure preserves the original class-imbalance ratios observed in the full datasets, ensuring that the classification difficulty is not artificially reduced. Moreover, all 15 models compared in this study are trained and evaluated on exactly the same subsets, so relative performance rankings remain unaffected by the absolute dataset size. The consistent results across two independently sampled datasets (CIC-IDS2017 and CSE-CIC-IDS2018) further mitigate the risk of dataset-specific bias. Nevertheless, the limited subset size is acknowledged as a limitation, and larger-scale evaluation is discussed in Section 4.4.
CSE-CIC-IDS2018 was jointly developed by the Communications Security Establishment (CSE) and the Canadian Institute for Cybersecurity (CIC) using a large-scale enterprise network emulation deployed on Amazon AWS, comprising approximately 420 client machines, 30 servers, and 50 attacker virtual machines. The dataset covers seven attack scenarios and contains approximately 16 million flow records collected over 10 days, with 80 statistical features extracted by CICFlowMeter-V3. Compared with CIC-IDS2017, CSE-CIC-IDS2018 differs in three key aspects: (i) the network topology is cloud-based rather than a local laboratory environment; (ii) the DDoS category is expanded into three sub-types (HOIC, LOIC-HTTP, LOIC-UDP), while the PortScan and Heartbleed categories are absent from the extracted flow records; (iii) the minority classes differ in both identity and size, with Brute Force – Web (174), Brute Force – XSS (79), and SQL Injection (53) constituting less than 4.85% of the subset.
2.2 Encrypted Traffic Feature Extraction
The essential aspect of encrypting payload makes the traditional feature engineering methodology change direction from inspecting content information to extracting features from observable behaviors and structure of packets that can be observed despite encryption. In earlier studies, it has been shown that the use of CNNs is practical for malicious traffic classification based on raw byte streams (Wang et al., 2017). Further studies have shown that the statistical characteristics of the behavior pattern in packet communication contain enough discriminant information to differentiate between malicious and benign packets even when fully encrypted (Cui et al., 2023). Extending the idea behind these studies, temporal and directional information related to packet communication behaviors have been used to develop detailed traffic representations for differentiating applications based on behavioral characteristics (Zhang et al., 2023). These findings support the view that external behavioral footprints, rather than decrypted content, provide a reliable basis for encrypted traffic analysis.
Motivated by these observations, the proposed approach adopts a flow-level statistical feature representation that is agnostic to payload visibility. For each flow, 78 numerical attributes are extracted to characterize its behavioral profile, encompassing packet length statistics such as minimum, maximum, mean, and standard deviation values, inter-arrival timing characteristics including forward and backward delays, flag-related counters, and directional throughput indicators. The resulting feature vector of the -th flow is denoted as , which forms the node attribute for the subsequent graph construction stage. In addition to these statistical attributes, two auxiliary feature streams are incorporated in later stages, namely KNN-based neighborhood representations derived from the similarity graph and class-prior signals generated by a gradient boosting model, which jointly enrich the representational capacity of each flow. The same 78 features are adopted for both CIC-IDS2017 and CSE-CIC-IDS2018 to maintain consistent input dimensionality, as detailed in Section 2.1.
2.3 Traffic Similarity Graph Construction
The graph structure represents a promising way for representing the underlying relational patterns existing in the traffic data since it allows the explicit modeling of dependencies between different flows that cannot be described by single flows alone. In previous efforts using graph representation on traffic classification at flow level, researchers represent each network flow as a node in the graph and create edges between those nodes either based on endpoints or temporal adjacency, and thus bring the capability of relational reasoning into the field of encrypted traffic classification (Huoh et al., 2023). Some researchers have explored the use of graph neural networks to further refine the modeling granularity by focusing on packets and discovering fine-grained behavioral patterns from local interaction graphs (Hu et al., 2023). Nevertheless, most existing models only utilize simple connectivity or temporal relations to build edges, but fail to account for the semantic resemblance among flows displaying similar behavioral patterns. As a result, the process of message passing may involve unnecessary interactions among irrelevant nodes.
To address this limitation, this study proposes a graph construction strategy grounded in semantic similarity within the feature space. For each pair of traffic samples, cosine similarity is adopted to measure their directional closeness in the 78-dimensional feature space, as formulated in Equation (1):
| (1) |
where and denote the feature vectors of the -th and -th flows, respectively. Cosine similarity is insensitive to the magnitudes of feature vectors in high-dimensional space, allowing it to capture the relative relationships between behavioral patterns in a more stable manner – a property particularly valuable for traffic statistical features whose value ranges vary considerably. This graph construction procedure is applied independently to each dataset, producing dataset-specific similarity graphs that reflect the behavioral structure of the respective traffic distributions. No cross-dataset information is shared during graph construction or model training.
To avoid the noise accumulation and computational burden associated with fully connected graphs, a Top- sparsification strategy is applied to construct the adjacency matrix. For each node, only the most semantically similar neighbors are retained, and the corresponding similarity values are used directly as edge weights, as defined in Equation (2):
| (2) |
where denotes the set of nearest neighbors of node . This formulation performs dual functions, which include the following. The low number of edges reduces interference from irrelevant samples, while the weights of these edges are rich in semantic value, thus creating the groundwork for using the attention mechanism on behavioral proximity of nearby flows.
It is worth noting that cosine similarity yields values in the range [1, 1]; however, after Top-K selection, only the K most similar neighbors are retained, and their similarity values are typically concentrated in the positive range close to 1. These edge weights are subsequently used as multiplicative modulation factors in the attention mechanism (Section 2.4), where the softmax normalization inherently rescales the modulated attention coefficients to sum to unity over each node’s neighborhood, thereby providing implicit normalization without requiring an additional explicit normalization step on the edge weights themselves.
2.4 Edge-Weighted Graph Attention Network with Multi-Source Feature Fusion
The architectural layout of the suggested EW-GAT model is shown in Figure 1, drawing on existing message-passing models used in graph-based representation learning (Gilmer et al., 2017) but featuring three unique components designed specifically for encrypted traffic classification purposes. The architecture comprises three distinct phases: multi-source feature fusion, edge-weighted attention-based message passing, and classification.
It is important to distinguish the proposed approach from existing edge-aware GNN models, particularly E-GraphSAGE. E-GraphSAGE incorporates edge features by concatenating them with the source node features before message aggregation, treating edge information as an additional input dimension. In contrast, EW-GAT differs in three key aspects. First, the edge weights originate from semantic cosine similarity rather than raw connection attributes, thereby encoding behavioral closeness between flows. Second, the edge weights modulate the attention coefficients through multiplicative scaling rather than concatenation, creating a direct coupling between behavioral similarity and neighbor influence. Third, node representations are enriched through multi-source feature fusion prior to message passing, combining statistical features, KNN-based neighborhood representations, and gradient boosting class priors. Experimental results in Section 3.3 confirm that this design outperforms the concatenation-based approach of E-GraphSAGE by 2.33% and 2.52% in Macro-F1 on CIC-IDS2017 and CSE-CIC-IDS2018, respectively.
2.4.1 Multi-source feature fusion
Given the similarity graph constructed in Section 2.3, two auxiliary feature streams are derived to complement the flow-level statistical features. The first stream exploits the local neighborhood of each flow in the similarity graph to capture its contextual behavioral profile. For the -th flow, the KNN-based neighborhood representation is computed as the weighted aggregation of its nearest neighbors, as defined in Equation (3):
| (3) |
where denotes the cosine similarity defined in Equation (1). This representation encodes the average behavioral pattern of semantically close flows, providing a contextual complement to the node’s intrinsic features. The second stream introduces class-prior knowledge generated by a gradient boosting model, which has demonstrated strong discriminative capability on structured traffic data. The boosting prior for the -th flow is formulated as Equation (4):
| (4) |
where denotes the pre-trained gradient boosting classifier and is the number of classes. The three streams are concatenated to form the fused node representation, as shown in Equation (5):
| (5) |
where denotes vector concatenation. The fused representation simultaneously captures the intrinsic behavioral footprint, contextual neighborhood pattern, and discriminative class-prior signal, forming a more informative input for the subsequent attention-based message passing.
2.4.2 Edge-weighted attention mechanism
Conventional graph convolutional networks aggregate neighbor information through a symmetrically normalized adjacency matrix (Kipf and Welling, 2017), while graph attention networks further introduce learnable attention coefficients to adaptively weight neighbor contributions based on node feature similarity (Veličković et al., 2018). However, both formulations overlook the quantitative behavioral closeness carried by edge weights in the similarity graph. Inspired by related intrusion detection work that incorporates edge information into message passing (Lo et al., 2022), this study proposes an edge-weighted attention mechanism that explicitly modulates attention coefficients with the pre-computed edge weights, as formulated in Equation (6):
| (6) |
where W is a learnable linear transformation, a is a learnable attention vector, and denotes the edge weight defined in Equation (2). The updated node representation at the -th layer is obtained through weighted neighbor aggregation, as shown in Equation (7):
| (7) |
where denotes the ELU activation function. Stacking two such layers allow each node to aggregate information from its two-hop semantic neighborhood while maintaining manageable computational cost.
Specifically, the numerator of Equation (6) computes the exponential of the product between the edge weight and the LeakyReLU-activated alignment score, where the alignment score is obtained by applying the learnable attention vector to the concatenation of the linearly transformed features of nodes and . The denominator sums the same quantity over all neighbors in the neighborhood, ensuring that the attention coefficients form a valid probability distribution. The edge weight acts as a multiplicative scaling factor inside the exponential, amplifying the attention logit for node pairs with higher behavioral similarity before softmax normalization is applied. This multiplicative formulation directly scales the attention coefficient by the behavioral similarity, ensuring that semantically closer neighbors receive proportionally higher aggregation weights. This design differs fundamentally from the concatenation-based edge utilization in E-GraphSAGE, where edge features serve as additional input dimensions but do not directly constrain the magnitude of the attention coefficient.
2.4.3 Classification and optimization
The final node representation is projected onto the class space through a fully connected softmax layer:
| (8) |
The model is trained end-to-end by minimizing the cross-entropy loss, and class-balanced weights are applied to mitigate the adverse effect of the severe class imbalance observed in Table 1.
As shown in Figure 1, the three stages of the proposed framework, namely multi-source feature fusion, edge-weighted attention-based message passing, and softmax classification, are jointly optimized in an end-to-end manner. This architecture enables the model to learn behavior-aware representations that are tailored to the encrypted traffic classification task, where the similarity graph supplies the structural prior, the fused node features inject complementary discriminative signals, and the edge-weighted attention mechanism ensures that neighbor aggregation respects the quantitative behavioral closeness between flows.
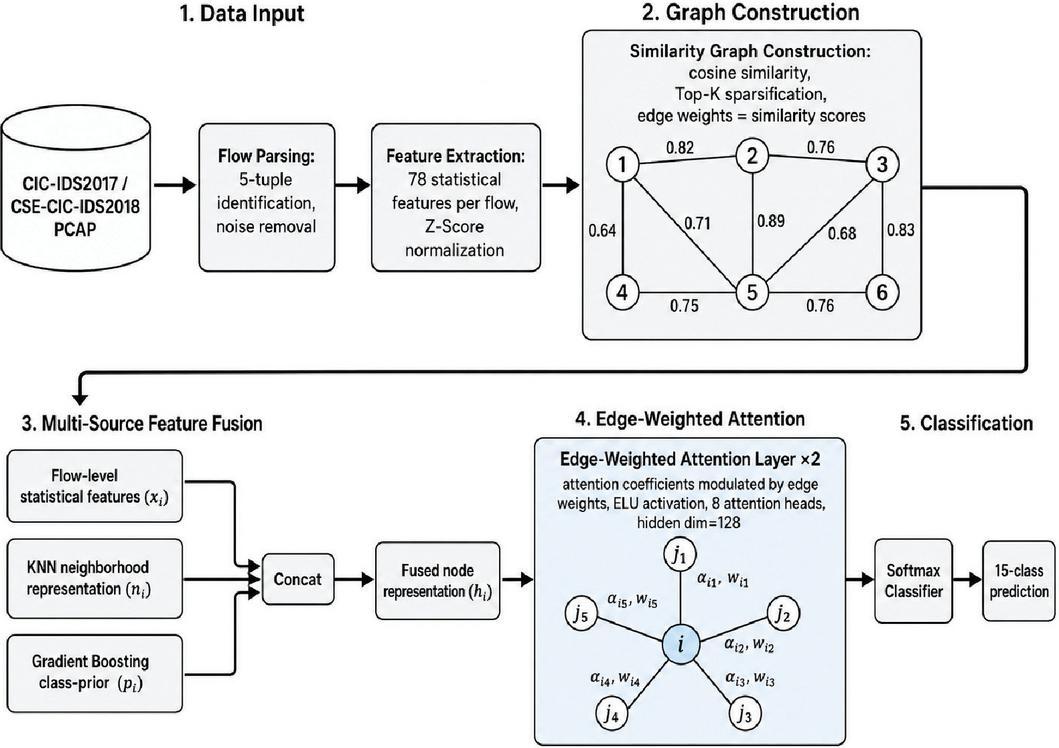
Figure 1 Overall framework of the proposed EW-GAT method.
2.5 Experimental Settings and Evaluation Metrics
All experiments were conducted on a workstation equipped with an Intel Xeon Gold 6226R processor, 64 GB memory, and NVIDIA RTX 3090 graphics card. The proposed method was implemented using Python version 3.9 programming language with the help of PyTorch version 1.13 and PyTorch Geometric version 2.3. The EW-GAT architecture uses two edge-weighted attention layer stacks with a hidden dimension size of 128 and eight attention heads with a softmax classifier. The Adam optimizer is used, with the initial learning rate of and a weight decay of . Dropout of 0.5 is used to prevent overfitting, and the training period consists of 200 epochs with the batch size set to 64. In addition, early stopping is used to guarantee convergence. Since class imbalance is severe, class-balanced weights are introduced in cross-entropy loss.
Model performance is evaluated using four widely adopted metrics, including Accuracy, Precision, Recall, and F1-Score. For the multi-class setting, Macro-F1 and Weighted-F1 are additionally reported to provide a comprehensive view across balanced and imbalanced evaluation perspectives. Macro-F1 averages the F1 scores equally across classes, placing particular emphasis on minority categories, whereas Weighted-F1 aggregates class-level F1 scores proportionally to their sample sizes. All reported results are averaged over five independent runs with different random seeds to reduce the influence of stochastic variation. Standard deviations () are reported alongside mean values in Table 3 to allow readers to assess the statistical stability of the observed performance differences. To compare with state-of-the-art graph-based methods, four representative GNN models are additionally implemented: GCN, GAT, GraphSAGE, E-GraphSAGE. All four GNN baselines operate on the same similarity graph and use the same 78-dimensional features as node attributes. Their hidden dimensions and number of layers are aligned to those of EW-GAT (128 dimensions, two layers) for a controlled comparison.
3 Results
3.1 Binary Classification Results
To evaluate the fundamental capability of distinguishing malicious flows from benign traffic, binary classification experiments are conducted on both the CIC-IDS2017 and CSE-CIC-IDS2018 subsets by merging all attack categories into a single malicious class. The results are summarized in Table 2.
Table 2 Binary classification results (%)
| Model | Accuracy | Precision | Recall | F1-Score |
| Panel A: CIC-IDS2017 | ||||
| SVM | 98.68 | 98.75 | 92.46 | 95.34 |
| Decision Tree | 99.59 | 98.86 | 98.41 | 98.63 |
| Random Forest | 99.51 | 98.80 | 97.91 | 98.35 |
| Extra Trees | 99.67 | 98.91 | 98.91 | 98.91 |
| Gradient Boosting | 99.42 | 98.75 | 97.41 | 98.07 |
| AdaBoost | 99.34 | 99.64 | 96.00 | 97.74 |
| Gaussian NB | 31.44 | 54.92 | 61.74 | 29.80 |
| KNN | 99.18 | 98.12 | 96.37 | 97.23 |
| Softmax Regression | 98.52 | 98.65 | 91.46 | 94.71 |
| MLP | 99.59 | 99.31 | 97.96 | 98.62 |
| GCN | 99.34 | 98.57 | 97.13 | 97.84 |
| GAT | 99.51 | 98.93 | 97.68 | 98.30 |
| GraphSAGE | 99.42 | 98.71 | 97.36 | 98.03 |
| E-GraphSAGE | 99.59 | 99.18 | 98.10 | 98.64 |
| EW-GAT (Ours) | 99.59 | 98.86 | 98.41 | 98.63 |
| Panel B: CSE-CIC-IDS2018 | ||||
| SVM | 98.19 | 98.42 | 91.83 | 94.93 |
| Decision Tree | 99.37 | 98.61 | 97.85 | 98.23 |
| Random Forest | 99.45 | 98.93 | 97.52 | 98.22 |
| Extra Trees | 99.53 | 99.02 | 98.25 | 98.63 |
| Gradient Boosting | 99.53 | 99.11 | 97.68 | 98.38 |
| AdaBoost | 99.13 | 99.31 | 95.42 | 97.28 |
| Gaussian NB | 38.61 | 57.83 | 59.26 | 34.17 |
| KNN | 98.97 | 97.85 | 95.91 | 96.86 |
| Softmax Regression | 98.03 | 98.23 | 90.72 | 94.18 |
| MLP | 99.37 | 99.04 | 97.51 | 98.26 |
| GCN | 99.13 | 98.31 | 96.49 | 97.39 |
| GAT | 99.29 | 98.68 | 97.14 | 97.90 |
| GraphSAGE | 99.21 | 98.47 | 96.82 | 97.64 |
| E-GraphSAGE | 99.45 | 99.06 | 97.63 | 98.34 |
| EW-GAT (Ours) | 99.53 | 98.97 | 98.10 | 98.53 |
Table 2 shows that the proposed EW-GAT achieves Accuracy and F1-Score values of 99.59% and 98.63%, respectively, which are equivalent to those of the best performing ensemble algorithms like Extra Trees and Decision Tree, but significantly outperform linear classifiers like SVM and Softmax Regression. Most competing algorithms score above 99% Accuracy, implying that the classification of malicious vs. benign samples on the dataset has approached a state of saturation, where the disparities between the best performing algorithms lie within the margins of randomness. The low score for Gaussian NB (Accuracy of 31.44%) results from the overly stringent assumption of feature independence, which is not true for this dataset, as demonstrated by the high correlation coefficients of the flow-level statistical features. This indicates that the discriminative advantage of the proposed method is less apparent in the binary classification setting; hence, the motivation for the more demanding multiclass analysis described in Section 3.2. The binary classification results on CSE-CIC-IDS2018 (Table 2, Panel B) exhibit a similar saturation pattern, with EW-GAT achieving 99.53% Accuracy and 98.53% F1-Score. The consistent performance across both datasets confirms that the proposed approach is not overfitted to a specific traffic distribution. The motivation for the more demanding multi-class analysis remains equally valid on both benchmarks.
3.2 Multi-Class Classification Results
To further examine the fine-grained discriminative capability under the realistic class imbalance of CIC-IDS2017, a 15-class classification experiment is conducted over the full category set defined in Table 1. Accuracy, Macro-F1, and Weighted-F1 are reported to provide a comprehensive view across both balanced and imbalanced evaluation perspectives. The results of EW-GAT and 14 representative baselines are summarized in Table 3.
Table 3 Multi-class classification results (%)
| Model | Accuracy | Macro-F1 | Weighted-F1 |
| Panel A: CIC-IDS2017 | |||
| SVM | 89.88 0.31 | 85.93 0.45 | 88.29 0.35 |
| Decision Tree | 93.09 0.22 | 91.17 0.38 | 93.10 0.25 |
| Random Forest | 93.17 0.18 | 92.02 0.32 | 93.23 0.20 |
| Extra Trees | 92.43 0.16 | 91.38 0.29 | 92.41 0.19 |
| Gradient Boosting | 94.07 0.15 | 93.48 0.26 | 94.15 0.17 |
| AdaBoost | 59.92 0.87 | 46.11 1.14 | 56.92 0.93 |
| Gaussian NB | 81.32 0.52 | 76.21 0.68 | 77.30 0.58 |
| KNN | 91.36 0.24 | 87.77 0.41 | 91.20 0.27 |
| Softmax Regression | 90.21 0.29 | 87.49 0.43 | 88.42 0.33 |
| MLP | 92.59 0.27 | 90.82 0.46 | 92.46 0.30 |
| GCN | 92.26 0.33 | 89.93 0.52 | 92.08 0.36 |
| GAT | 92.75 0.29 | 90.41 0.48 | 92.51 0.32 |
| GraphSAGE | 92.51 0.35 | 90.15 0.55 | 92.29 0.38 |
| E-GraphSAGE | 93.41 0.23 | 91.87 0.39 | 93.36 0.25 |
| EW-GAT (Ours) | 94.07 0.19 | 94.20 0.33 | 94.16 0.21 |
| Panel B: CSE-CIC-IDS2018 | |||
| SVM | 88.47 0.36 | 84.15 0.51 | 86.91 0.39 |
| Decision Tree | 91.84 0.25 | 89.73 0.42 | 91.52 0.28 |
| Random Forest | 92.34 0.20 | 90.58 0.36 | 92.15 0.23 |
| Extra Trees | 91.60 0.19 | 89.92 0.33 | 91.36 0.22 |
| Gradient Boosting | 93.25 0.17 | 92.31 0.29 | 93.17 0.20 |
| AdaBoost | 62.83 0.95 | 49.27 1.22 | 59.68 1.01 |
| Gaussian NB | 78.53 0.58 | 72.84 0.74 | 74.61 0.64 |
| KNN | 89.95 0.28 | 85.63 0.47 | 89.48 0.31 |
| Softmax Regression | 88.63 0.33 | 85.07 0.49 | 86.92 0.37 |
| MLP | 91.44 0.30 | 89.25 0.51 | 91.07 0.34 |
| GCN | 91.04 0.38 | 88.51 0.57 | 90.72 0.41 |
| GAT | 91.52 0.33 | 89.07 0.53 | 91.18 0.36 |
| GraphSAGE | 91.28 0.40 | 88.73 0.61 | 90.93 0.43 |
| E-GraphSAGE | 92.42 0.26 | 90.62 0.43 | 92.17 0.28 |
| EW-GAT (Ours) | 93.33 0.22 | 93.14 0.37 | 93.29 0.24 |
As can be seen from Table 3 (Panel A), the presented EW-GAT achieves the best Macro-F1 score of 94.20% on CIC-IDS2017, outperforming the strongest traditional baseline (Gradient Boosting) by 0.72% and the best-performing GNN baseline (E-GraphSAGE) by 2.33%. Across five independent runs, EW-GAT achieves a mean Macro-F1 of 94.20% (0.33%) on CIC-IDS2017 and 93.14% (0.37%) on CSE-CIC-IDS2018. The corresponding values for Gradient Boosting are 93.48% (0.26%) and 92.31% (0.29%), while E-GraphSAGE obtains 91.87% (0.39%) and 90.62% (0.43%). On CIC-IDS2017, the Macro-F1 advantage of EW-GAT over Gradient Boosting (0.72%) exceeds the standard deviations of both models, and the gap over E-GraphSAGE (2.33%) is approximately six times the standard deviation of EW-GAT. A consistent pattern is observed on CSE-CIC-IDS2018, where the improvements of 0.83 and 2.52 percentage points over the two baselines also exceed the respective standard deviations. These results indicate that the observed performance advantages are statistically stable and not attributable to random seed variation.
On CSE-CIC-IDS2018 (Panel B), EW-GAT achieves 93.33% Accuracy, 93.14% Macro-F1, and 93.29% Weighted-F1, outperforming Gradient Boosting by 0.83% and E-GraphSAGE by 2.52% in Macro-F1. Notably, standard GAT achieves only 90.41% Macro-F1, which is comparable to the vanilla MLP (90.82%), indicating that graph attention alone, without edge-weight modulation and multi-source fusion, does not sufficiently exploit the relational structure for fine-grained classification. Due to the fact that Macro-F1 is computed based on averaging of class-wise F1 scores equally, this improvement means that the proposed approach outperforms traditional models in recognizing classes having low number of training instances. This fact is perfectly illustrated by the rationale for choosing the multi-source data fusion framework where both KNN neighborhood embedding and boosting assumption account for the small size of training datasets.
The confusion matrixes displayed in Figure 2 further illustrate this point by providing visual examples of how the minority class can be favored through the proposed EW-GAT. All seven Infiltration instances, four SQL Injection samples, and three Heartbleed cases are correctly classified by EW-GAT, while Gradient Boosting makes an error when identifying one sample of each minority category. This analysis demonstrates that the observed Macro-F1 improvement reflects genuine discriminative capability rather than statistical artefact. Disadvantages of other classifiers that show Macro-F1 values of 46.11% and 76.21% for AdaBoost and Gaussian NB, respectively, also highlight the fragility of certain algorithms in the event of extremely unbalanced data. Figure 3 presents the confusion matrices on CSE-CIC-IDS2018. EW-GAT correctly classifies all 11 SQL Injection test instances, 15 of 16 Brute Force – XSS instances, and 33 of 35 Brute Force – Web instances. In contrast, Gradient Boosting misclassifies three SQL Injection samples and four Brute Force – XSS samples, predominantly confusing them with the semantically related Brute Force – Web category. Among the DDoS sub-types, EW-GAT exhibits minor mutual confusion between LOIC-HTTP and HOIC (two instances each), reflecting the genuine behavioral overlap of these volumetric attacks, while Gradient Boosting produces seven cross-DDoS misclassifications.
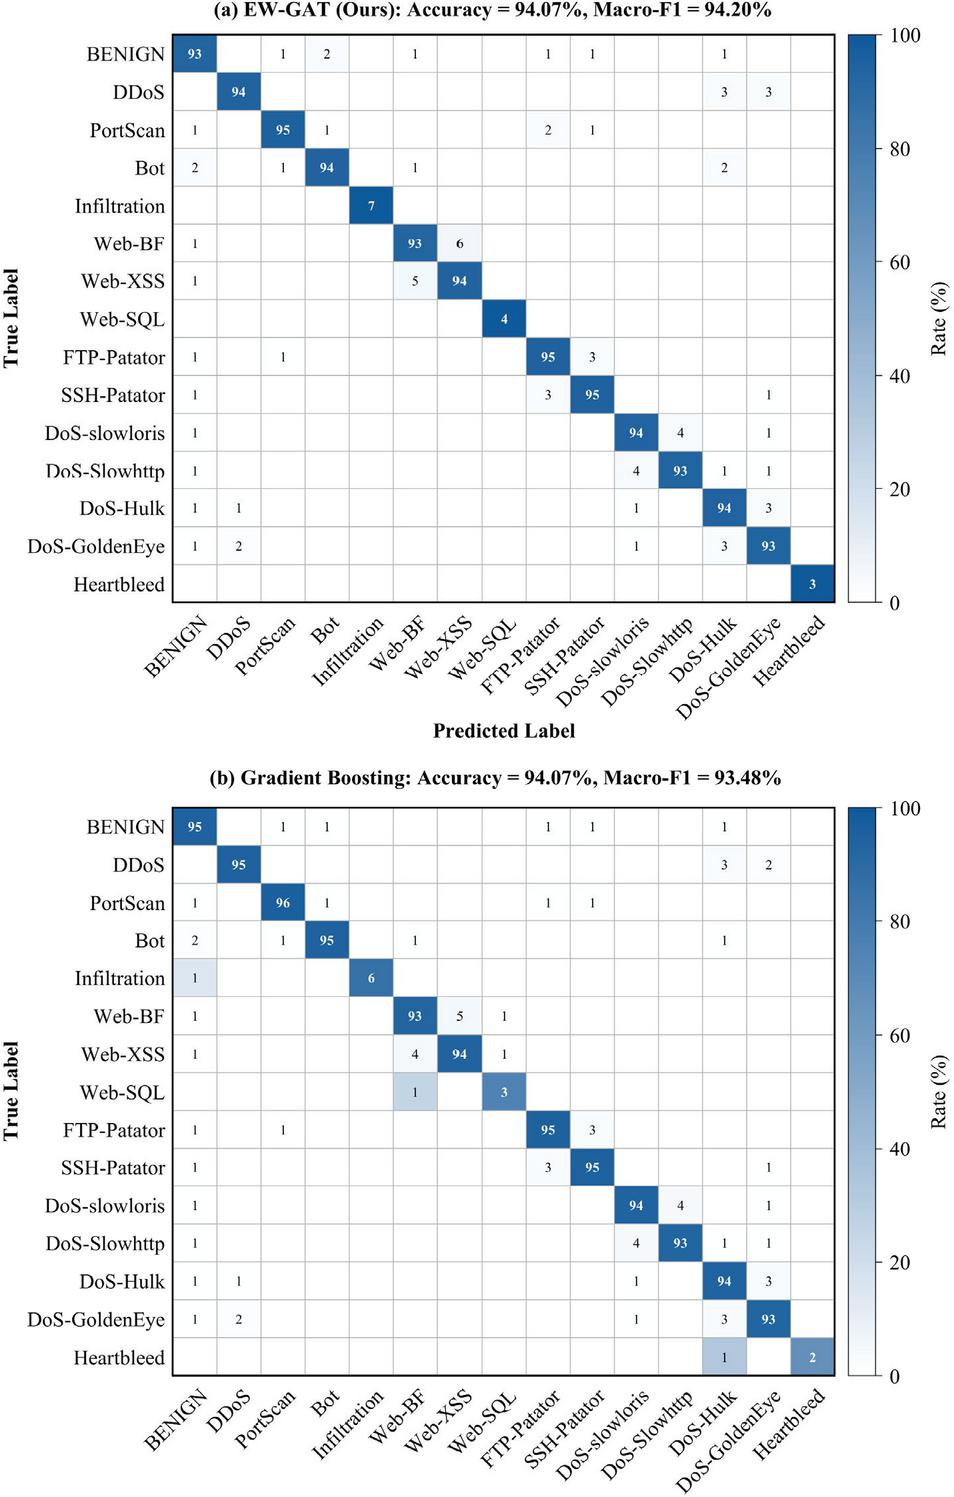
Figure 2 Confusion matrix comparison between the proposed EW-GAT and the strongest baseline on the CIC-IDS2017 multi-class classification task.
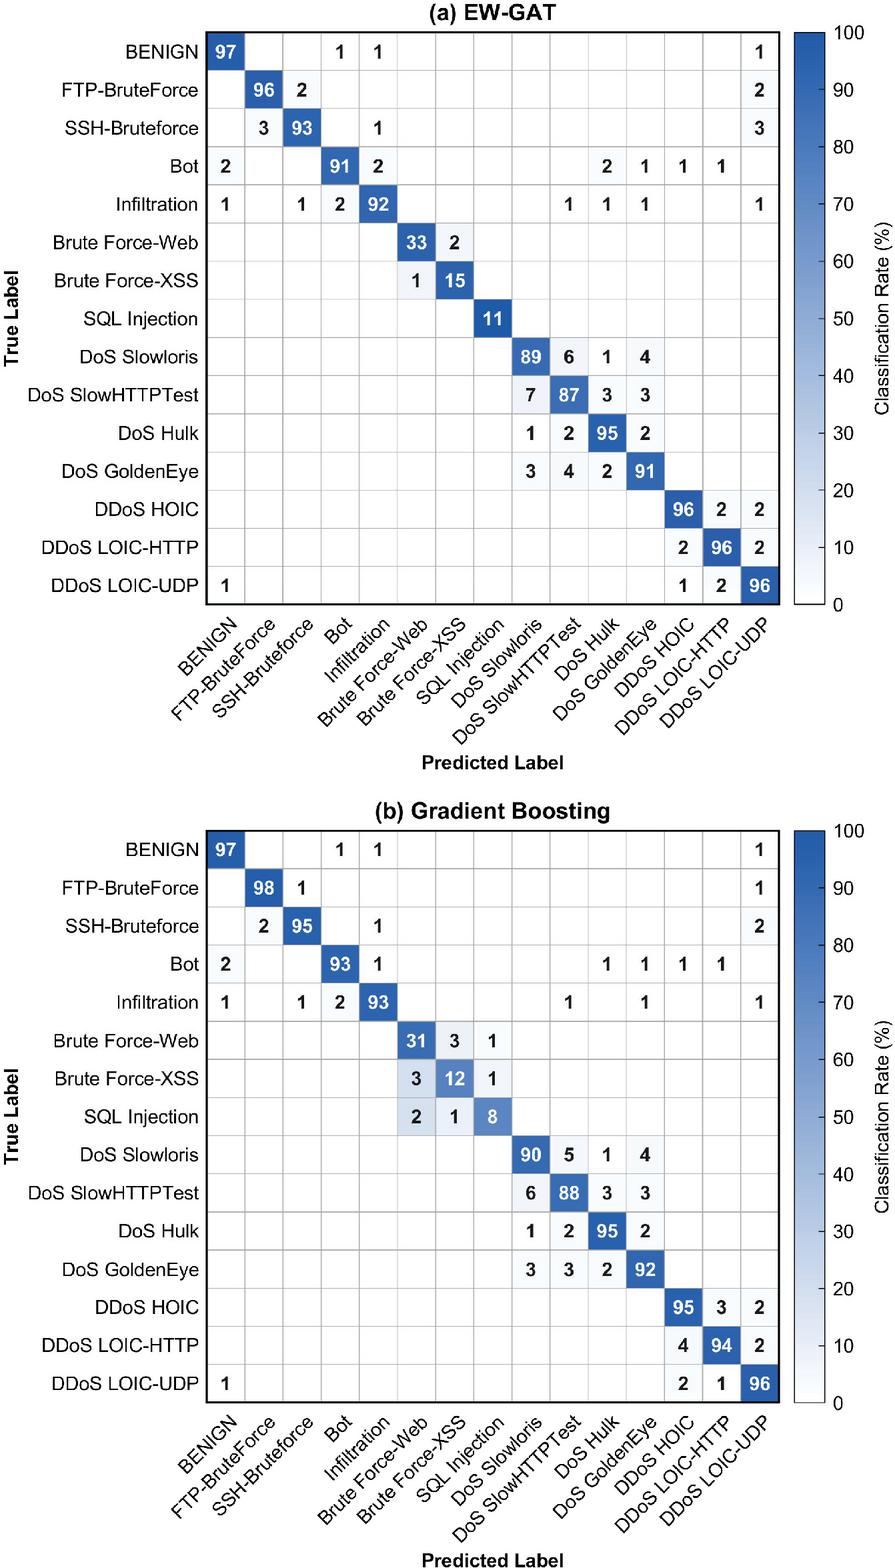
Figure 3 Confusion matrix comparison between the proposed EW-GAT and the strongest baseline on the CSE-CIC-IDS2018 multi-class classification task.
3.3 Comparative Experimental Results
Building on the per-metric comparison in Section 3.2, this subsection analyses baselines by model family. The 14 baselines described in Table 3 are split into five families: tree ensemble methods (Decision Tree, Random Forest, Extra Trees, Gradient Boosting, AdaBoost), kernel and probabilistic classifiers (SVM, Gaussian NB), linear regressions (Softmax Regression), neural networks (MLP) alongside KNN, and graph neural networks (GCN, GAT, GraphSAGE, E-GraphSAGE).
Tree-based ensembles provide the most outstanding baseline performances with Accuracy scores for Gradient Boosting and Random Forest being 94.07% and 93.17%, respectively. Such results are consistent with the known success of the ensemble learning technique in traffic datasets due to splitting features based on different statistical properties of various attack categories. The AdaBoost approach demonstrates a noticeable decrease in accuracy score with 59.92%, implying that the re-weighting mechanism of training examples is highly susceptible to the problem of severe class imbalance because the repeated emphasis on misclassified minority instances produces more noise rather than improving the decision boundary. Both kernel-based and probabilistic techniques demonstrated relatively weak but comparable results, which shows that there is a restriction imposed by the assumptions behind their approaches in case of dealing with multi-dimensional, correlated flow features. The similar behavior was observed for linear Softmax Regression, indicating that flow-level traffic classification is inherently nonlinear in nature, while neural baseline MLP shows 92.59% Accuracy and 90.82% Macro-F1 score, far behind tree-based ensembles despite its superior representational capability. Such differences indicate that, under limited samples, solely relying on features’ learning ability for deep models is challenging to take advantage of their representational power without introducing any prior structures. As shown above, the proposed EW-GAT model outperforms all other categories of models by incorporating inter-flow dependency using similarity graph and integrating complementary features within each node. The increase of Accuracy and Macro-F1 of 1.48% and 3.38% over neural baseline MLP confirms that, compared with tree-based ensembles or solely neural models, relational reasoning based on graph structures together with multi-source feature integration brings additional advantages. Cross-dataset comparison further strengthens the generalizability argument. EW-GAT consistently achieves the highest Macro-F1 across both CIC-IDS2017 and CSE-CIC-IDS2018, despite the two datasets differing in network topology (local laboratory vs. cloud-based AWS), attack composition (PortScan/Heartbleed vs. DDoS sub-types), and minority-class identity. The Macro-F1 improvement over the strongest baseline is 0.72% on CIC-IDS2017 and 0.83% on CSE-CIC-IDS2018.
Graph neural networks (GCN, GAT, GraphSAGE, E-GraphSAGE) constitute the fifth family. E-GraphSAGE achieves the highest Macro-F1 of 91.87% among the four GNN baselines on CIC-IDS2017, benefiting from its edge feature incorporation, but still falls short of EW-GAT by 2.33%, indicating that concatenation-based edge utilization is less effective than multiplicative edge-weight modulation. Standard GAT achieves only 90.41% Macro-F1, comparable to MLP (90.82%), suggesting that attention alone does not sufficiently exploit relational structure without behavior-aware edge weights and enriched node representations. The consistent ranking GCN GraphSAGE GAT E-GraphSAGE EW-GAT across both datasets confirms that each proposed component contributes incrementally beyond existing GNN architectures.
3.4 Ablation Experimental Results
To verify the independent contribution of each design component in the proposed method, four ablated variants are constructed and compared against the complete model under the same 15-class classification setting on both datasets. The results on CIC-IDS2017 and CSE-CIC-IDS2018 are summarized in Table 4.
Table 4 Ablation experimental results (%)
| Setting | Accuracy | Precision | Recall | Macro-F1 |
| Panel A: CIC-IDS2017 | ||||
| MLP without graph | 92.59 | 93.34 | 90.20 | 90.82 |
| EW-GAT without edge weight | 92.59 | 91.09 | 89.43 | 90.00 |
| EW-GAT with random graph | 88.31 | 85.52 | 84.70 | 84.91 |
| EW-GAT with statistical features only | 92.02 | 92.29 | 88.97 | 89.65 |
| Proposed EW-GAT | 94.07 | 94.68 | 93.93 | 94.20 |
| Panel B: CSE-CIC-IDS2018 | ||||
| MLP without graph | 91.44 | 92.07 | 88.83 | 89.25 |
| EW-GAT without edge weight | 91.28 | 89.71 | 87.92 | 88.53 |
| EW-GAT with random graph | 87.05 | 84.26 | 83.08 | 83.41 |
| EW-GAT with statistical features only | 90.89 | 91.14 | 87.42 | 88.19 |
| Proposed EW-GAT | 93.33 | 93.85 | 92.63 | 93.14 |
As presented in Table 4, replacing the semantic similarity graph with the random graph leads to the greatest performance drop, with Accuracy and Macro-F1 reduced by 5.76% and 9.29%, respectively, as compared to the complete architecture. Based on the evidence provided, it can be inferred that the discrimination ability of the proposed model is largely determined by the degree of behavioral proximity represented within the graph, rather than by the attention mechanism. Disregarding the weights of the connections while maintaining the graph structure yields 90.00% for the Macro-F1 measure, which is relatively close to the vanilla MLP’s results. The constant weights of the edges virtually negate the benefit of numerical behavioral proximity in the message passing operation. The model variant utilizing only statistical properties without employing the KNN neighbors and priors achieves 92.02% for the Accuracy metric and 89.65% for the Macro-F1 measure, being slightly inferior to the complete architecture by 4.55% regarding the latter score. The above findings indicate the importance of considering contextual and prior information within node embeddings during classification tasks for separable behaviors through statistical means.
On CSE-CIC-IDS2018 (Table 4, Panel B), ablation results follow the same degradation pattern. Replacing the similarity graph with a random graph leads to a Macro-F1 drop of 9.73%, slightly larger than the 9.29% on CIC-IDS2017, attributable to the three DDoS sub-types whose fine-grained distinction depends heavily on the graph structural prior. Removing edge weights yields 88.53% Macro-F1, and using statistical features only achieves 88.19%, both consistent with the CIC-IDS2017 ablation ranking, providing cross-dataset evidence that each component contributes non-redundantly.
3.5 Parameter Sensitivity Analysis
Parameter is directly responsible for defining the receptive field of the nodes in the similarity graph and hence significantly affects the structural sparsity as well as the informativeness of the propagation model. In order to analyze the impact of parameter K on the effectiveness of the model, five different values of are assessed using the multi-class classification problem with their accuracies and Macro-F1 scores listed in Table 5 and Figure 4.
Table 5 Parameter sensitivity analysis of on the multi-class classification task (%)
| K | Accuracy | Macro-F1 |
| Panel A: CIC-IDS2017 | ||
| 3 | 93.99 | 93.23 |
| 5 | 93.91 | 93.76 |
| 10 | 94.07 | 94.20 |
| 15 | 94.07 | 94.20 |
| 20 | 93.99 | 94.14 |
| Panel B: CSE-CIC-IDS2018 | ||
| 3 | 92.75 | 91.86 |
| 5 | 93.01 | 92.57 |
| 10 | 93.25 | 93.06 |
| 15 | 93.33 | 93.14 |
| 20 | 93.17 | 92.89 |
As can be seen from Table 5 and Figure 4, the performance graphs follow the common up-peak-down trend. With the value of being too small, there is not enough contextual information for discriminating minority classes effectively, as can be noted from the low value of Macro-F1 (93.23%) with . When rises to 10, Accuracy and Macro-F1 obtain the best performance values of 94.07% and 94.20%, showing that the selected size provides a proper trade-off between context exploration and noise reduction. The flat performance graph at means that performance does not significantly change with different sizes of in this range, which would be quite helpful for practical implementation. Increasing the size to causes performance drop, which is likely to be caused by introducing too many unrelated samples in neighborhood. As can be seen from Figure 4, on CSE-CIC-IDS2018, the optimal K value is 15, achieving 93.14% Macro-F1. The performance plateau observed at on CIC-IDS2017 is also present on CSE-CIC-IDS2018 at .
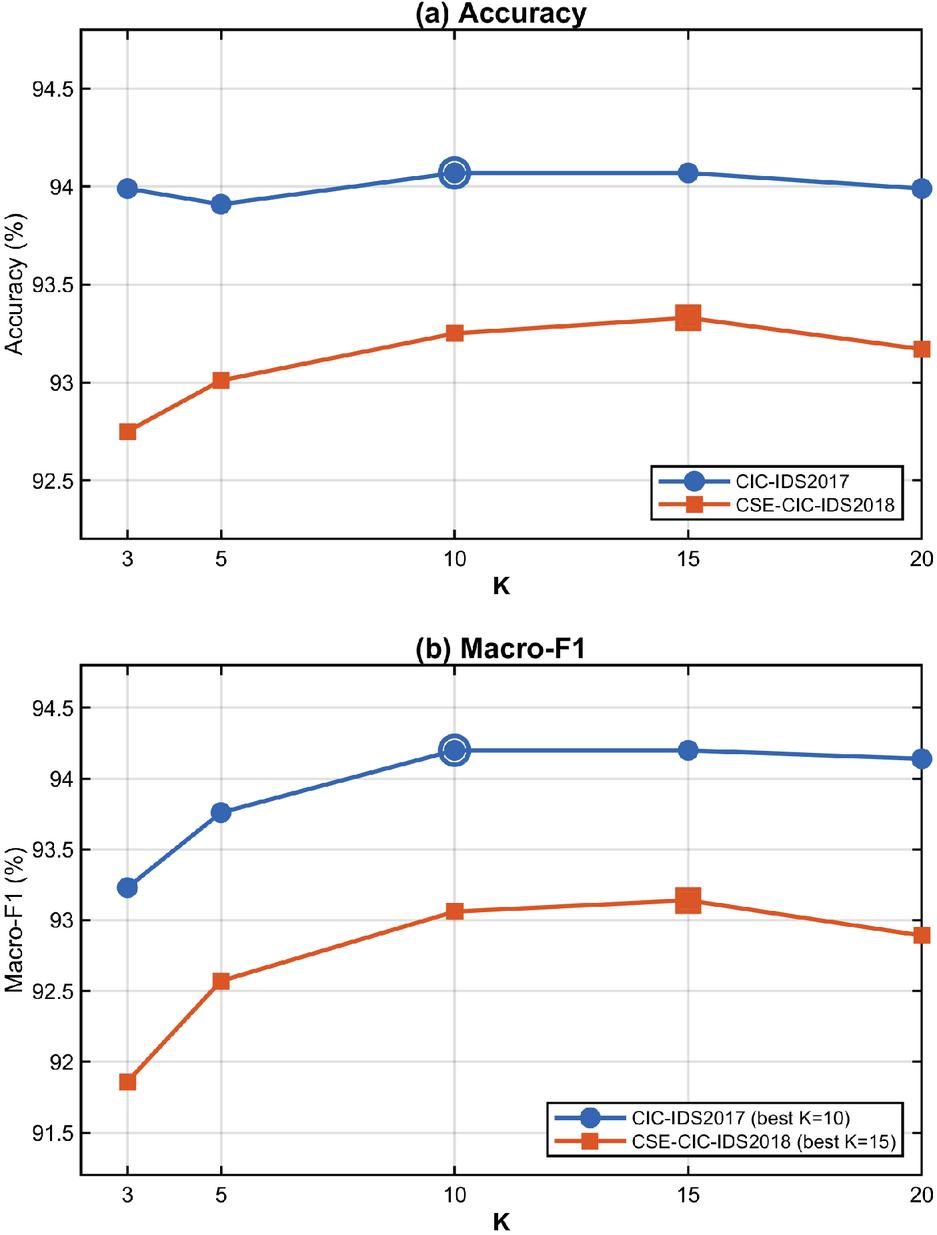
Figure 4 Macro-F1 variation under different K values on CIC-IDS2017 and CSE-CIC-IDS2018.
4 Discussion
4.1 Effectiveness Analysis of Graph Structure Modeling
As can be clearly seen from the experimental results presented in Section 3, using the graphs for modeling gives an absolute discriminative superiority over models based on planar representations in detecting the malicious traffic that uses the encryption methods. Upon analyzing the reason behind such superiority, it turns out that this comes from a change of paradigm that deals with modeling the dependencies between flows. Traditionally, a flow is regarded as a single sample to make predictions about it. This approach hinders any potential ability for recognizing consistent behavioral patterns that malicious flows may exhibit within the population (Anderson et al., 2018; Wang et al., 2022). In contrast, using graphs makes it possible for the classifier to be aware of its neighbors’ behavior as well (Cai et al., 2025; Han et al., 2024).
The structure of the graph, however, makes this reasoning effective or not for discriminating. Relational graphs built based on connectivity or time adjacency tend to spread the signal amongst flows communicating with the same endpoint nodes while displaying distinct behavior (Diao et al., 2023; Y. Zhu et al., 2023). This results in introducing noise instead of providing any useful information. Similarity graphs, in contrast, ensure the congruence between the topology of the graph and the semantics of behavior, which allows for propagation of the messages within consistent semantic neighborhoods. Severe performance degradation observed in the ablation study when a relational graph was substituted with a random graph can be considered as direct evidence in favor of the above hypothesis, since it occurs due to the mismatch between the structure and semantics without modifying any learnable parameters.
In this context, the role of graph structure modeling cannot be considered merely an optimization. Instead, it enables a reconsideration of encrypted traffic classification as a task involving relational reasoning in behavior-coherent clusters, which provides a more fundamental approach to tackle the issue of heterogeneity in today’s malicious traffic. It also suggests that the future development of graph structures for traffic analysis must consider how the adjacency relationship is constructed. The consistent superiority of the similarity graph over random graphs on both CIC-IDS2017 (9.29% Macro-F1 drop) and CSE-CIC-IDS2018 (9.73% drop) provides dataset-independent evidence that behavioral proximity in the graph topology, rather than any specific attack distribution, is the primary driver of discriminative performance.
4.2 Effectiveness Analysis of Multi-Source Feature Fusion and Edge-Weight Mechanism
Beyond the structural contribution of the similarity graph itself, the discriminative capability of the proposed approach also depends on how the information carried by nodes and edges is organized during message passing. The ablation results suggest that two components, namely multi-source feature fusion at the node level and edge-weight modulation at the propagation level, each make non-redundant contributions and together constitute the core of the EW-GAT design.
The multi-source data fusion framework resolves the problem encountered in feature-oriented approaches where the nodes in the graph model are represented exclusively by their individual characteristics, without knowledge about their neighborhood information in the initial phase (Cai et al., 2025). In the process of combining the flow level data with KNN-derived neighbor data and prior probability of classes generated through a boosting algorithm, the method effectively integrates three sources of information as node features: the intrinsic behavior of each instance; contextual agreement seen within the similarity graph; and the discriminative signal from a rough classification of different categories using boosted methods, which is highly effective especially for small minority classes.
This approach allows the attention weights to adapt both to the node features and the pre-calculated behavioral similarity of the linked flows. Conventional graph attention assumes the same degree of likelihood for any neighbor to be used as evidence, and this assumption was reported to cause an adverse effect on the informative signal when the neighborhood is composed of heterogenous nodes (Y. Zhu et al., 2023). This paper suggests the adoption of a more informed weighting that reflects the correlation between attention and behavioral closeness. This would enable the more behaviorally similar neighbors to carry a larger weight in updating the embedding.
From a mathematical perspective, the multiplicative formulation places the edge weight inside the exponential of the softmax function, which amplifies the difference in attention logits between high-similarity and low-similarity neighbors before normalization. In contrast, concatenation-based approaches, such as E-GraphSAGE, append edge features as additional input dimensions to a shared linear transformation, where the influence of edge information is mediated by learned parameters and may be diluted by the node feature dimensions. The ablation results in Table 4 provide empirical support for this distinction: removing edge weights reduces Macro-F1 by 4.20% on CIC-IDS2017 and 4.61% on CSE-CIC-IDS2018, confirming that the multiplicative coupling between edge weights and attention coefficients is a critical component of the model.
Viewed jointly, node-level fusion and edge-level modulation act on different aspects of the same relational reasoning process. The former enriches what each node knows about itself before propagation begins, while the latter governs how reliably that knowledge flows across the graph during aggregation. Their cooperation explains why the full model consistently outperforms any variant lacking either component, and also suggests that future graph-based designs for traffic analysis should treat node enrichment and edge-aware propagation as coupled rather than independent design choices. The robustness of the multi-source fusion scheme is further evidenced by its effectiveness under two distinct minority-class configurations: Infiltration/SQL Injection/Heartbleed in CIC-IDS2017 versus Brute Force–Web/Brute Force–XSS/SQL Injection in CSE-CIC-IDS2018. In both cases, the fusion of KNN neighborhood features and gradient boosting priors consistently improves minority-class recognition, confirming that the design is not tuned to a specific class structure.
4.3 Analysis of Recognition Differences Among Different Traffic Classes
Performance at class level displayed in the confusion matrices in Figure 2 clearly indicates the presence of significant heterogeneity, and an exploration of the behavioral reasons for this discrepancy seems warranted. The suggested method correctly identifies all test samples of the three scarcest categories, namely Infiltration, SQL Injection, and Heartbleed. The fact that such performance differs from the mistakes committed by the strongest baseline model on precisely these classes cannot be viewed as a coincidence. Indeed, in case of lack of sufficient number of training examples, statistical features are unlikely to produce a robust decision boundary (Rezaei and Liu, 2019).
Analysis of the residual misclassified samples further reveals a structural component. Misclassification errors cluster around semantically similar families, including the ones that arise within families like DoS (Slowloris, Slowhttptest, Hulk, GoldenEye) and Web Attack (Brute Force and XSS). This is not an indication of shortcomings of the classifier, but rather the similarity of their attack methods. Given that packets of those attacks exhibit similar packet dispatching patterns, their feature space locations necessarily overlap (Cui et al., 2023). Since the errors that involve other families do not occur at all, it can be concluded that the representation of features is able to preserve coarse macro-behavioral differences between the flows. From the point of view of improvement possibilities, this observation suggests that the classification of malicious encrypted flows can be improved by using finer-grained protocol behavior information.
On CSE-CIC-IDS2018, residual misclassifications follow the same intra-family clustering pattern observed on CIC-IDS2017, with the four DoS variants exhibiting comparable mutual confusion. An additional source of intra-family confusion emerges among the three DDoS sub-types (HOIC, LOIC-HTTP, LOIC-UDP). These attacks share the common strategy of overwhelming the target with volumetric traffic, resulting in overlapping packet-size and inter-arrival-time distributions. However, LOIC-UDP operates exclusively over the UDP protocol, while HOIC and LOIC-HTTP both use TCP/HTTP, making the latter pair more difficult to separate. The similarity graph partially alleviates this by assigning lower edge weights between UDP-based and TCP-based DDoS flows, thereby reducing cross-protocol message passing. This structural prior is absent in traditional feature-based classifiers, explaining the larger Macro-F1 gap between EW-GAT and Gradient Boosting on CSE-CIC-IDS2018 (0.83%) compared to CIC-IDS2017 (0.72%). The cross-dataset consistency of this misclassification structure confirms that the errors reflect genuine behavioral similarity rather than dataset-specific artifacts.
4.4 Limitations and Future Work
In spite of the promising results discussed above, there are some potential shortcomings of the proposed framework, which need to be explicitly stated. The experimental evaluation has been conducted on two representative benchmarks collected under different network environments (local laboratory and cloud-based AWS), and the results confirm the generalizability of EW-GAT across varying topologies, attack compositions, and imbalance structures. Nevertheless, further validation on datasets containing entirely unknown attack types, real-world production traffic, or adversarial perturbations remains an open direction. Some existing studies confirm that neural networks for traffic classification are sensitive to label noise and data drift during different periods of data collection (Malekghaini et al., 2023; Qing et al., 2024). In addition, the limited sample size of minority classes, with as few as three test instances for Heartbleed, constrains the statistical significance of the per-class results. Although the stratified sampling procedure preserves the original class-imbalance ratios and all models are evaluated on identical subsets (ensuring fair relative comparison), larger-scale evaluation on additional datasets with full sample sizes is needed to further confirm the generalizability of the observed Macro-F1 advantage. Moreover, the similarity graph construction procedure is currently carried out offline on the entire training dataset and, thus, cannot be directly applied to online streaming traffic classification scenarios.
Future research will build upon the existing framework in several directions. One direction is to explore multi-view graph construction strategies that take into account statistics, timestamps, and payloads simultaneously since this combination was observed to provide a more holistic description of encrypted traffic behavior (Hong et al., 2023). Another direction concerns label efficiency, because the use of full supervision precludes its application in cases when only a few labeled instances are available. In such situations, methods based on label-efficient graph learning have already demonstrated their usefulness in intrusion detection applications (Deng et al., 2023). Incremental graph construction algorithms and training procedures resistant to adversarial attacks with encrypted packets are other potential directions for future work.
5 Conclusion
This study addresses the problem of malicious traffic detection and classification for encrypted flows, by presenting a model named EW-GAT (edge-weighted graph attention network), based on multi-source feature fusion. This work is motivated by the limitation of the classical graph learning approach in capturing behavior semantics via connectivity and aggregating neighborhood information with equal weight. The task of malicious traffic classification is modeled as relational reasoning of flows within behavior-consistent communities.
The designed model consists of three tightly connected components: a semantic similarity graph built via cosine similarity and Top- edge sparsification, which directly encodes behavioral closeness as edge weights; a multi-source fusion scheme that integrates flow-level statistical features, KNN neighborhood features, and class-prior probabilities from a gradient boosting model; and an edge-weighted attention mechanism that modulates attention coefficients with pre-computed edge weights to enable behavior-aware aggregation.
Thorough experimentation on two benchmarks, CIC-IDS2017 and CSE-CIC-IDS2018, validates the viability and generalizability of the designed approach across different network environments. On CIC-IDS2017, EW-GAT achieves 99.59% Accuracy on the binary task and 94.07% Accuracy with 94.20% Macro-F1 on the 15-class task. On CSE-CIC-IDS2018, EW-GAT achieves 99.53% Accuracy on the binary task and 93.33% Accuracy with 93.14% Macro-F1 on the 15-class task, consistently outperforming all baselines on both datasets. Through ablation study, it can be observed that using random graphs instead of similarity graphs causes the greatest Macro-F1 drops of 9.29% on CIC-IDS2017 and 9.73% on CSE-CIC-IDS2018, proving the complementarity of the three proposed techniques across different network environments. The performance gain is particularly evident for minority classes, with all instances from Infiltration, SQL Injection, and Heartbleed successfully classified. Further research would focus on extending the current model to multi-view graph generation, efficient training, and incremental graph learning.
Conflict of Interest
The authors declare no conflict of interest.
Data Availability Statement
The data that support the findings of this study are publicly available: CIC-IDS2017 at https://www.unb.ca/cic/datasets/ids-2017.html and CSE-CIC-IDS2018 at https://www.unb.ca/cic/datasets/ids-2018.html.
References
Anderson, B., Paul, S., and McGrew, D. (2018). Deciphering malware’s use of TLS (without decryption). Journal of Computer Virology and Hacking Techniques, 14(3), 195–211.
Bai, X., and Bai, Y. (2025). Equilibrium strategy of attack and defense in computer networks based on Markov signal game theory. Journal of Cyber Security and Mobility, 14(1), 127–154.
Cai, S., Tang, H., Chen, J., Lv, T., Zhao, W., and Huang, C. (2025). GSA-DT: A malicious traffic detection model based on graph self-attention network and decision tree. IEEE Transactions on Network and Service Management, 22(2), 2059–2073.
Chen, E. (2025). Analysis of e-commerce security protection technology based on YOLO algorithm optimized by lightweight neural network. Journal of Cyber Security and Mobility, 14(4), 849–876.
Chen, J., Song, L., Cai, S., Xie, H., Yin, S., and Ahmad, B. (2023). TLS-MHSA: An efficient detection model for encrypted malicious traffic based on multi-head self-attention mechanism. ACM Transactions on Privacy and Security, 26(4), 1–21.
Cui, S., Dong, C., Shen, M., Liu, Y., Jiang, B., and Lu, Z. (2023). CBSeq: A channel-level behavior sequence for encrypted malware traffic detection. IEEE Transactions on Information Forensics and Security, 18, 5011–5025.
Deng, X., Zhu, J., Pei, X., Zhang, L., Ling, Z., and Xue, K. (2023). Flow topology-based graph convolutional network for intrusion detection in label-limited IoT networks. IEEE Transactions on Network and Service Management, 20(1), 684–696.
Diao, Z., Xie, G., Wang, X., Ren, R., Meng, X., Zhang, G., Xie, K., and Qiao, M. (2023). EC-GCN: A encrypted traffic classification framework based on multi-scale graph convolution networks. Computer Networks, 224, 109614.
Fu, C., Li, Q., Shen, M., and Xu, K. (2023). Frequency domain feature based robust malicious traffic detection. IEEE/ACM Transactions on Networking, 31(1), 452–467.
Fu, C., Li, Q., and Xu, K. (2023). Detecting unknown encrypted malicious traffic in real time via flow interaction graph analysis. In Proceedings of the 30th Network and Distributed System Security Symposium (NDSS 2023). Internet Society.
Gilmer, J., Schoenholz, S. S., Riley, P. F., Vinyals, O., and Dahl, G. E. (2017). Neural message passing for quantum chemistry. In Proceedings of the 34th International Conference on Machine Learning (ICML 2017) (pp. 1263–1272). PMLR.
Han, X., Xu, G., Zhang, M., Yang, Z., Yu, Z., Huang, W., and Meng, C. (2024). DE-GNN: Dual embedding with graph neural network for fine-grained encrypted traffic classification. Computer Networks, 245, 110372.
Hong, Y., Li, Q., Yang, Y., and Shen, M. (2023). Graph based encrypted malicious traffic detection with hybrid analysis of multi-view features. Information Sciences, 644, 119229.
Hu, G., Xiao, X., Shen, M., Zhang, B., Yan, X., and Liu, Y. (2023). TCGNN: Packet-grained network traffic classification via graph neural networks. Engineering Applications of Artificial Intelligence, 123, 106531.
Huoh, T.-L., Luo, Y., Li, P., and Zhang, T. (2023). Flow-based encrypted network traffic classification with graph neural networks. IEEE Transactions on Network and Service Management, 20(2), 1224–1237.
Kipf, T. N., and Welling, M. (2017). Semi-supervised classification with graph convolutional networks. In Proceedings of the 5th International Conference on Learning Representations (ICLR 2017).
Lin, X., Xiong, G., Gou, G., Li, Z., Shi, J., and Yu, J. (2022). ET-BERT: A contextualized datagram representation with pre-training transformers for encrypted traffic classification. In Proceedings of the ACM Web Conference 2022 (WWW’22) (pp. 633–642). ACM.
Lo, W. W., Layeghy, S., Sarhan, M., Gallagher, M., and Portmann, M. (2022). E-GraphSAGE: A graph neural network based intrusion detection system for IoT. In NOMS 2022–2022 IEEE/IFIP Network Operations and Management Symposium (pp. 1–9). IEEE.
Malekghaini, N., Akbari, E., Salahuddin, M. A., Limam, N., Boutaba, R., Mathieu, B., Moteau, S., and Tuffin, S. (2023). Deep learning for encrypted traffic classification in the face of data drift: An empirical study. Computer Networks, 225, 109648.
Papadogiannaki, E., and Ioannidis, S. (2021). A survey on encrypted network traffic analysis applications, techniques, and countermeasures. ACM Computing Surveys, 54(6), 1–35.
Qing, Y., Yin, Q., Deng, X., Chen, Y., Liu, Z., Sun, K., Xu, K., Zhang, J., and Li, Q. (2024). Low-quality training data only? A robust framework for detecting encrypted malicious network traffic. In Proceedings of the 31st Network and Distributed System Security Symposium (NDSS 2024).
Rezaei, S., and Liu, X. (2019). Deep learning for encrypted traffic classification: An overview. IEEE Communications Magazine, 57(5), 76–81.
Sharafaldin, I., Lashkari, A. H., and Ghorbani, A. A. (2018). Toward generating a new intrusion detection dataset and intrusion traffic characterization. In Proceedings of the 4th International Conference on Information Systems Security and Privacy (ICISSP 2018) (pp. 108–116). SciTePress.
Shen, M., Ye, K., Liu, X., Zhu, L., Kang, J., Yu, S., Li, Q., and Xu, K. (2023). Machine learning-powered encrypted network traffic analysis: A comprehensive survey. IEEE Communications Surveys & Tutorials, 25(1), 791–824.
Shen, M., Zhang, J., Zhu, L., Xu, K., and Du, X. (2021). Accurate decentralized application identification via encrypted traffic analysis using graph neural networks. IEEE Transactions on Information Forensics and Security, 16, 2367–2380.
Velièkoviæ, P., Cucurull, G., Casanova, A., Romero, A., Liò, P., and Bengio, Y. (2018). Graph attention networks. In Proceedings of the 6th International Conference on Learning Representations (ICLR 2018).
Wang, L., Ma, X., Li, N., Lv, Q., Wang, Y., Huang, W., and Chen, H. (2023). TGPrint: Attack fingerprint classification on encrypted network traffic based graph convolution attention networks. Computers & Security, 135, 103466.
Wang, W., Zhu, M., Zeng, X., Ye, X., and Sheng, Y. (2017). Malware traffic classification using convolutional neural network for representation learning. In 2017 International Conference on Information Networking (ICOIN) (pp. 712–717). IEEE.
Wang, Z., Fok, K. W., and Thing, V. L. L. (2022). Machine learning for encrypted malicious traffic detection: Approaches, datasets and comparative study. Computers & Security, 113, 102542.
Yang, J., Jiang, X., Lei, Y., Liang, W., Ma, Z., and Li, S. (2024). MTSecurity: Privacy-preserving malicious traffic classification using graph neural network and transformer. IEEE Transactions on Network and Service Management, 21(4), 4678–4692.
Zang, X., Wang, T., Zhang, X., Gong, J., Gao, P., and Zhang, G. (2024). Encrypted malicious traffic detection based on natural language processing and deep learning. Computer Networks, 250, 110598.
Zhang, H., Meng, F., and Wang, Q. (2025). Computer network security system optimization based on improved neural network algorithm and data search. Journal of Cyber Security and Mobility, 14(1), 75–100.
Zhang, H., Yu, L., Xiao, X., Li, Q., Mercaldo, F., Luo, X., and Liu, Q. (2023). TFE-GNN: A temporal fusion encoder using graph neural networks for fine-grained encrypted traffic classification. In Proceedings of the ACM Web Conference 2023 (WWW’23) (pp. 2066–2075). ACM.
Zhong, M., Lin, M., Zhang, C., and Xu, Z. (2024). A survey on graph neural networks for intrusion detection systems: Methods, trends and challenges. Computers & Security, 141, 103821.
Zhu, S., Xu, X., Gao, H., and Xiao, F. (2023). CMTSNN: A deep learning model for multiclassification of abnormal and encrypted traffic of Internet of Things. IEEE Internet of Things Journal, 10(13), 11773–11791.
Zhu, Y., Tao, J., Wang, H., Yu, L., Luo, Y., Qi, T., … Xu, Y. (2023). DGNN: Accurate darknet application classification adopting attention graph neural network. IEEE Transactions on Network and Service Management, 21(2), 1660–1671.
Biography

Junli Zong was awarded a Master’s degree in Computer Applied Technology from Shanxi University, China, in 2016. Currently. She works as a Lecturer in the Department of Modern Educational Technology, Wuzhai Branch of Xinzhou Teachers University, Shanxi Province. Her research interests cover computer networks and security. She is mainly engaged in teaching and research on computer hardware and software, network security, smart education and AI-enabled education, and has published several professional academic papers.
Journal of Cyber Security and Mobility, Vol. 15_5, 1253–1286
doi: 10.13052/jcsm2245-1439.1555
© 2026 River Publishers